1978 Atlantic hurricane season
 | |
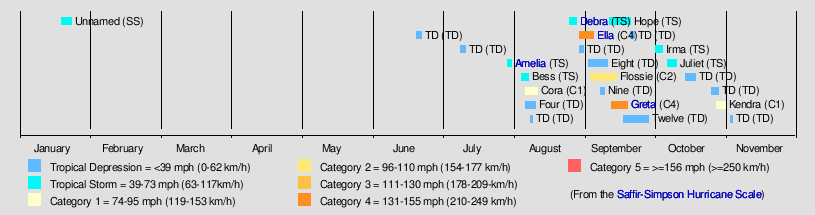
| Season summary map | |
| First system formed | January 18, 1978 |
|---|---|
| Last system dissipated | November 1, 1978 |
| Strongest storm1 | Greta – 947 mbar (hPa) (27.97 inHg), 130 mph (215 km/h) (1-minute sustained) |
| Total depressions | 24 |
| Total storms | 12 |
| Hurricanes | 5 |
| Major hurricanes (Cat. 3+) | 2 |
| Total fatalities | 41 |
| Total damage | $135 million (1978 USD) |
| 1Strongest storm is determined by lowest pressure | |
1976, 1977, 1978, 1979, 1980 | |
The 1978 Atlantic hurricane season was the last Atlantic hurricane season to use an all-female naming list. The hurricane season officially began on June 1, and ended on November 30. It was an above average season due to a subsiding El Niño. The first storm, a subtropical storm, developed unusually early – on January 18 – and dissipated five days later without causing any damage. At the end of July and early August, short-lived Tropical Storm Amelia caused extensive flooding in Texas after dropping as much as 48 in (1,200 mm) of rain. There were 33 deaths and $110 million (1978 USD) in damage. Tropical Storm Bess and Hurricane Cora resulted in only minor land impacts, while the latter was attributed to one fatality.
Later in August, Tropical Storm Debra produced widespread effects, though damage was also relatively minor. Hurricane Ella became the northernmost Category 4 hurricane while located at 38°N, and lashed the East Coast of the United States and Atlantic Canada with gusty winds and rip currents. Hurricanes Flossie and Kendra as well as Tropical Storms Hope, Irma, and Juliet caused minimal land impacts as a tropical cyclone. However, the precursor to Hurricane Kendra caused flooding in Puerto Rico. Hurricane Greta brought strong winds, high tides, and flooding to Central America, particularly Belize and Honduras. Greta resulted in about $25 million in damage and at least five fatalities. Overall, the storms of this season collectively caused $191 million in damage and 42 fatalities. Hurricane Greta crossed into the eastern pacific and was renamed Olivia.
Season summary
The Atlantic hurricane season officially began on June 1, 1978.[1] Although 24 tropical cyclones developed, only twelve of them reached tropical storm intensity,[2] which is slightly above the 1966-2009 average of 11.3 named storms per season.[3] Of the twelve tropical storms, five of them strengthened into a hurricane,[2] which is slightly below the 1966-2009 average of 6.2.[3] Two of the five hurricane became major hurricanes,[2] which is Category 3 or greater on the Saffir–Simpson hurricane wind scale.[4] Three tropical storms and two hurricanes made landfall during the season and caused at least 41 fatalities and $135 million.[5] Additionally, the precursor to Hurricane Kendra brought flooding to Puerto Rico, with $6 million in damage and one death.[6] The season officially ended on November 30, 1978.[1]
Tropical cyclogenesis began very early, with the development of a subtropical storm on January 18. It dissipated about five days later. However, the next tropical cyclone, an unnumbered depression, did not develop until June 21. In July, there were two systems, including an unnumbered tropical depression and Tropical Storm Amelia. Seven tropical cyclones formed in August, including Tropical Depression Four and tropical storms Bess and Debra and hurricanes Cora and Ella. There were also seven system in September – tropical depressions Eight, Nine, and Twelve, Tropical Storm Hope, and hurricanes Flossie and Greta. During the month of October, there were five tropical cyclones, with two unnumbered tropical depressions, tropical storms Irma and Juliet, and Hurricane Kendra. There was another unnumbered tropical depression in November, which dissipated on November 5.[2]
The season's activity was reflected with an accumulated cyclone energy (ACE) rating of 63.[7] ACE is, broadly speaking, a measure of the power of the hurricane multiplied by the length of time it existed, so storms that last a long time, as well as particularly strong hurricanes, have high ACEs. It is only calculated for full advisories on tropical systems at or exceeding 39 mph (63 km/h), which is tropical storm strength.[8]
Storms
Subtropical Storm One
| Subtropical storm (SSHWS) | |||
|---|---|---|---|
| |||
| Duration | January 18 – January 23 | ||
| Peak intensity | 45 mph (75 km/h) (1-min) 1002 mbar (hPa) | ||

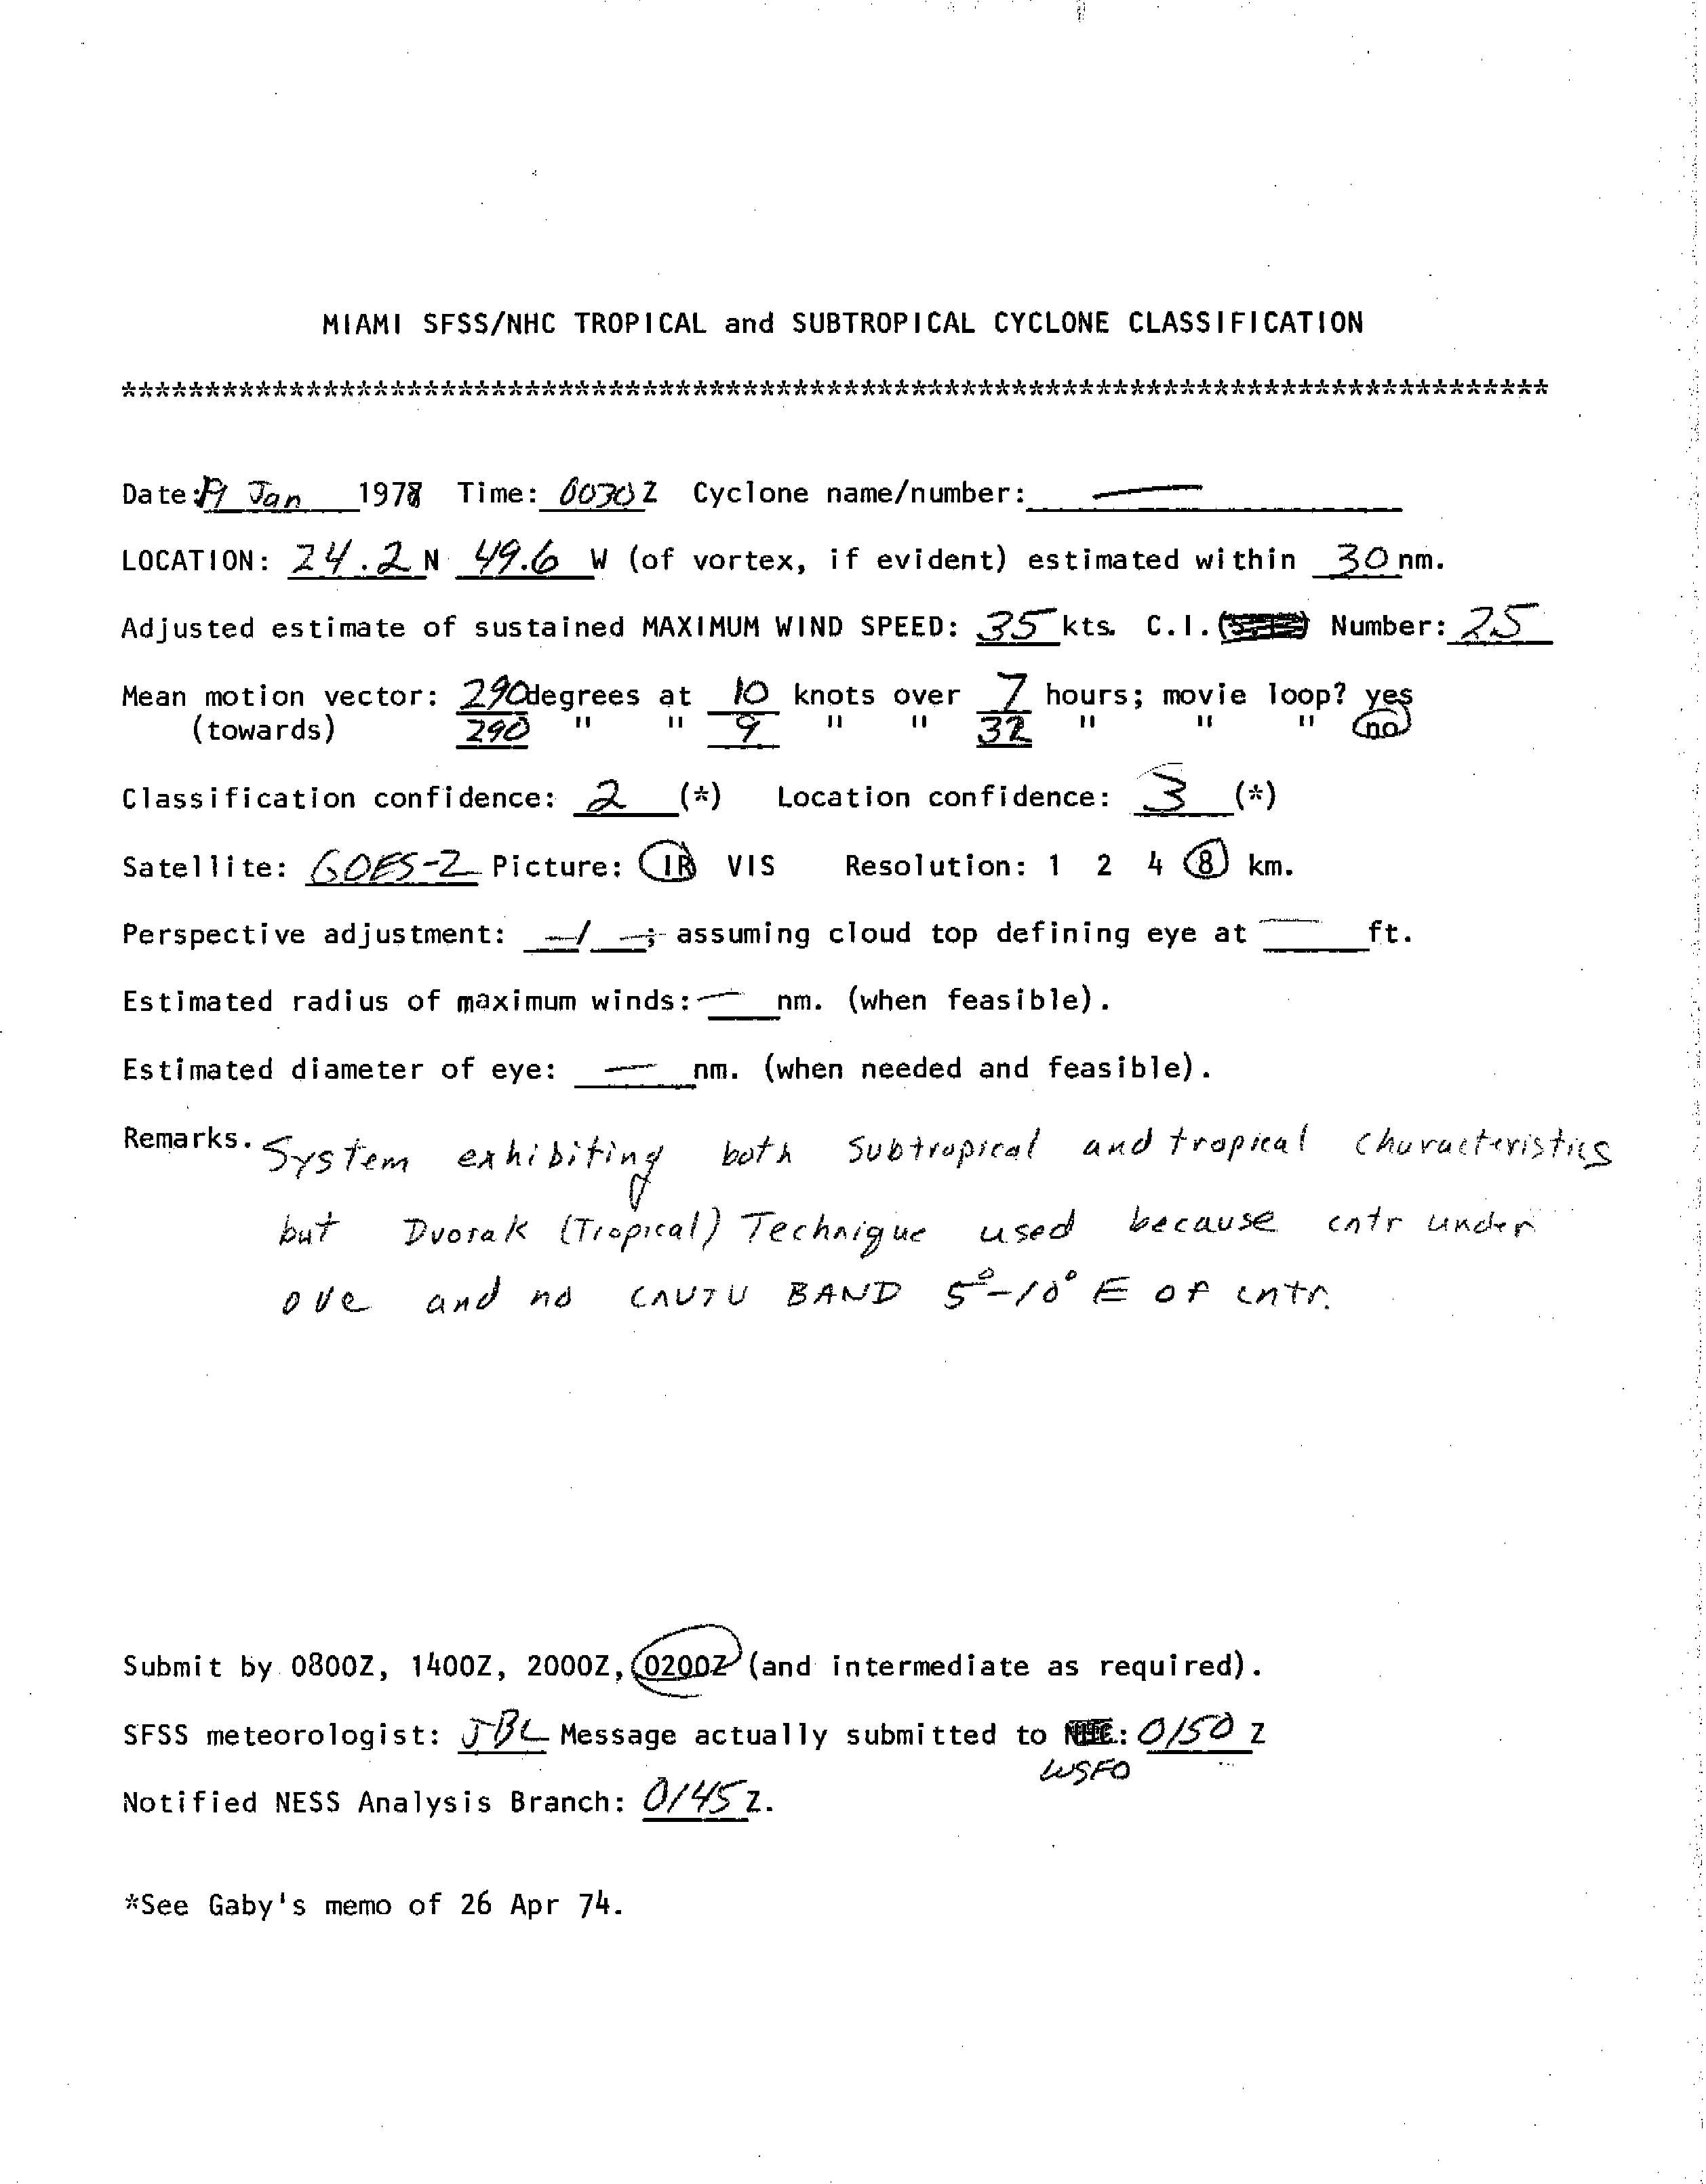
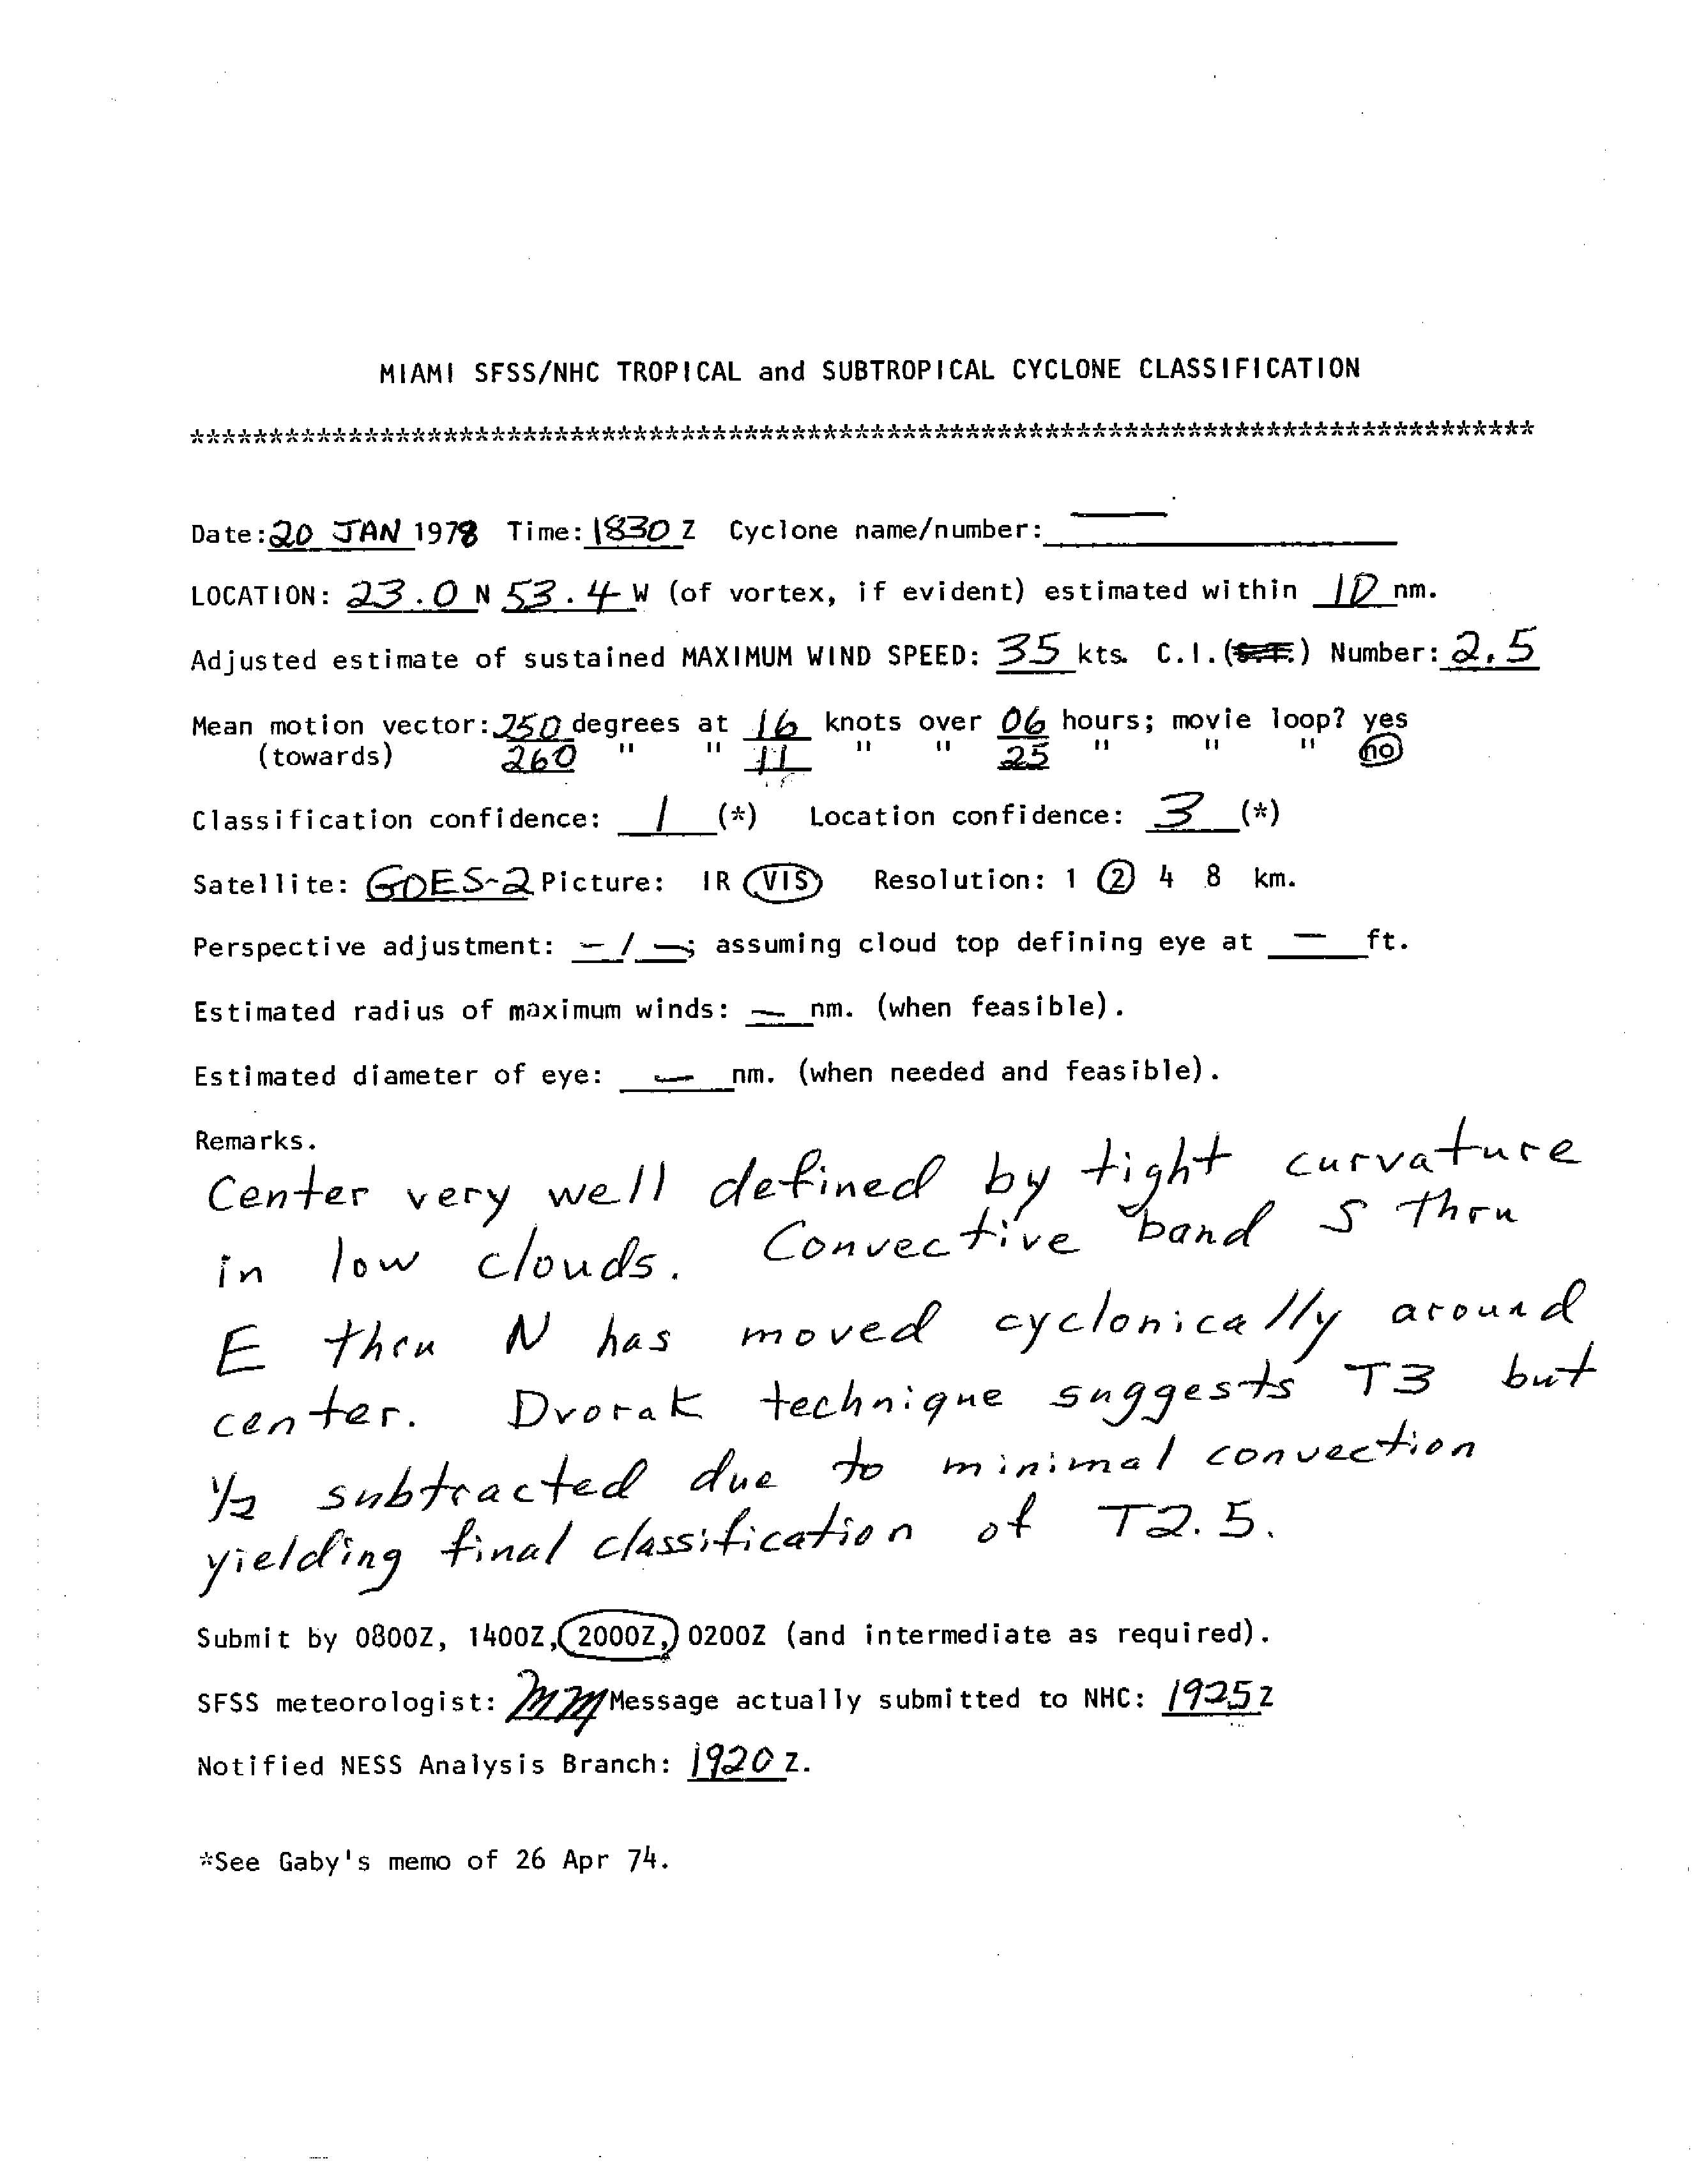
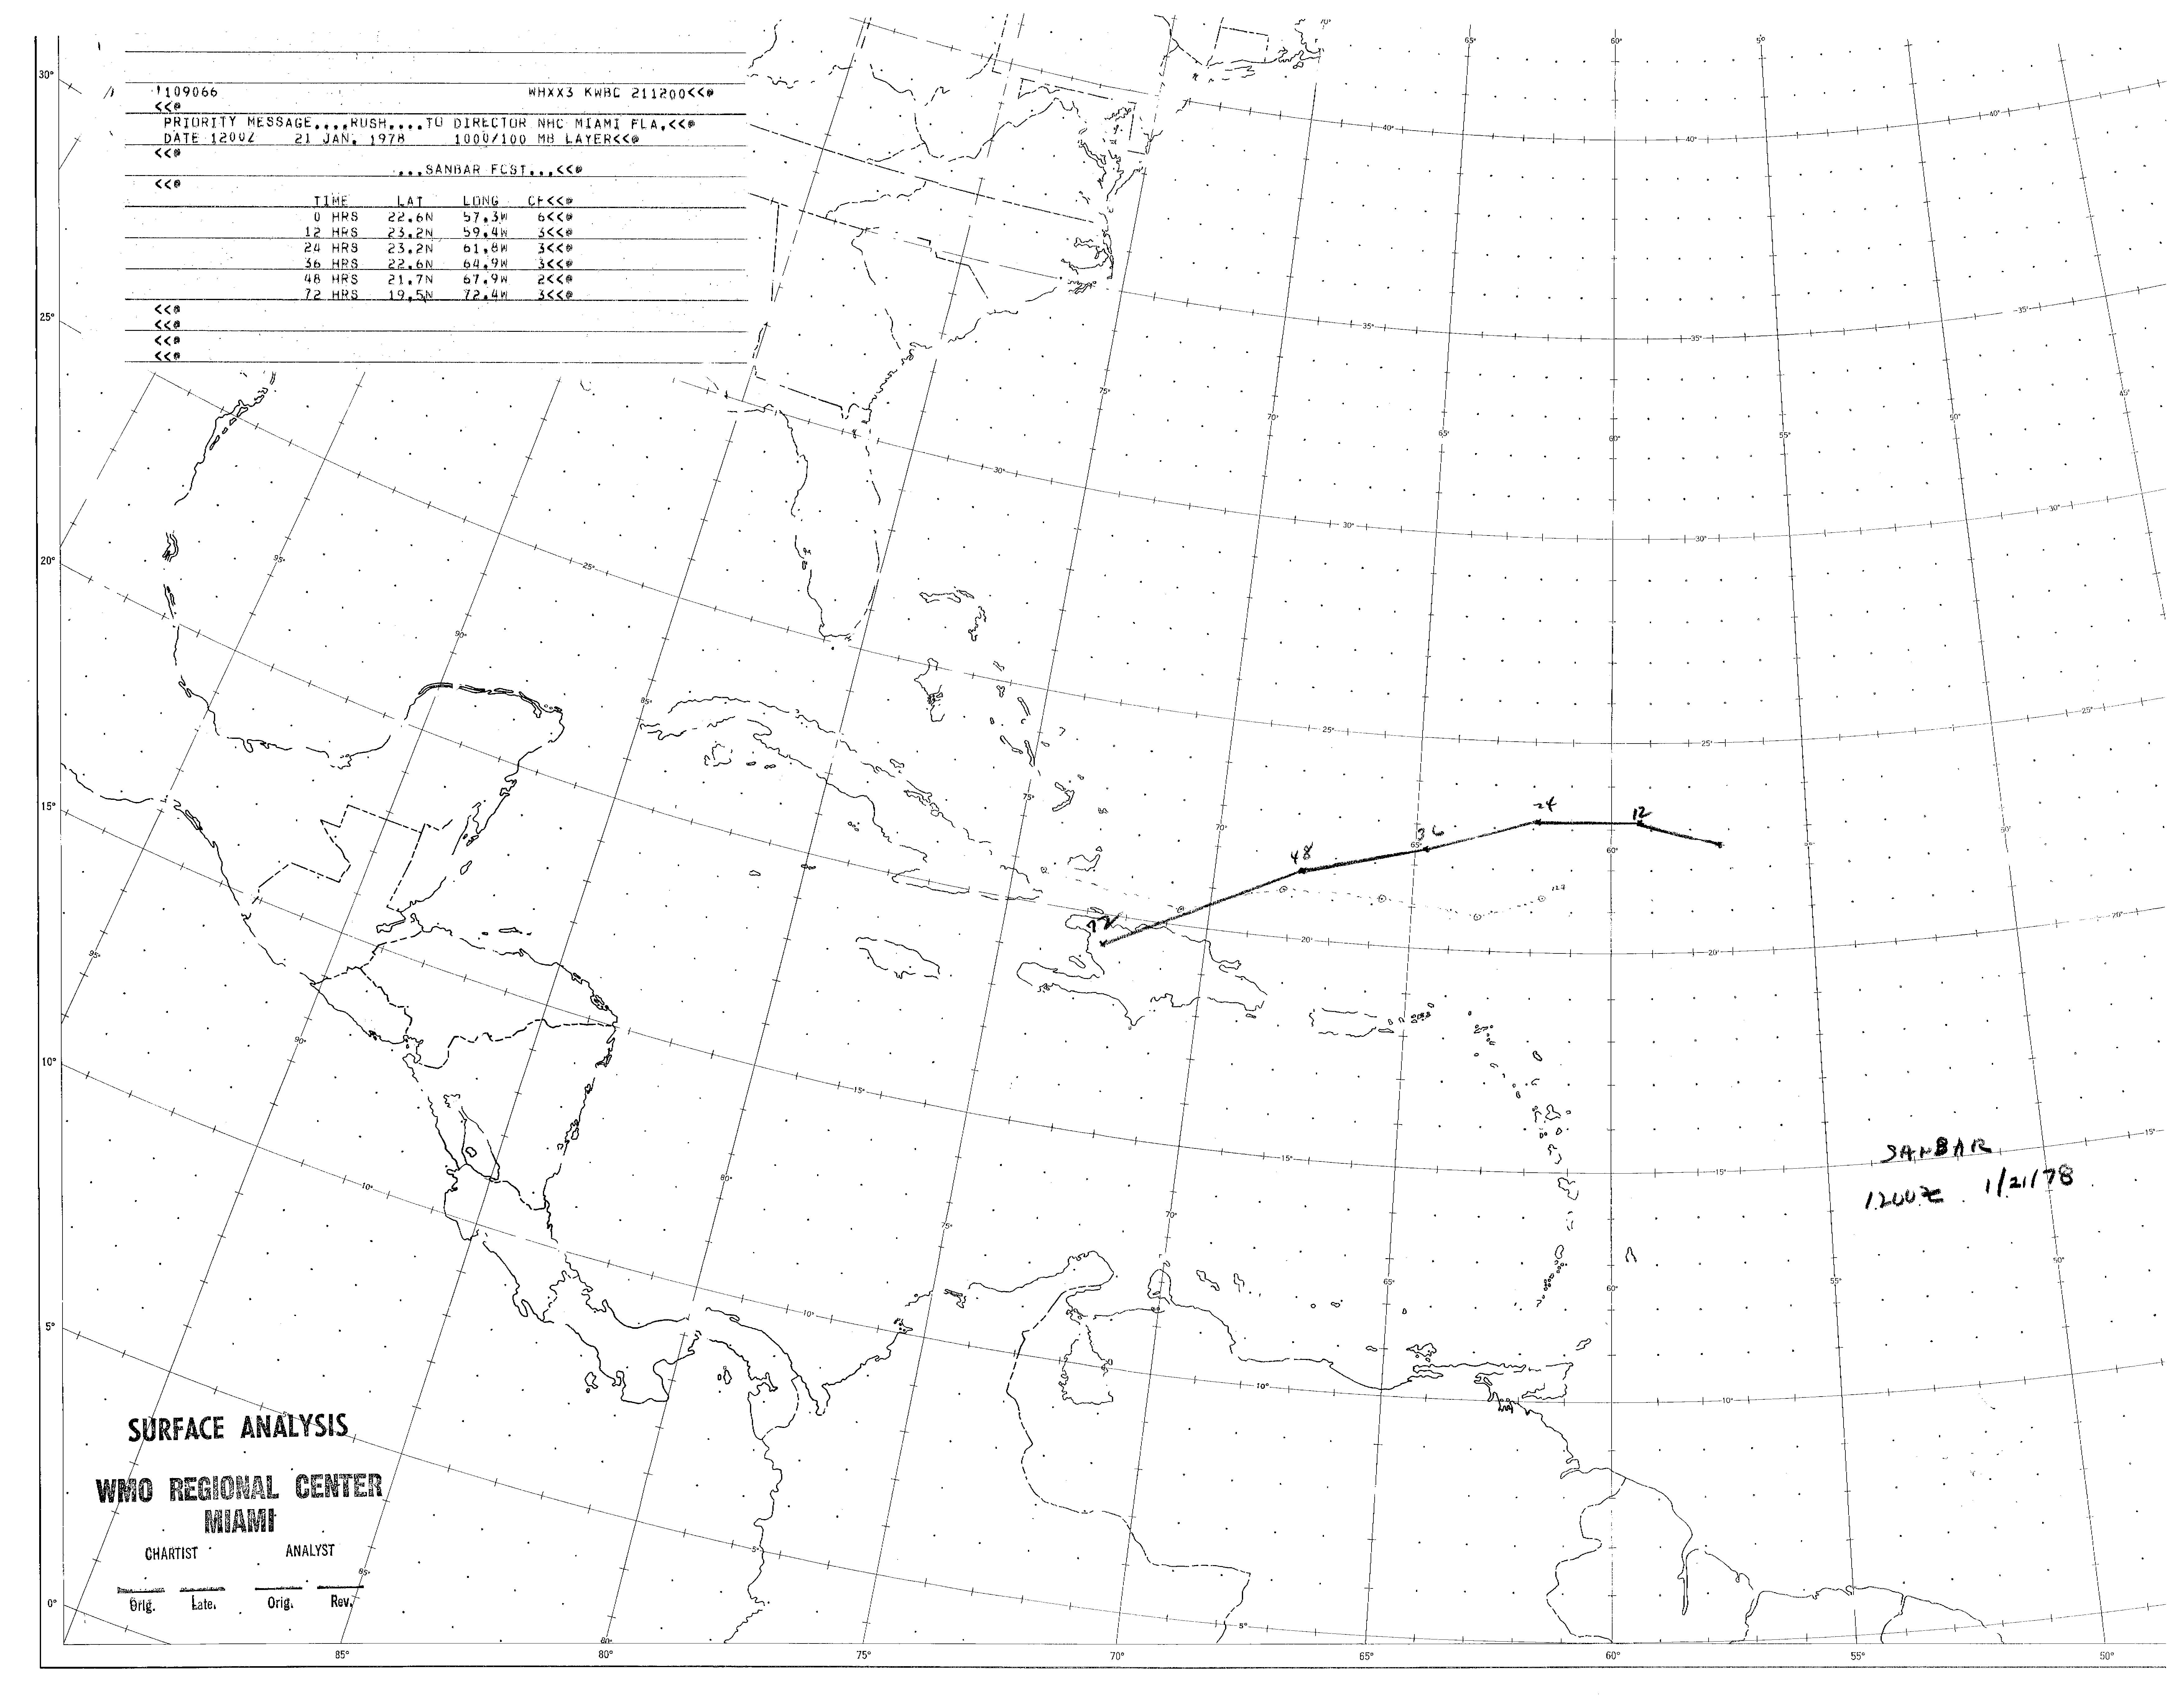
In the middle of January, an upper-level trough in the westerlies spawned a surface low-pressure area to the east-northeast of the Lesser Antilles to the south of the subtropical ridge. Isolated from the detrimental effects of the westerlies, it was initially non-tropical in nature and intensified through a baroclinic energy source, or one that derives energy from the interaction of cold and warm air. Convection increased slightly despite cool sea surface temperatures of around 75 °F (24 °C). At 1200 UTC on January 18, it organized into a subtropical depression about 1,725 mi (2,776 km) east-northeast of Puerto Rico while moving in a general westward track, which it would maintain for much of its duration.[6] The National Hurricane Center (NHC) initiated Dvorak classifications on the cyclone at 0000 UTC on January 19, assessing a Dvorak number of T2.5, suggesting both tropical and subtropical characteristics.[9] On the same day, the pressure gradient between the storm and the ridge produced gale-force winds.[6] By early on January 20, the storm maintained minimal convection near its center, with its primary rainband revolved cyclonically around its well-defined center.[10] Later that day, the storm strengthened into a subtropical storm and attained peak winds of 45 mph (72 km/h),[11] supported by both ship and Hurricane Hunters reports.[6]
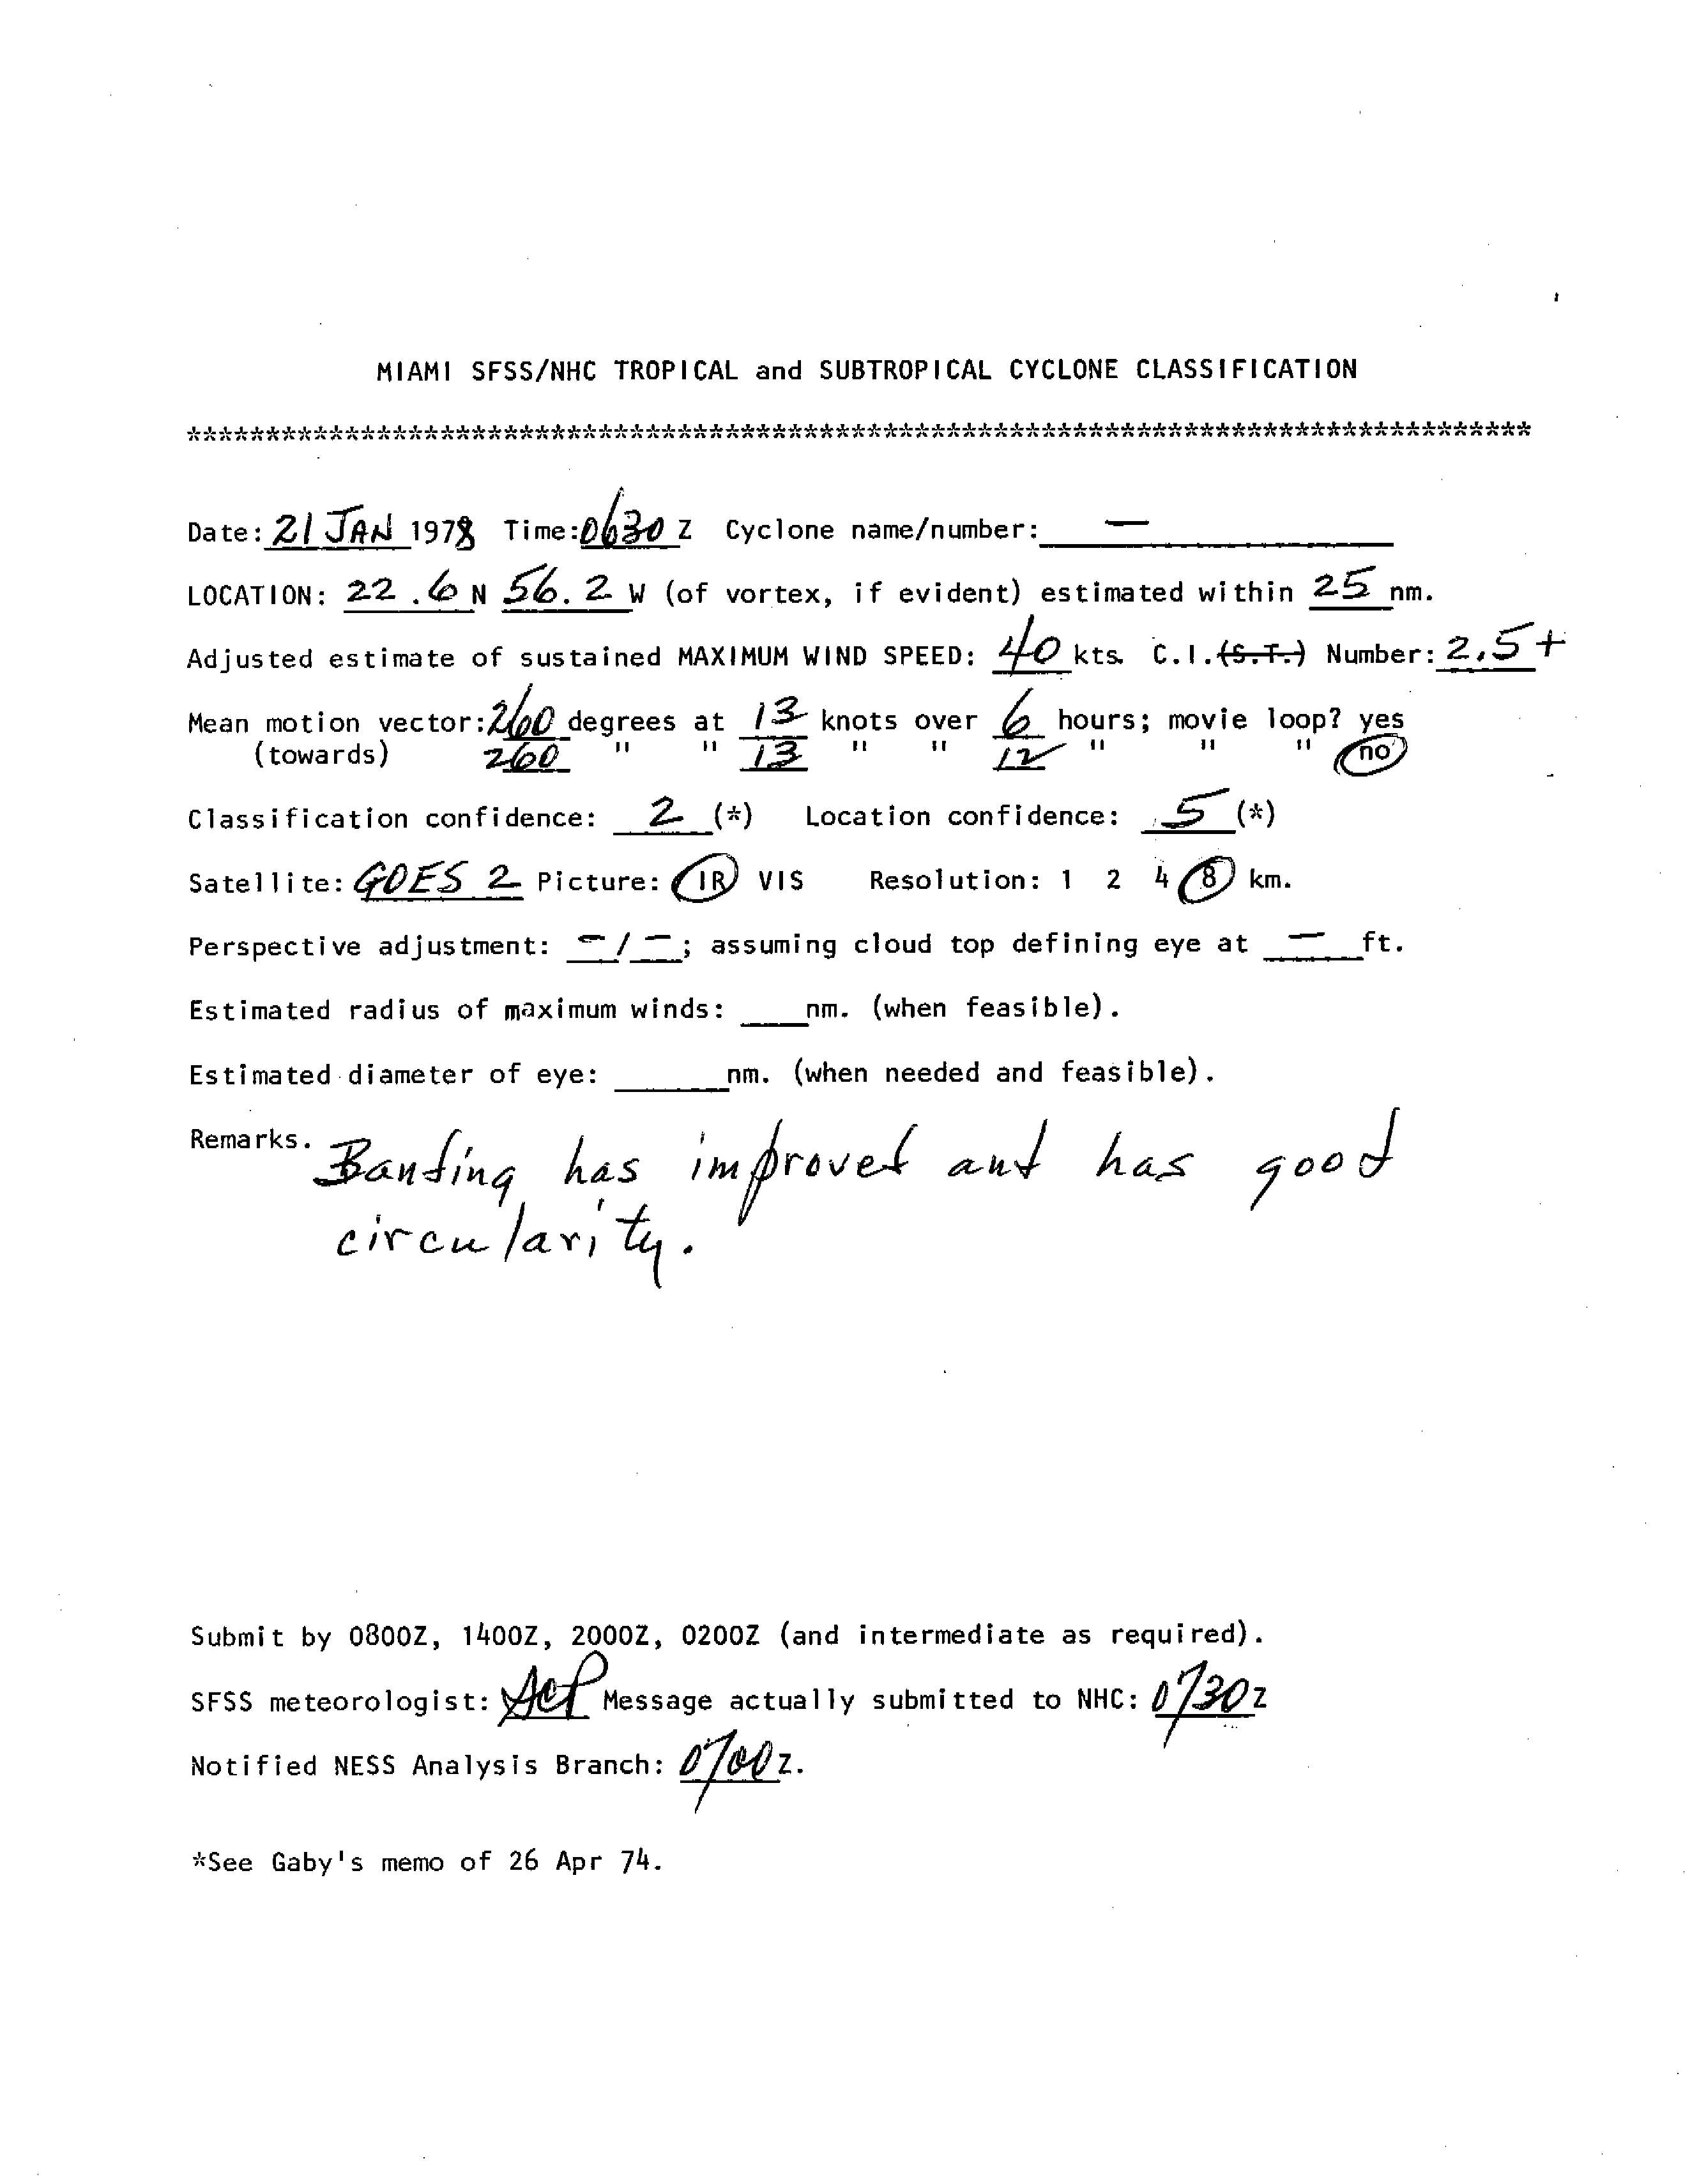
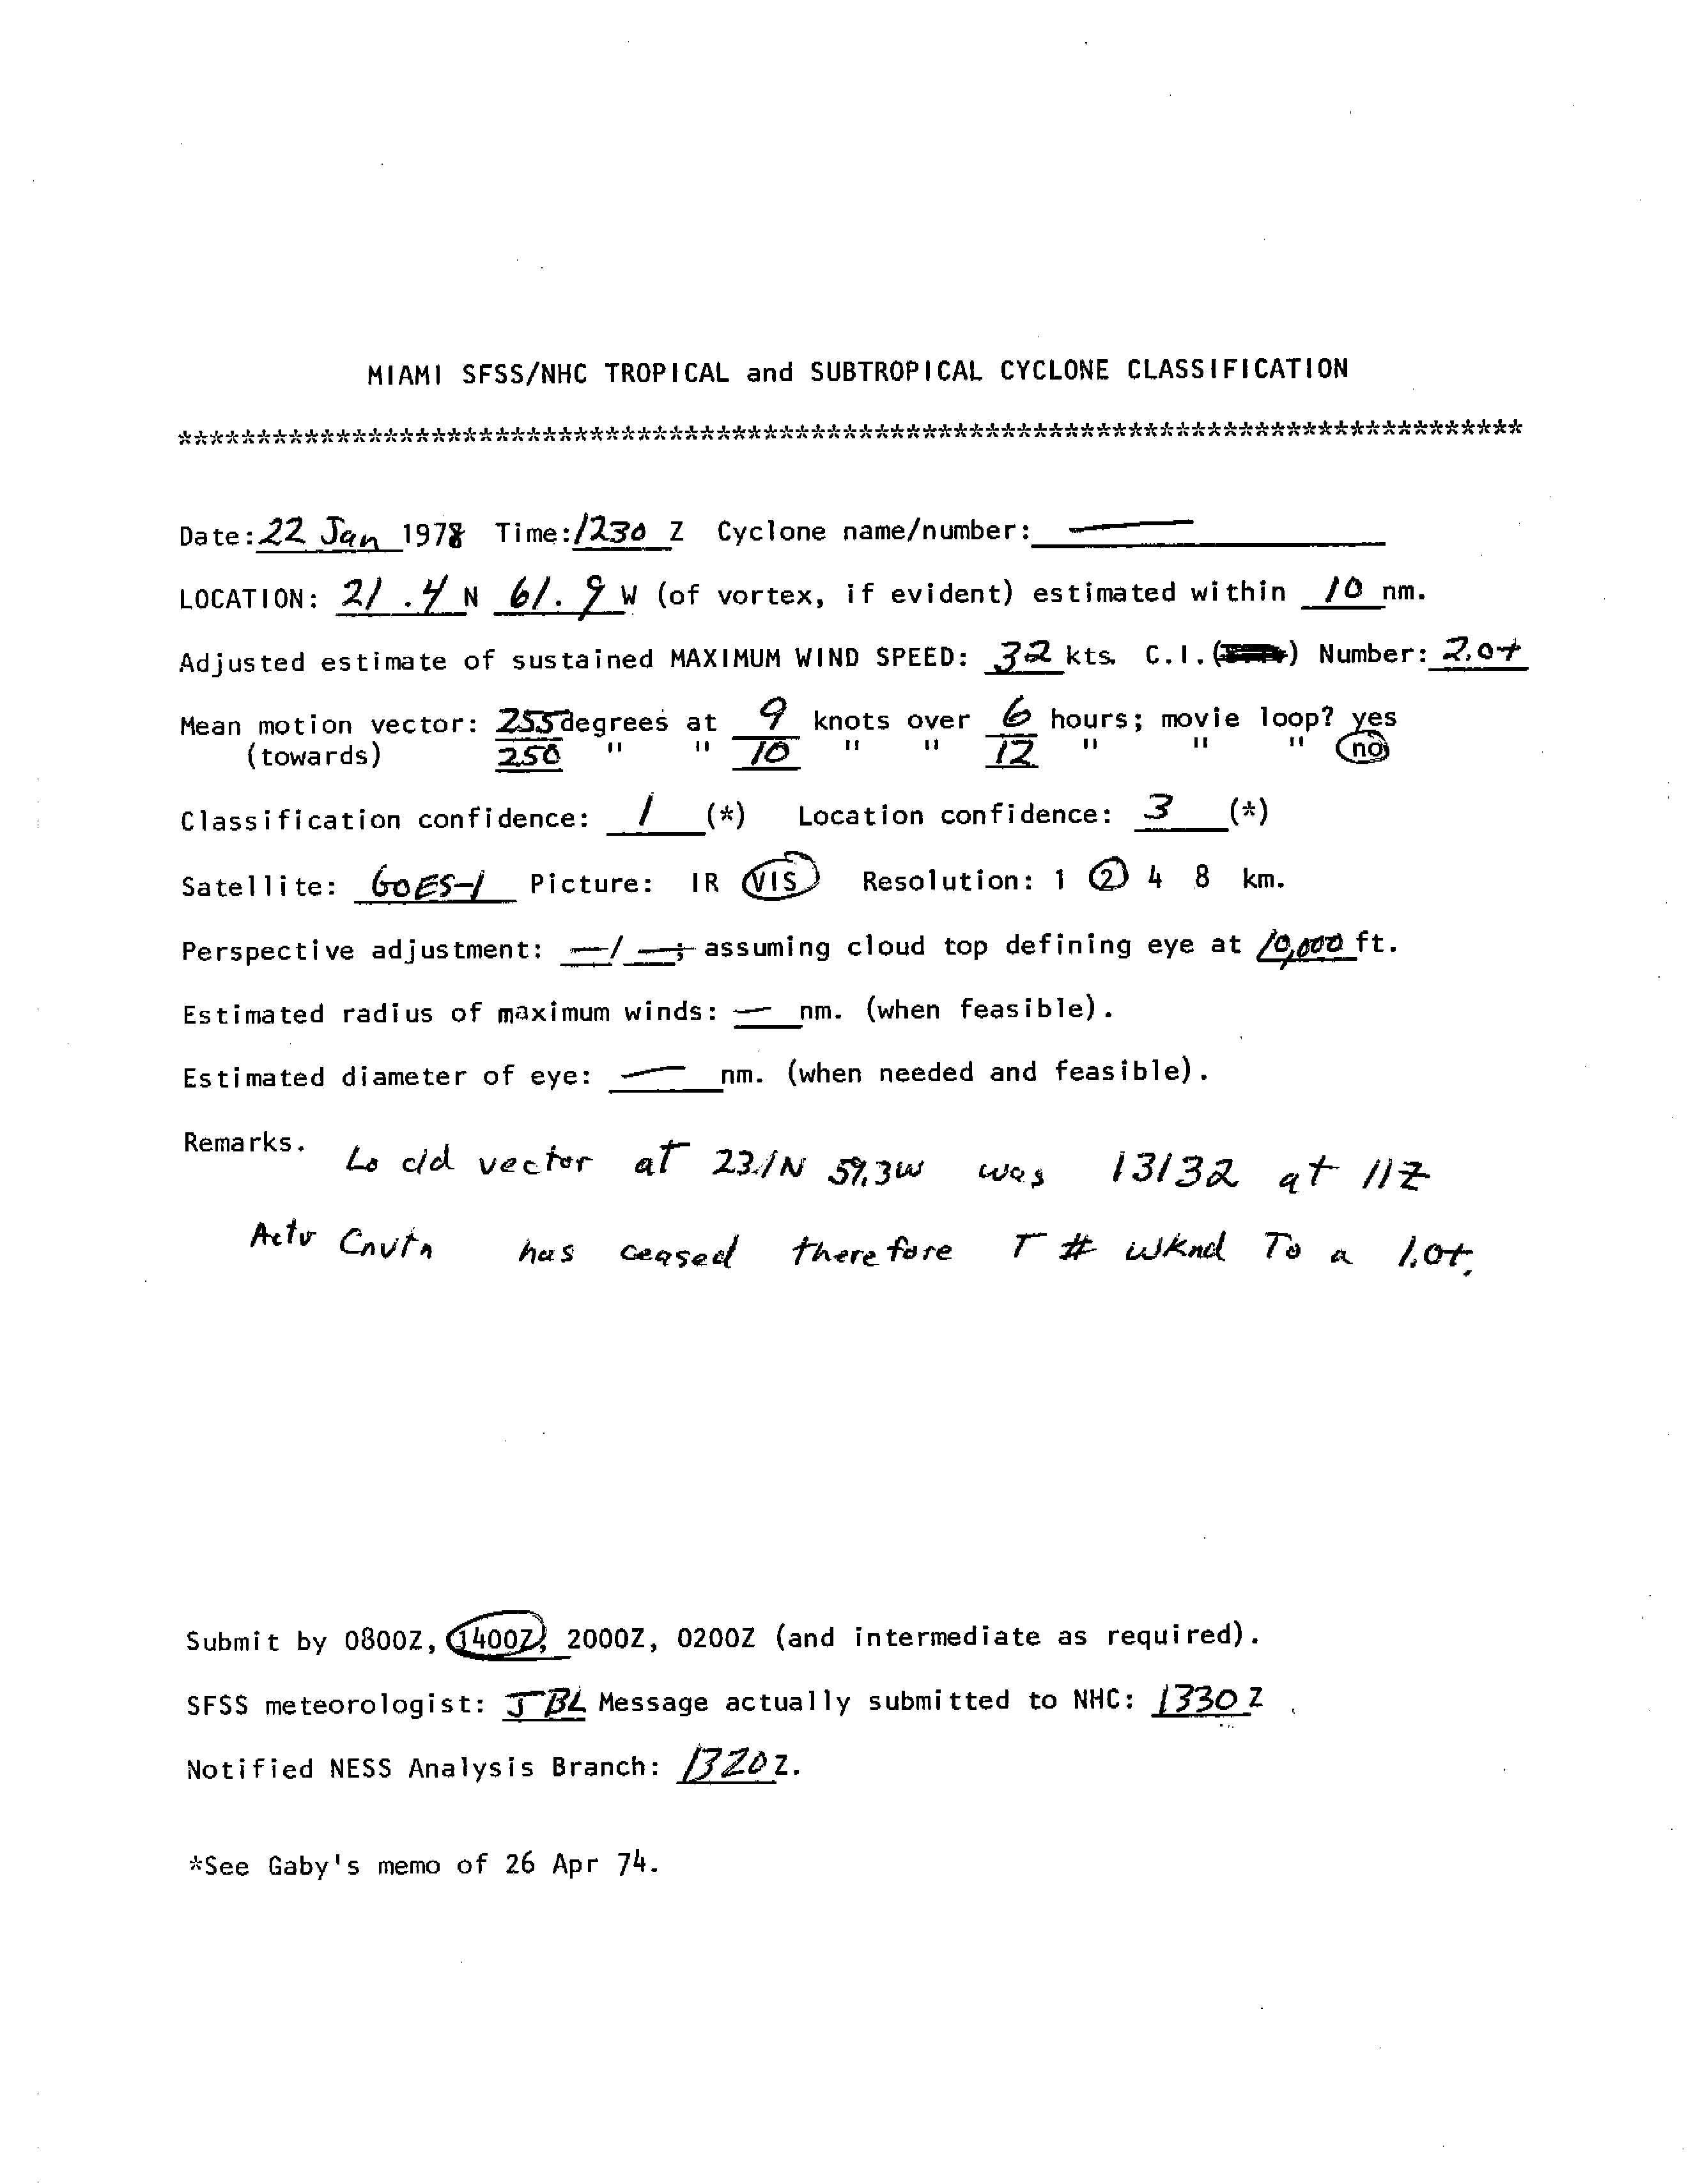
Late on January 21, the outer rainbands to the south and east of the center began diminishing, which began a weakening trend after the storm maintained peak winds for about 36 hours.[12] At around that time, the cyclone was moving west-southwestward, and within 72 hours was forecast by one hurricane forecast model to be located over Hispaniola.[13] By midday on January 22, the winds decreased to below gale force after the convection dissipated near the center.[14] Subsequently, it turned more to the west away from land, and by January 23 the circulation degenerated into a remnant trough about 185 mi (298 km) north of the Lesser Antilles.[2] The storm was one of six tropical or subtropical cyclones on record in the month of January, and one of four to have formed in the month.[15]
Tropical Storm Amelia
| Tropical storm (SSHWS) | |||
|---|---|---|---|
| |||
| Duration | July 30 – August 1 | ||
| Peak intensity | 50 mph (85 km/h) (1-min) 1005 mbar (hPa) | ||
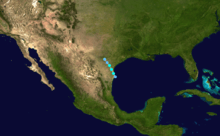
A tropical wave emerged into the Atlantic Ocean from the west coast of Africa on July 19. The wave did not develop significantly while crossing the Atlantic Ocean and Caribbean Sea. The disturbance then entered an area of the Gulf of Mexico that was conducive to tropical cyclogenesis and became a tropical depression while located about 30 mi (48 km) south of Brownsville, Texas on July 30. Despite its proximity to land, the depression strengthened into Tropical Storm Amelia on July 31 and peaked with winds of 50 mph (80 km/h). Around that time, Amelia made landfall near Port Isabel, Texas.[16] Later on July 31, the storm weakened to a tropical depression and dissipated early the following day.[2]
Amelia affected the Texas coast for two days, causing several shipping incidents and minor damage in Corpus Christi and South Padre Island.[17] While active, there were no deaths linked to the storm.[18] However, the biggest impact from the storm followed its dissipation, when its remnants contributed to record rainfall totals over the state.[19] The state, already suffering from a previous drought, believed that the rain would help alleviate the conditions.[20] However, the dry ground aided the flooding from the storm.[21][22] The rainfall caused several rivers and creeks to flood, especially around the Texas Hill Country and northern Texas, leading to severe damage.[17] Overall, Amelia caused 33 fatalities with an estimated $110 million in damages.[23][24]
Tropical Storm Bess
| Tropical storm (SSHWS) | |||
|---|---|---|---|
| |||
| Duration | August 6 – August 8 | ||
| Peak intensity | 50 mph (85 km/h) (1-min) 1005 mbar (hPa) | ||
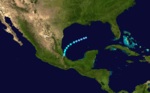
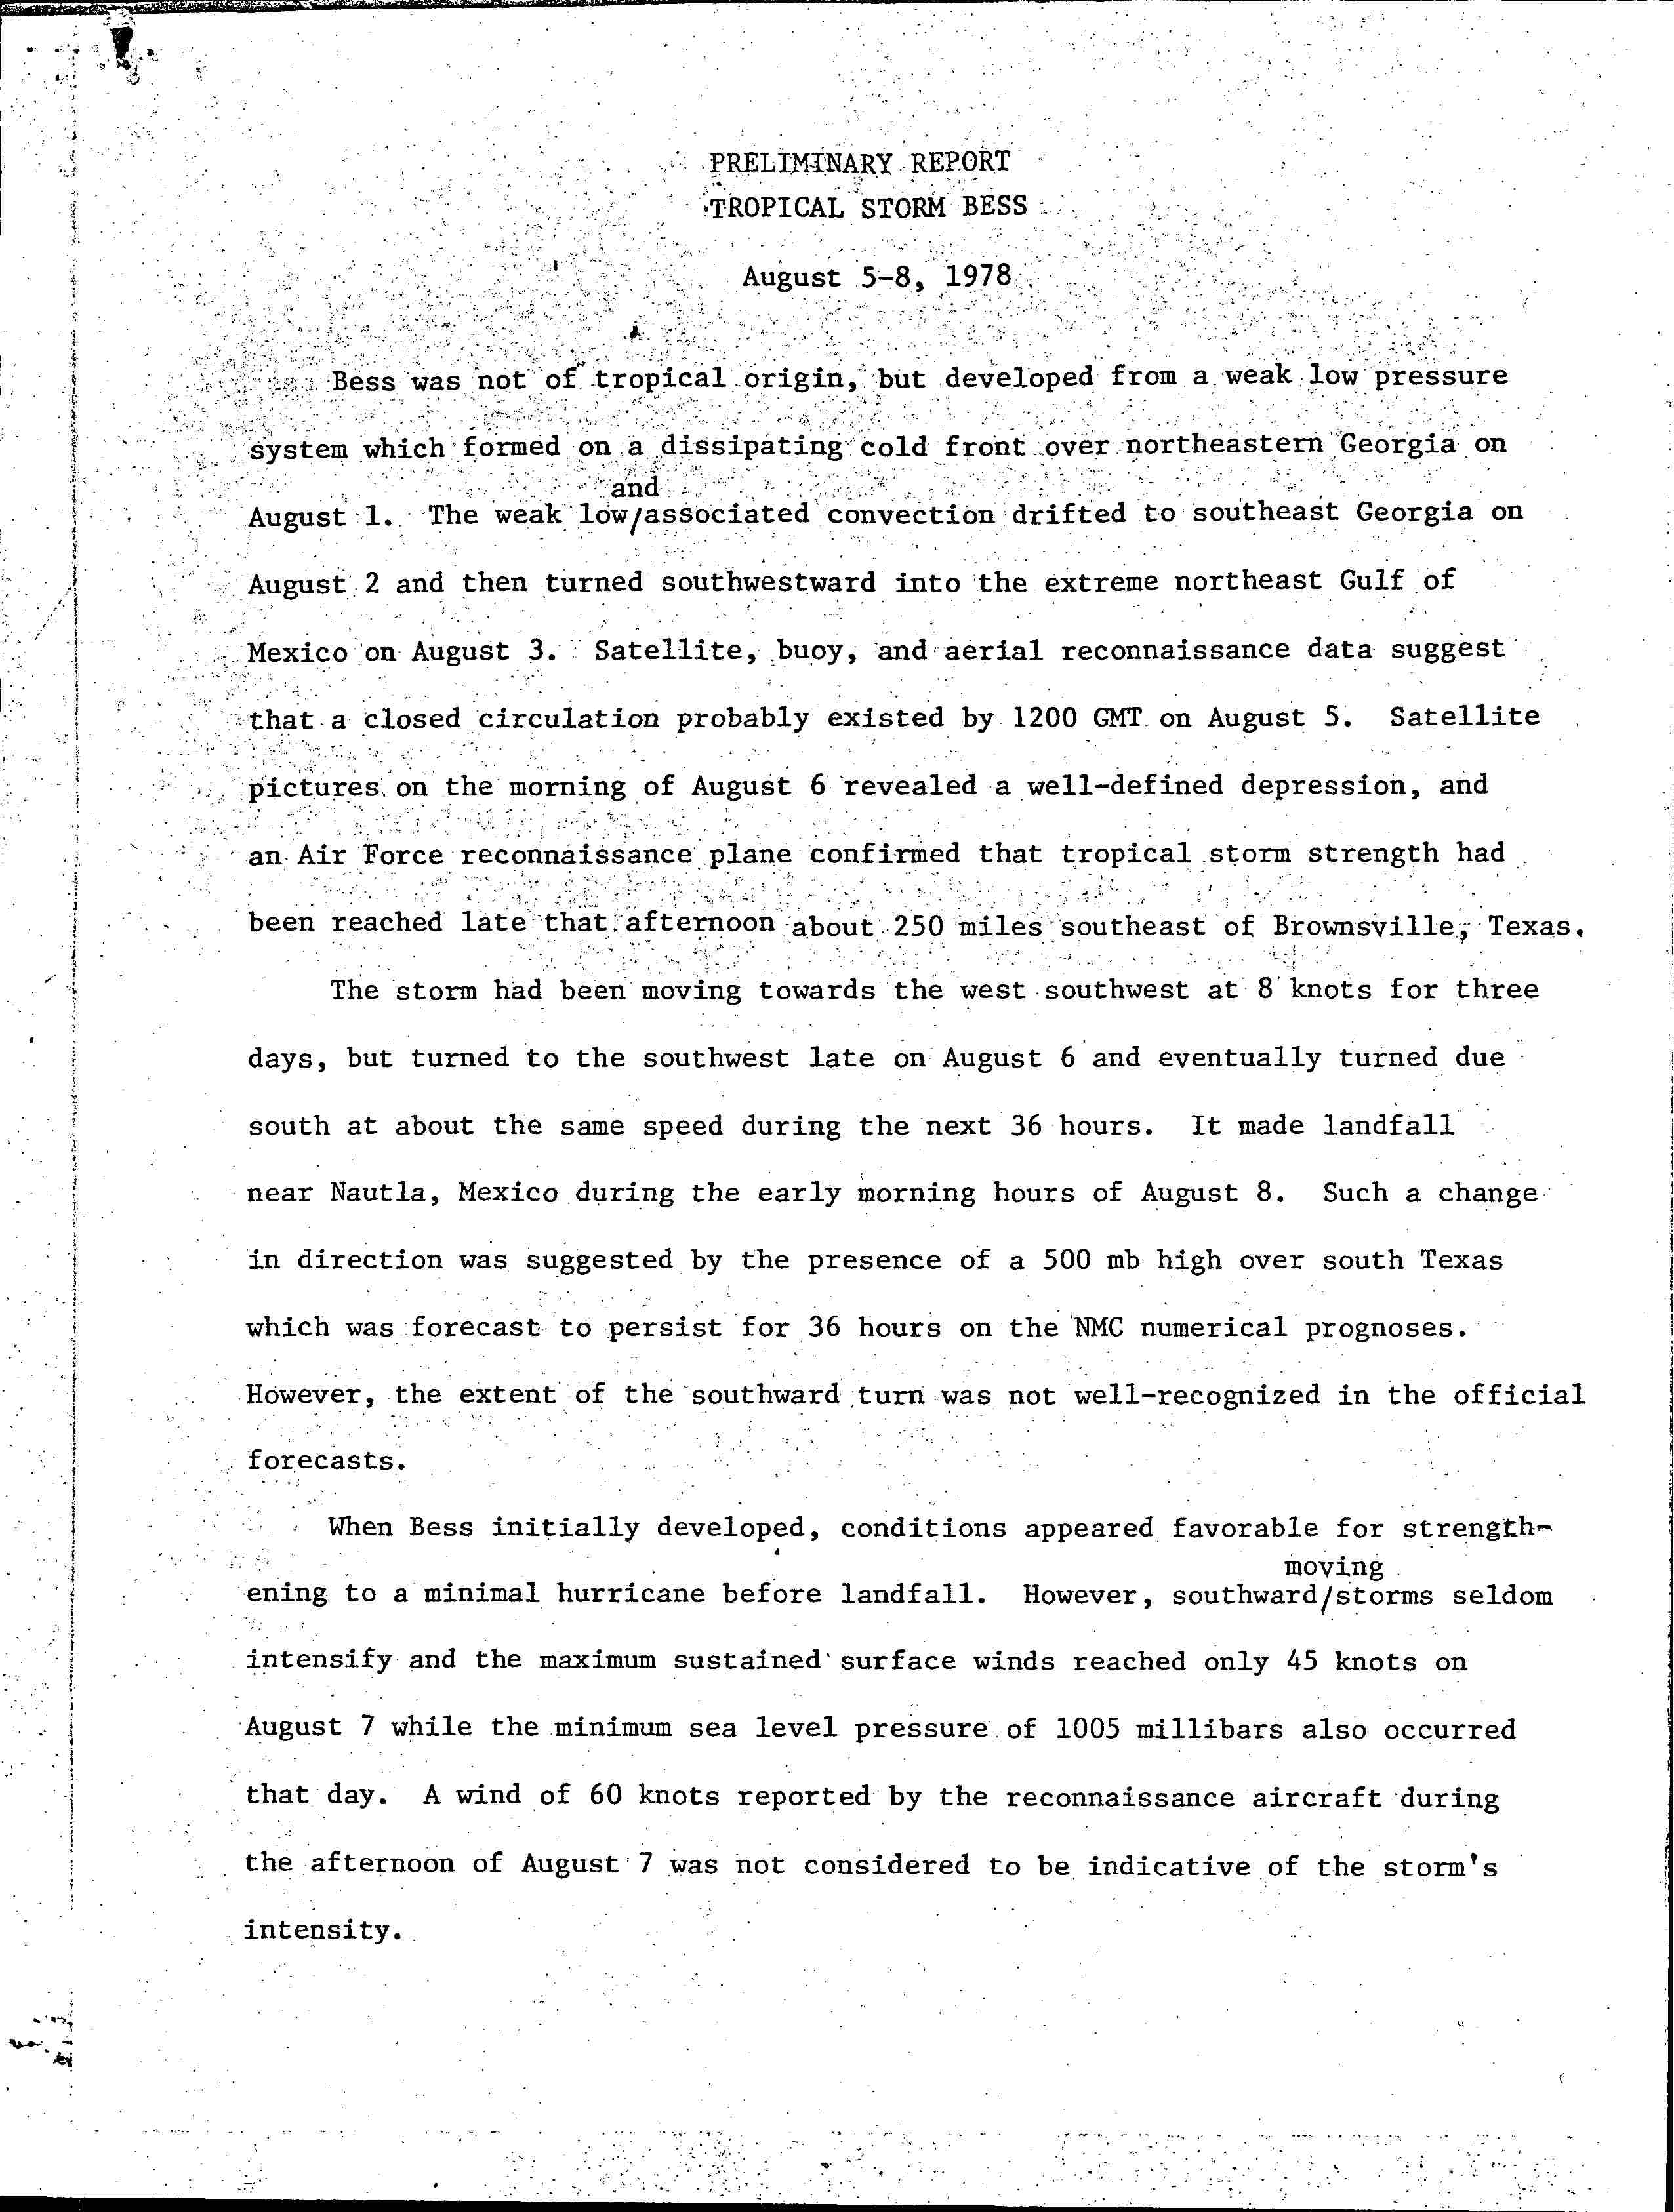
A low-pressure area developed in Georgia along a dissipating cold front on August 1. The system detached from the cold front and drifted southwestward, reaching northeastern Gulf of Mexico on August 3. Satellite imagery, buoys, and reconnaissance aircraft flights indicated that by August 5, the system likely acquired a closed circulation. Thus, the National Hurricane Center estimated that a tropical depression developed in the central Gulf of Mexico at 1200 UTC that day. On August 6, a reconnaissance flight into the depression resulted in an upgrade to Tropical Storm Bess, while located about 250 mi (400 km) southeast of Brownsville, Texas. The storm had initially headed west-southwestward at 8 mph (13 km/h), before moving southwestward at nearly the same speed.[25]
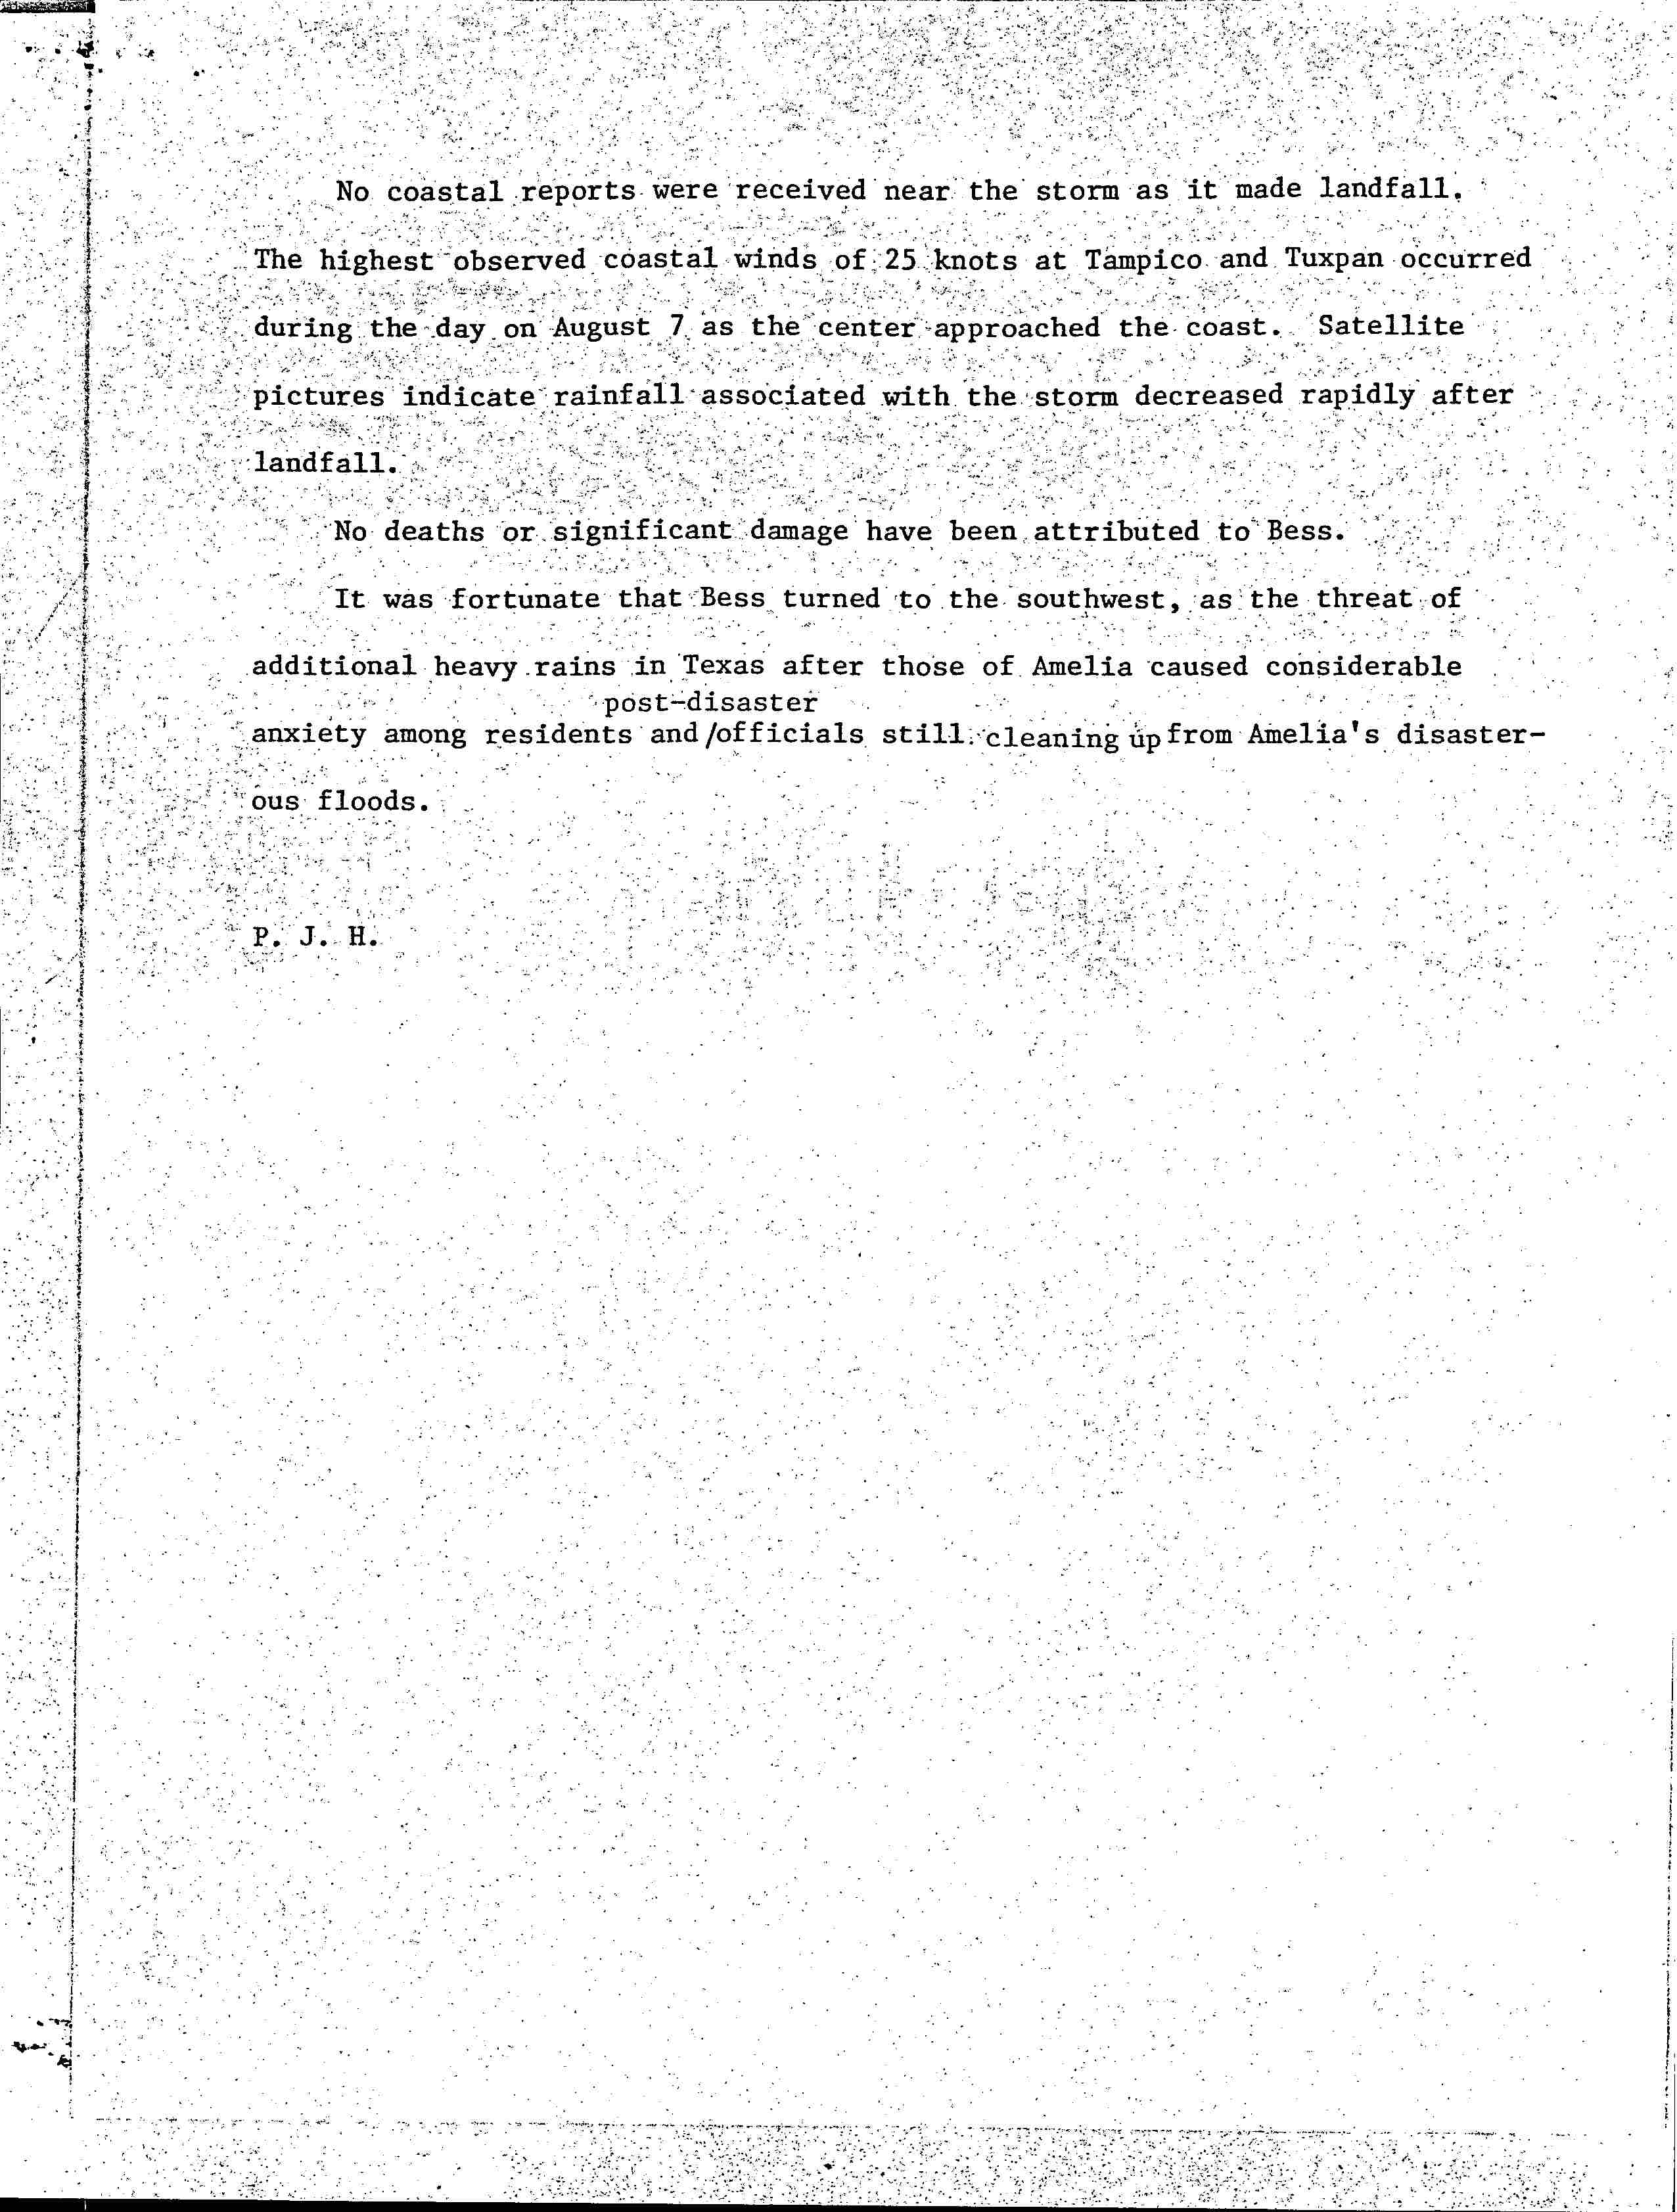
At 1200 UTC on August 7, Bess attained its minimum barometric pressure of 1,005 mbar (29.7 inHg). Thereafter, Bess began to turn nearly due southward under the influence of a high-pressure area over southern Texas. Later on August 7, the storm reached its maximum sustained winds of 50 mph (80 km/h). Early on August 8, Bess made landfall near Nautla, Veracruz, at the same intensity and then rapidly dissipated inland.[25] In Tuxpan, Veracruz and Tampico, Tamaulipas, sustained winds reached only 29 mph (47 km/h).[26] The storm also produced heavy rainfall, peaking at 12.04 in (306 mm) in La Estrella.[27] However, no flooding occurred and no damage or fatalities were reported.[26]
Hurricane Cora
| Category 1 hurricane (SSHWS) | |||
|---|---|---|---|
| |||
| Duration | August 7 – August 12 | ||
| Peak intensity | 90 mph (150 km/h) (1-min) 980 mbar (hPa) | ||

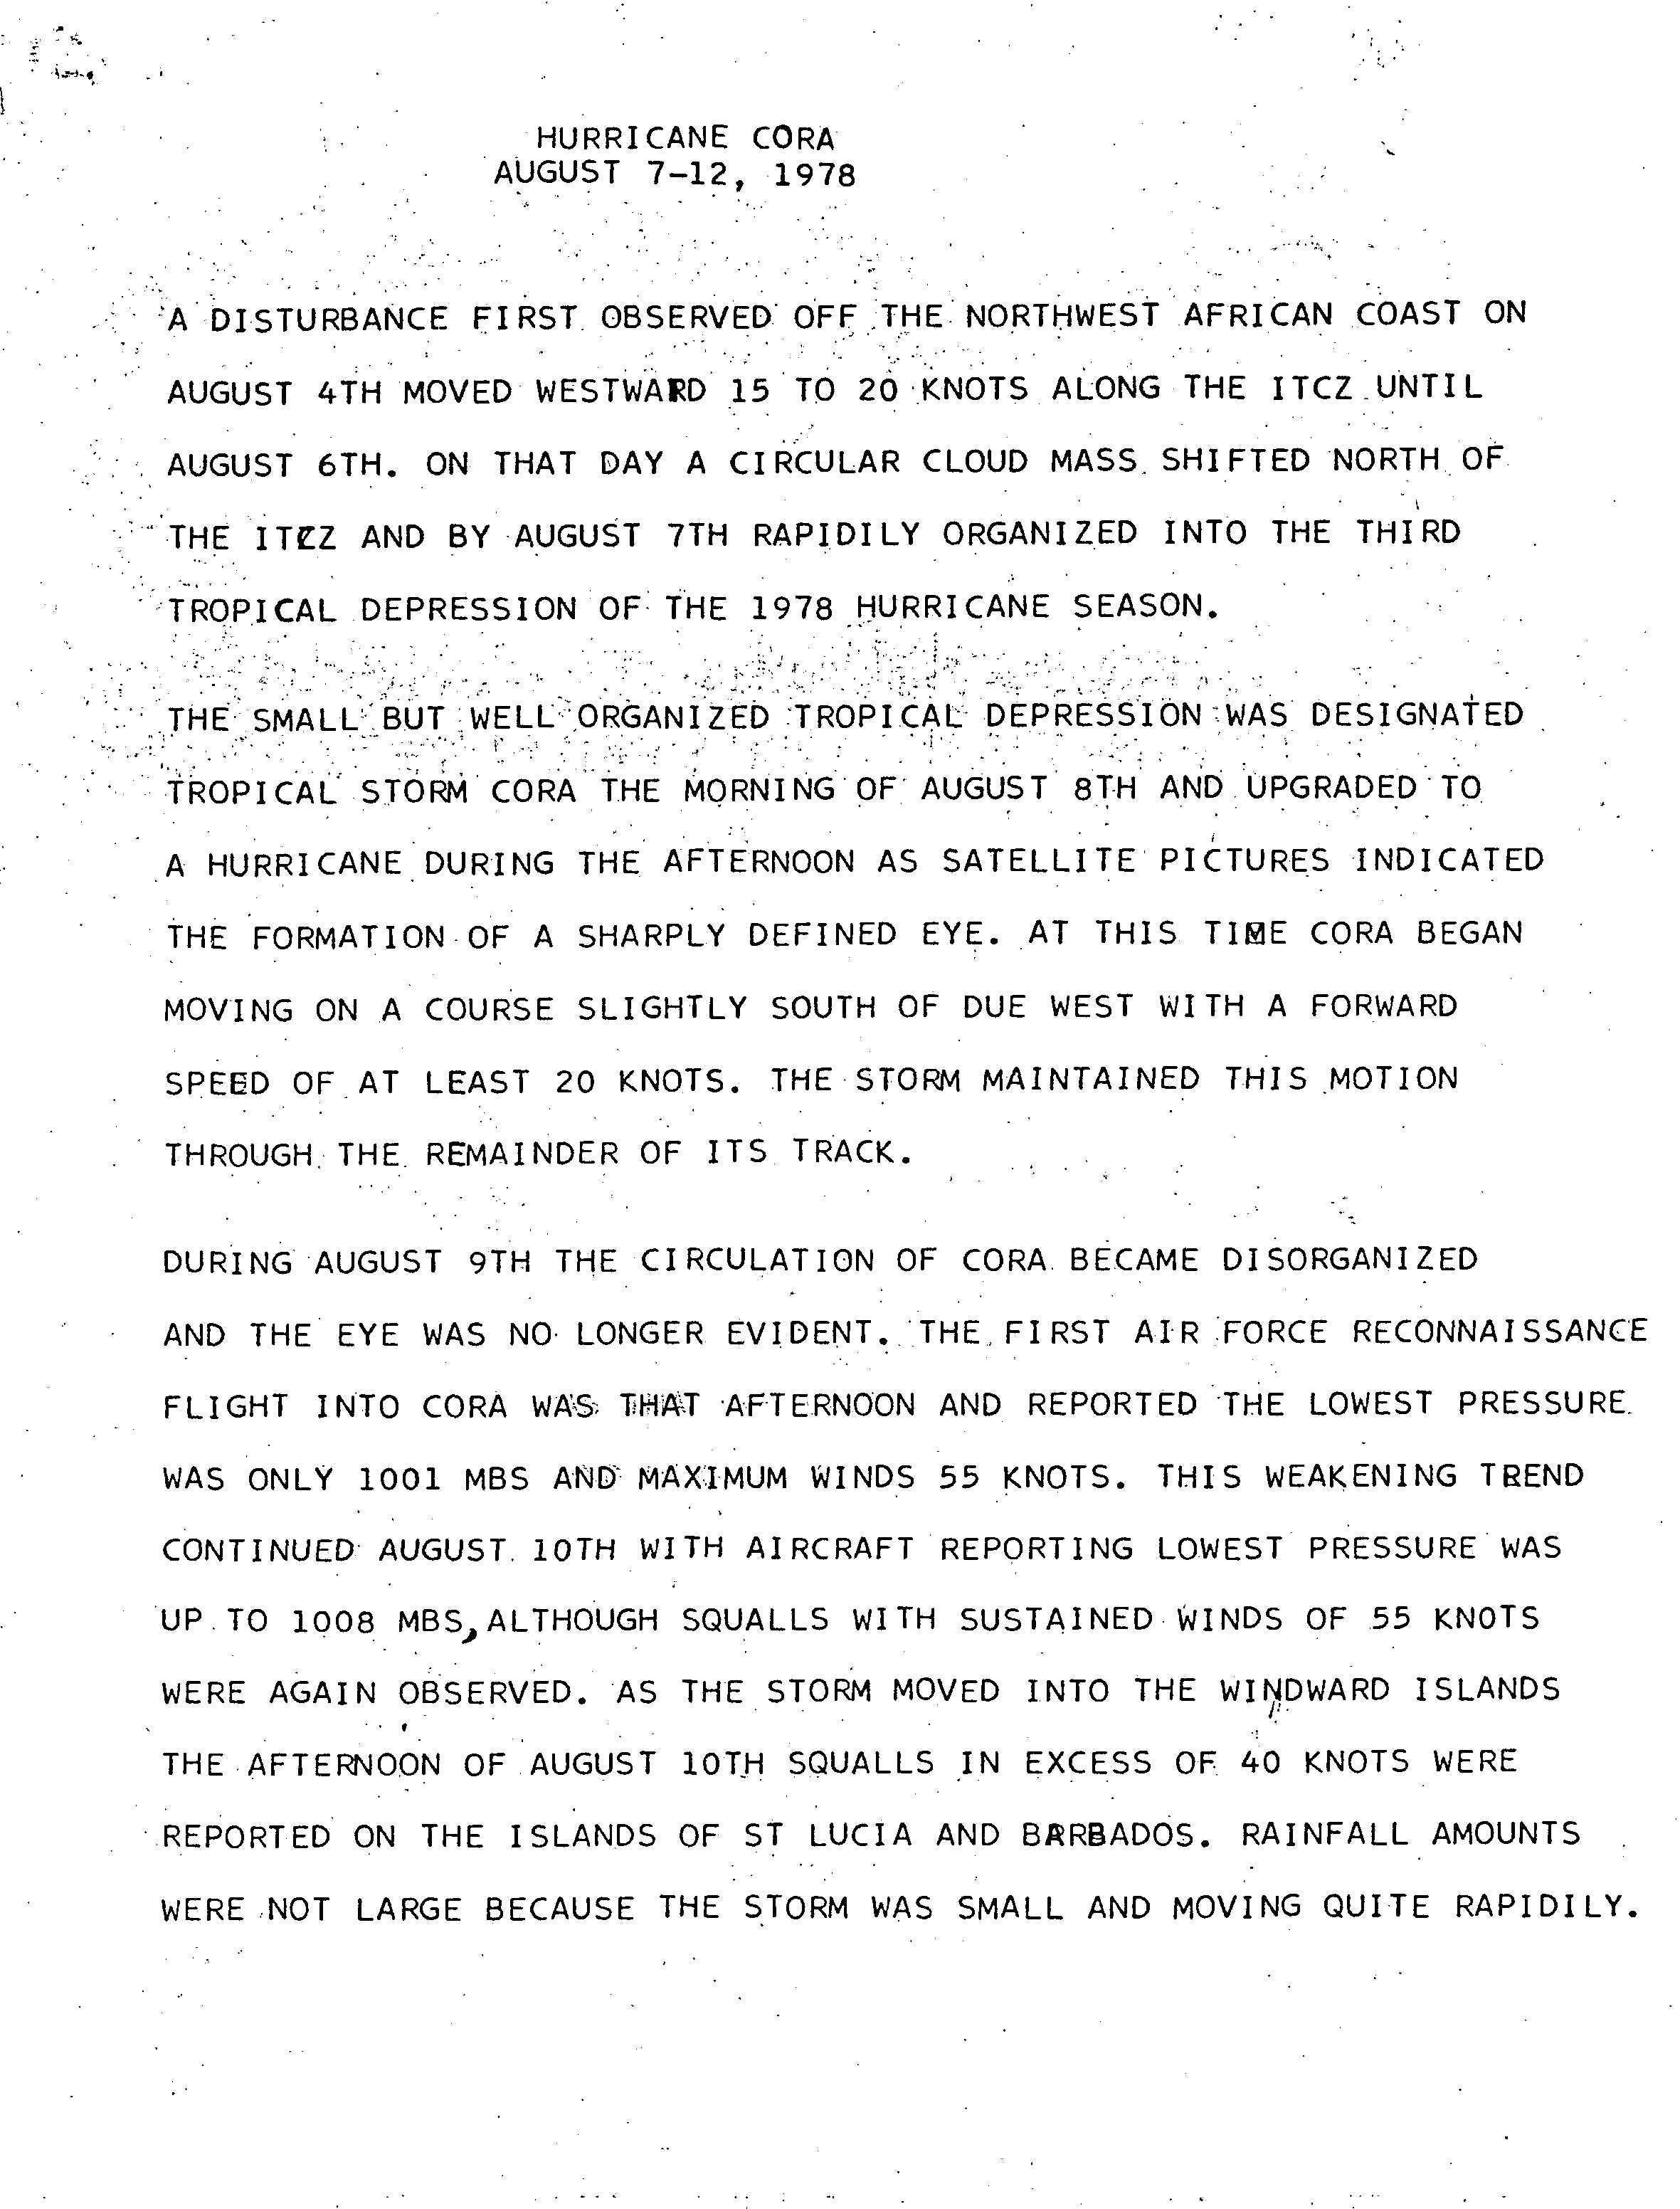
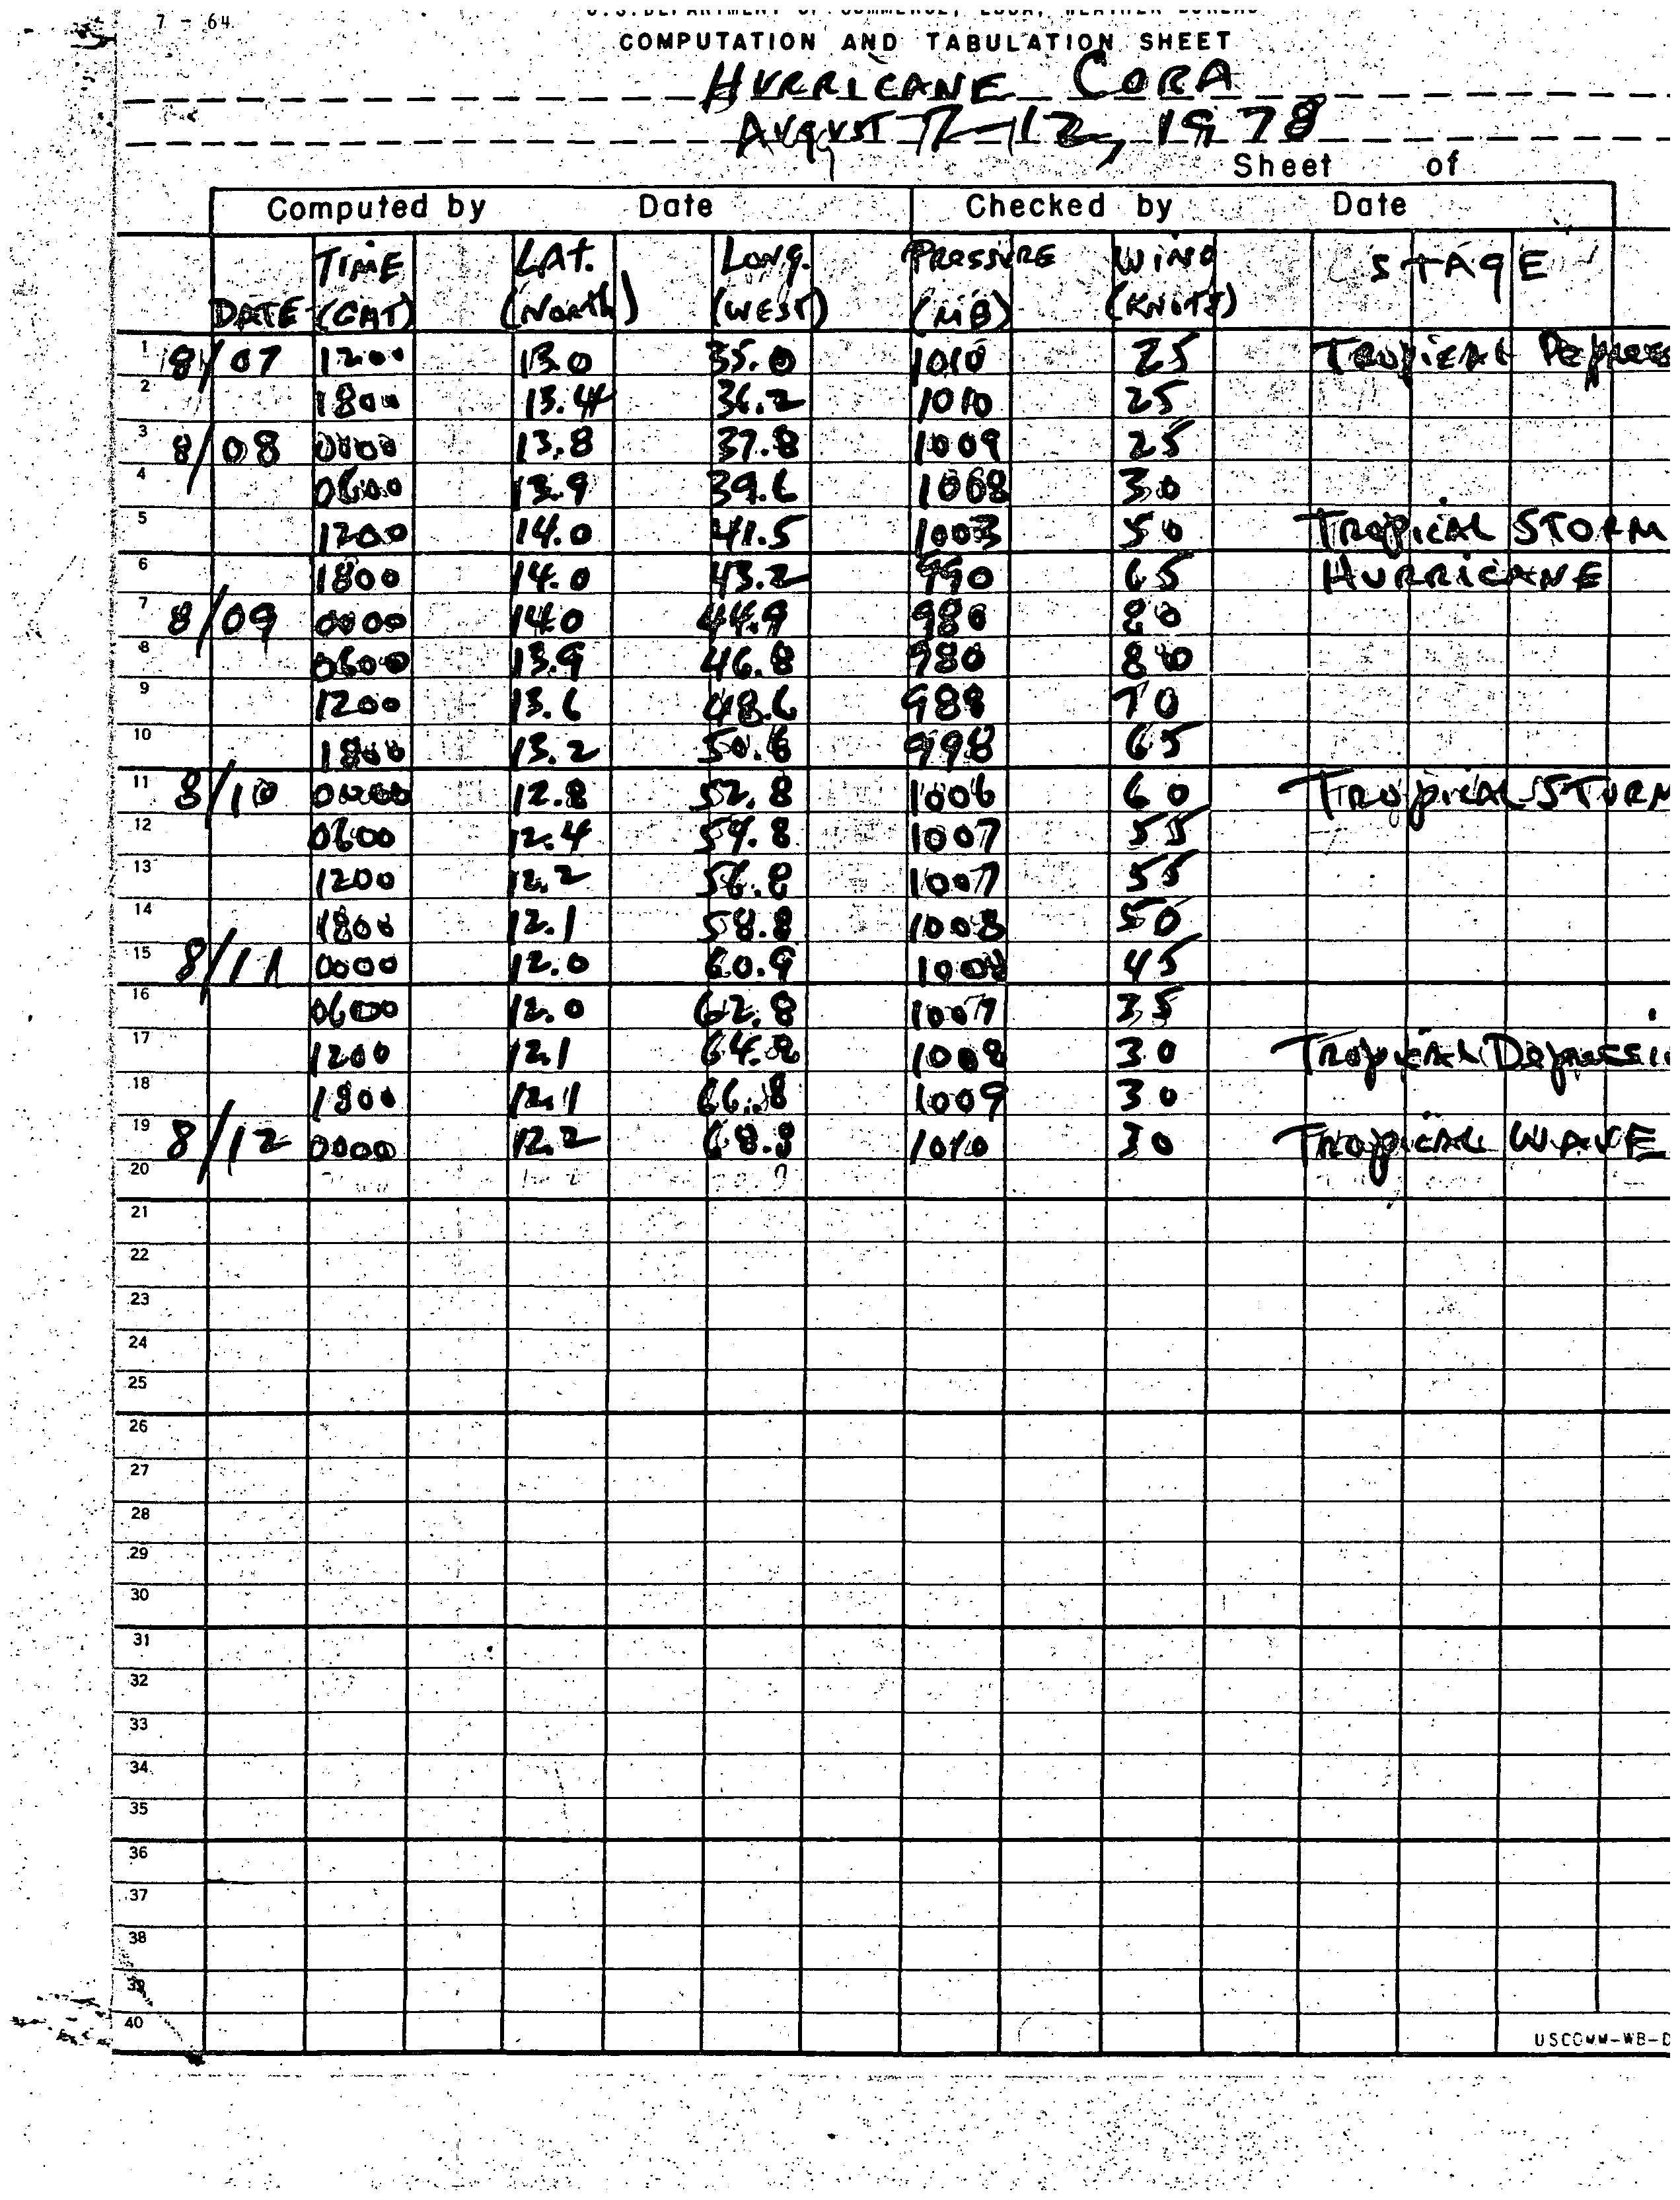
A disturbance exited the west coast of Africa on August 4 and developed into a tropical depression about three days later, while located well east of the Lesser Antilles. On August 8, the depression strengthened into Tropical Storm Cora. The storm moved at an unusually high forward speed for a cyclone in the Atlantic Ocean in August, and intensified into a hurricane later that day. The hurricane was upgraded into a hurricane based solely on satellite photography, the second time this occurred.[28] Early on August 9, it peaked with winds of 90 mph (140 km/h). Around 0000 UTC the next day, Cora weakened to a tropical storm while moving west-southwestward. The storm made landfall on Grenada on August 11, while weakening to a tropical depression. Cora weakened further to a tropical depression, before losing its circulation and degenerating into a tropical wave on August 12.[29] The remnant crossed over Central America into the Pacific Ocean, where it regenerated into Hurricane Kristy.[30]
Cora was an unusual cyclone, maintaining an unusually low latitude in the Atlantic in August at high speeds. While passing through the Lesser Antilles, gusty winds and light rainfall in Barbados and Saint Lucia.[28] In the latter, a person died after stepping on a high tension power line that was downed in Castries. Approximately two to four percent of trees on the island were toppled.[31] Cora was also responsible for altering weather conditions in Presque Isle, Maine, allowing for a takeoff of the historical flight of the Double Eagle II hot air balloon.[32]
Tropical Storm Debra
| Tropical storm (SSHWS) | |||
|---|---|---|---|
| |||
| Duration | August 26 – August 29 | ||
| Peak intensity | 60 mph (95 km/h) (1-min) 1000 mbar (hPa) | ||

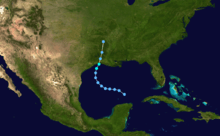
A low-pressure area that developed over southeast Florida and an area of convection near the Yucatán Peninsula merged and resulted in the formation of a tropical depression over the southern Gulf of Mexico on August 26. Tacking west-northwestward around a high-pressure ridge, the depression gradually intensified began and was upgraded to Tropical Storm Debra on August 28. Debra turned to the north and reached its peak intensity of 60 mph (97 km/h) on August 29, shortly before making landfall in southwestern Louisiana. It was a disorganized storm, with most of the convection located to the east of the center.[33] The system weakened rapidly and dissipated over Arkansas on August 29, though its remnants continued into the Ohio Valley.[33][34]
One person died while attempting to evacuate an oil rig to the south of Cameron, Louisiana. Damage caused by Debra was considered minimal.[33] In Louisiana, rainfall peaked at 10.81 in (275 mm) in Freshwater Bayou.[19] However, no flooding was reported.[33] Wind impacts were light and mainly limited to down trees and damage to roofs in Lake Charles and New Orleans.[35] The storm spawned several tornadoes in Arkansas,[36] Mississippi, Louisiana,[34] Tennessee,[37] and Texas.[34] In Mississippi, a tornado in Crystal Springs destroyed three mobile homes and a house, killing one person and seriously injuring another.[38]
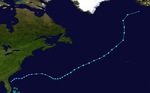
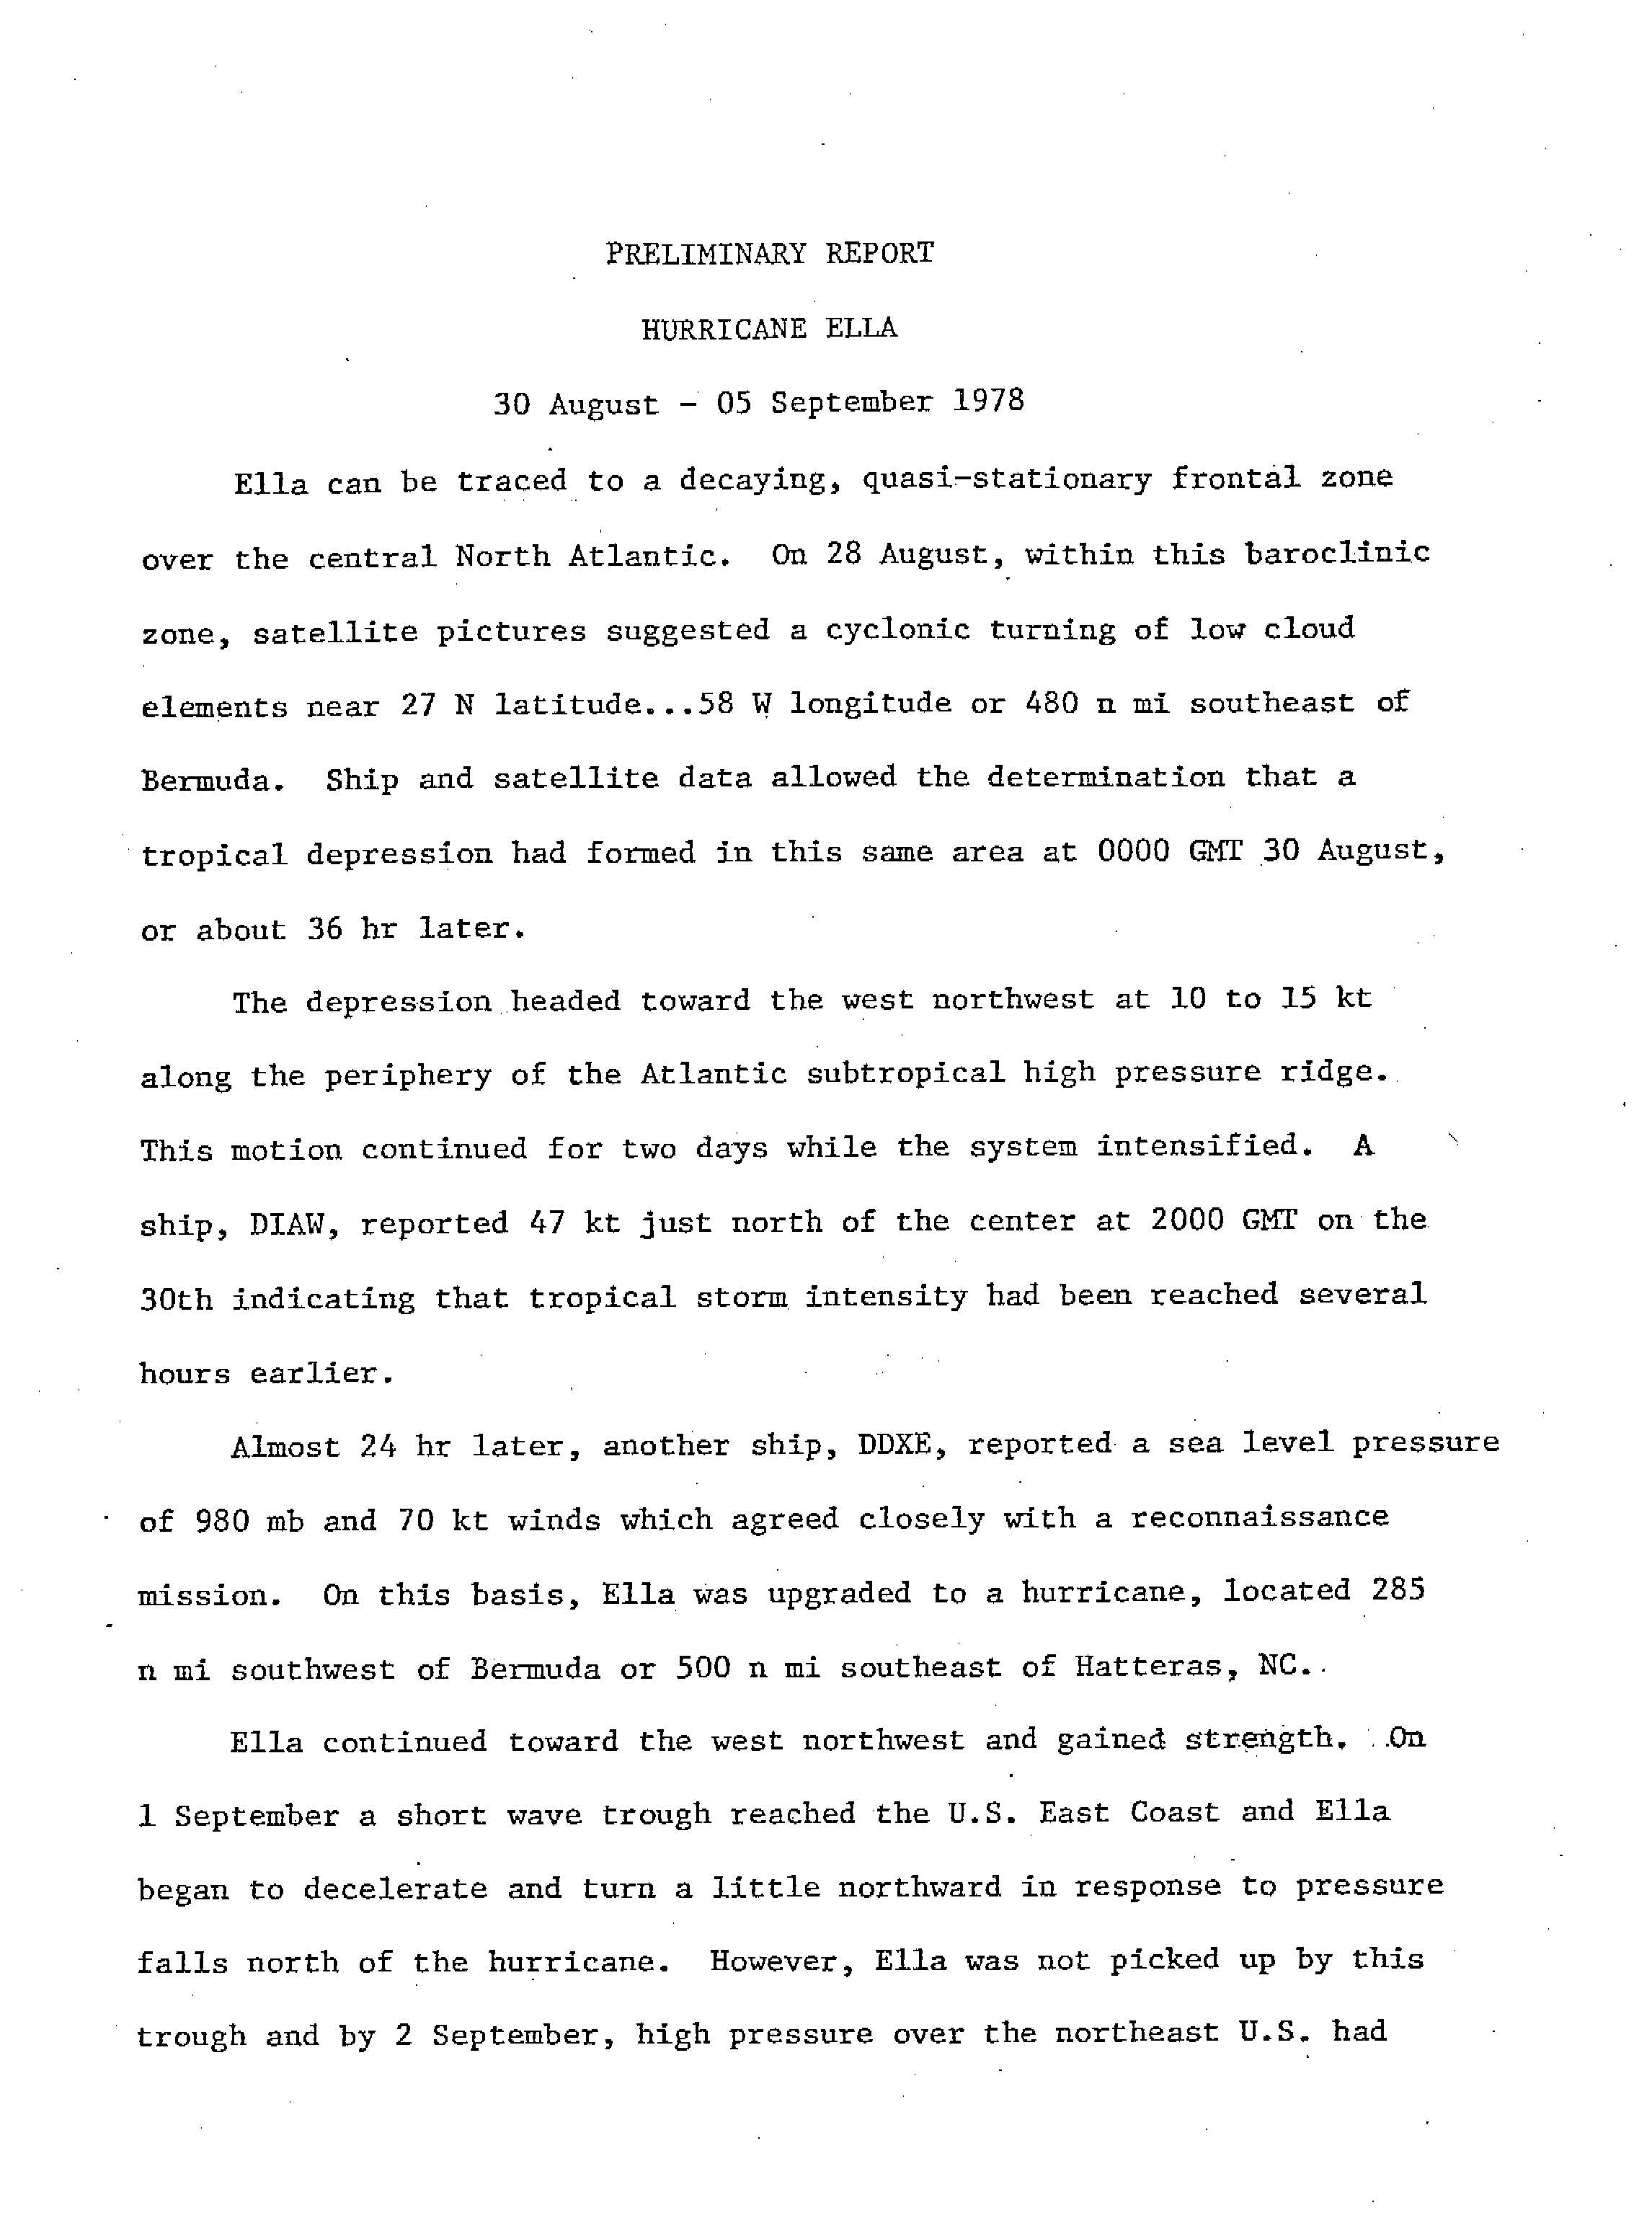
Hurricane Ella
| Category 4 hurricane (SSHWS) | |||
|---|---|---|---|
| |||
| Duration | August 30 – September 5 | ||
| Peak intensity | 140 mph (220 km/h) (1-min) 956 mbar (hPa) | ||
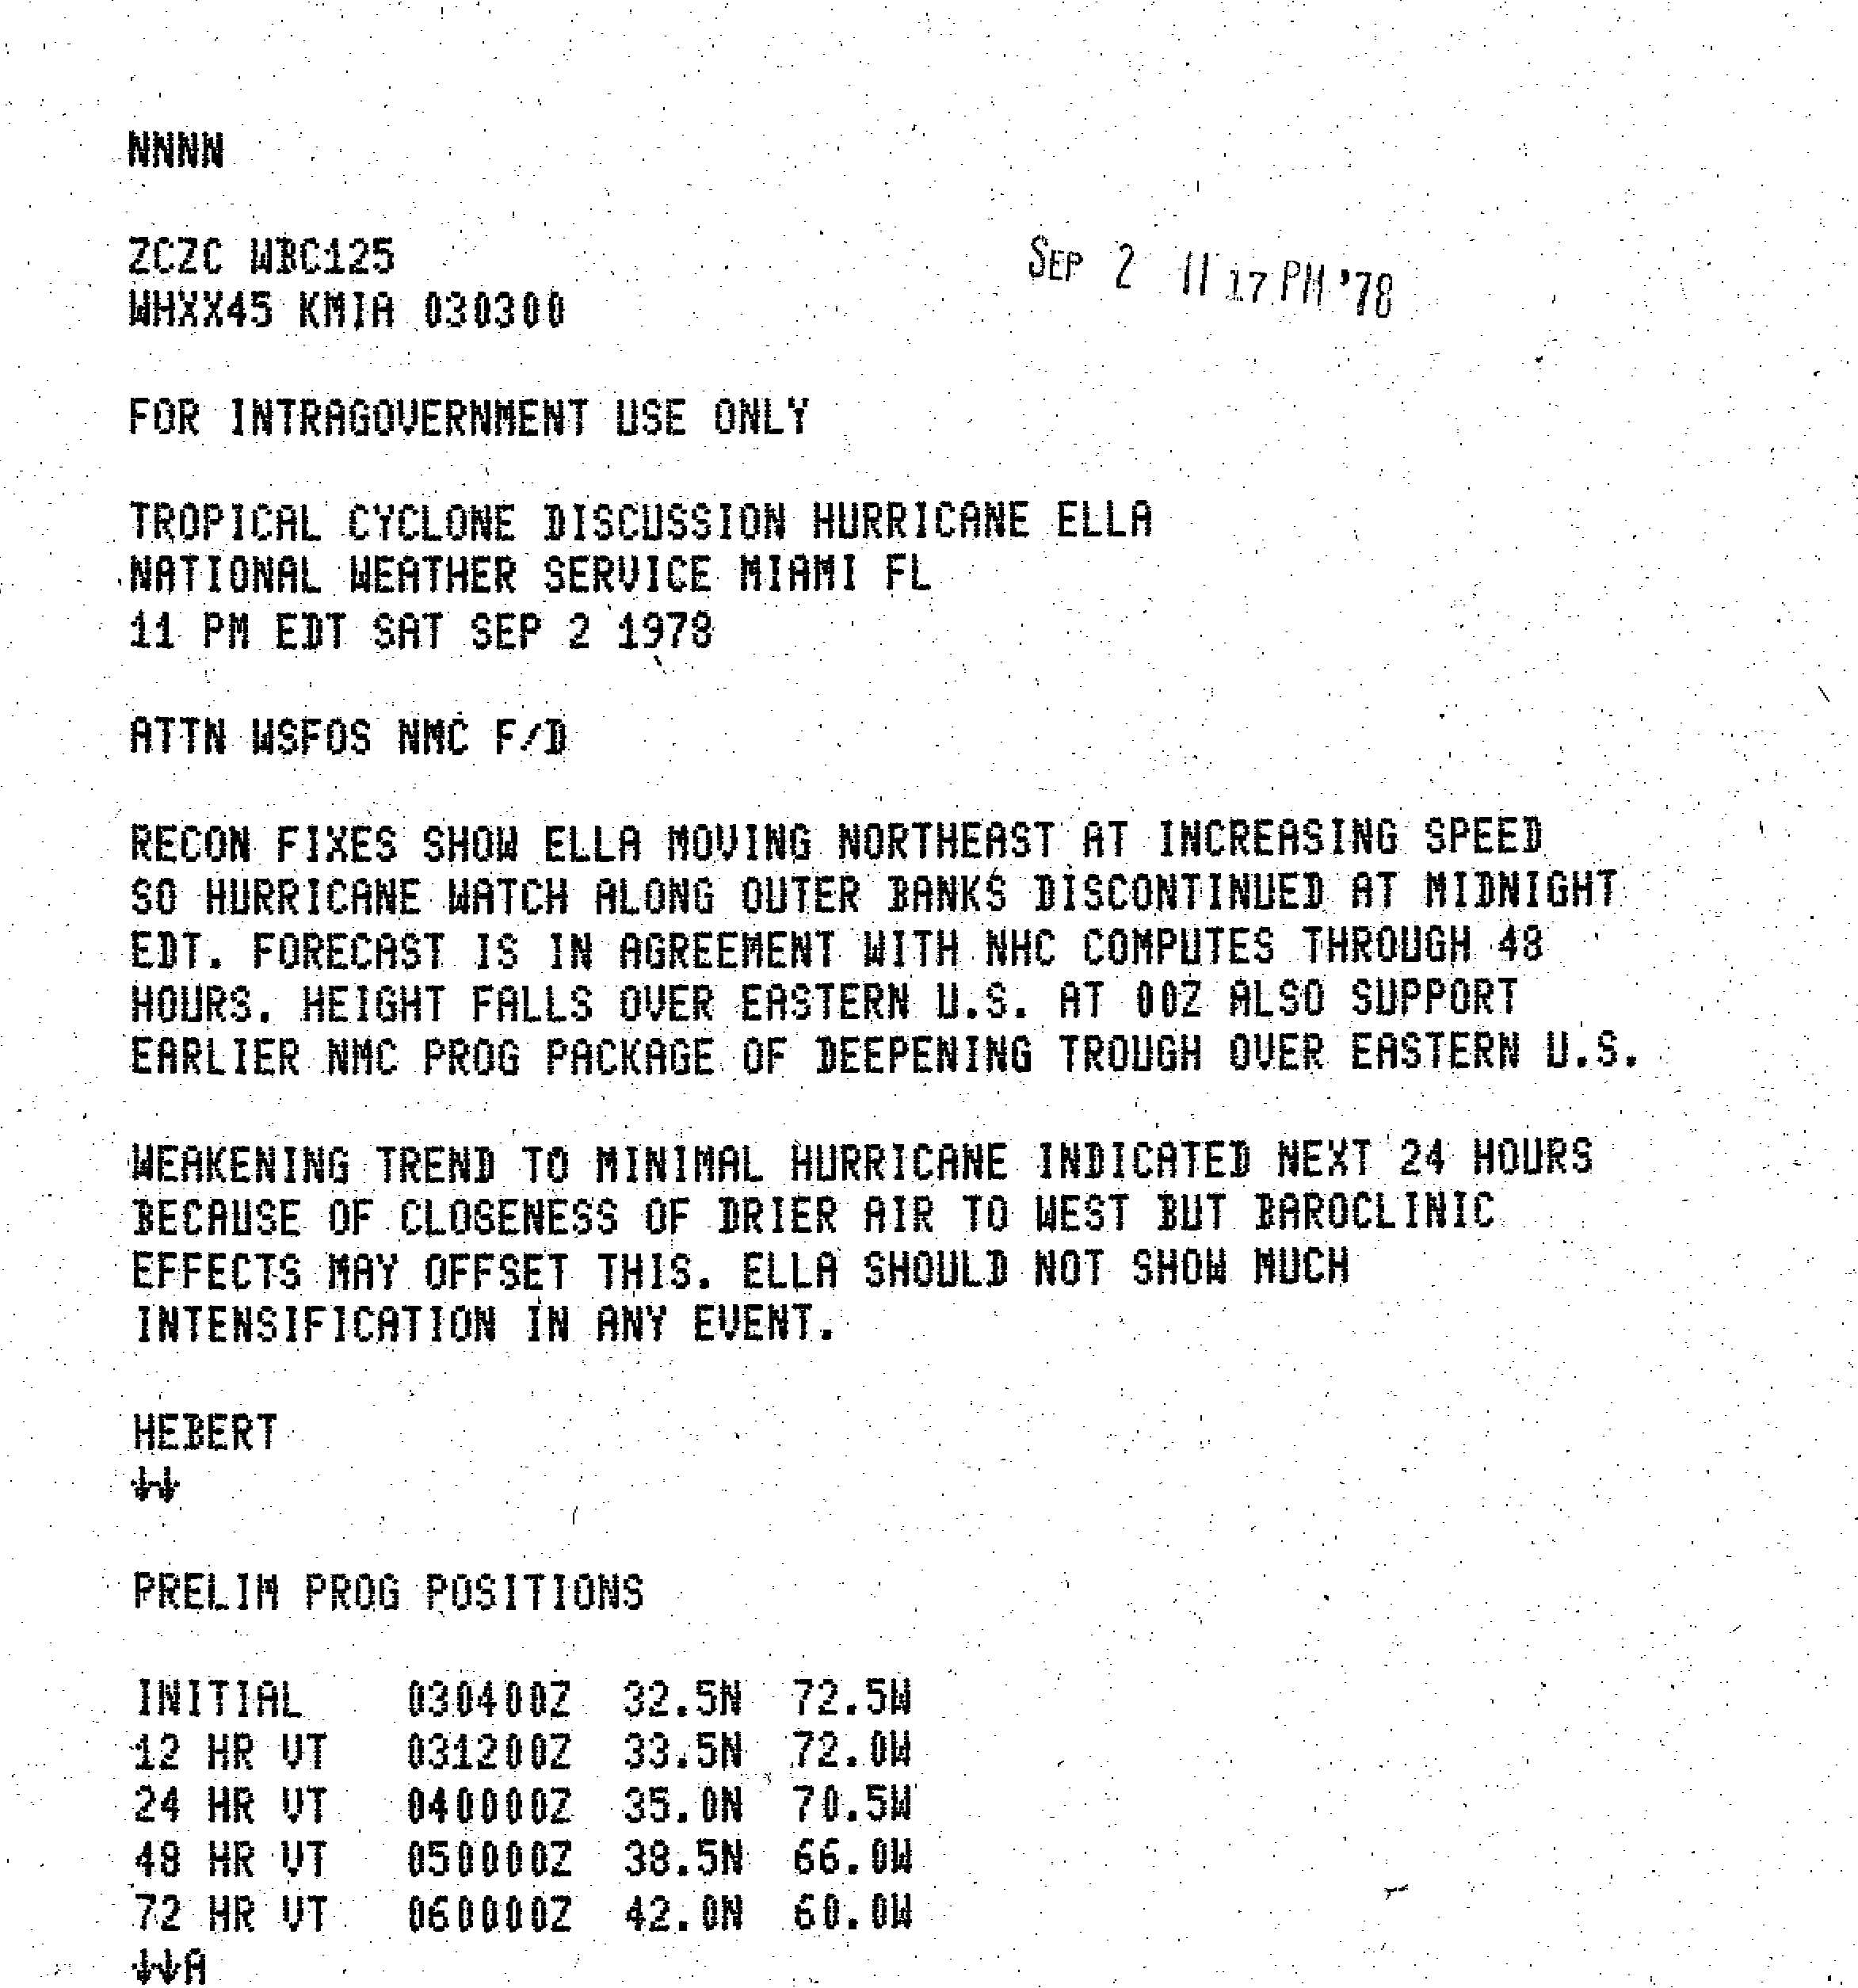
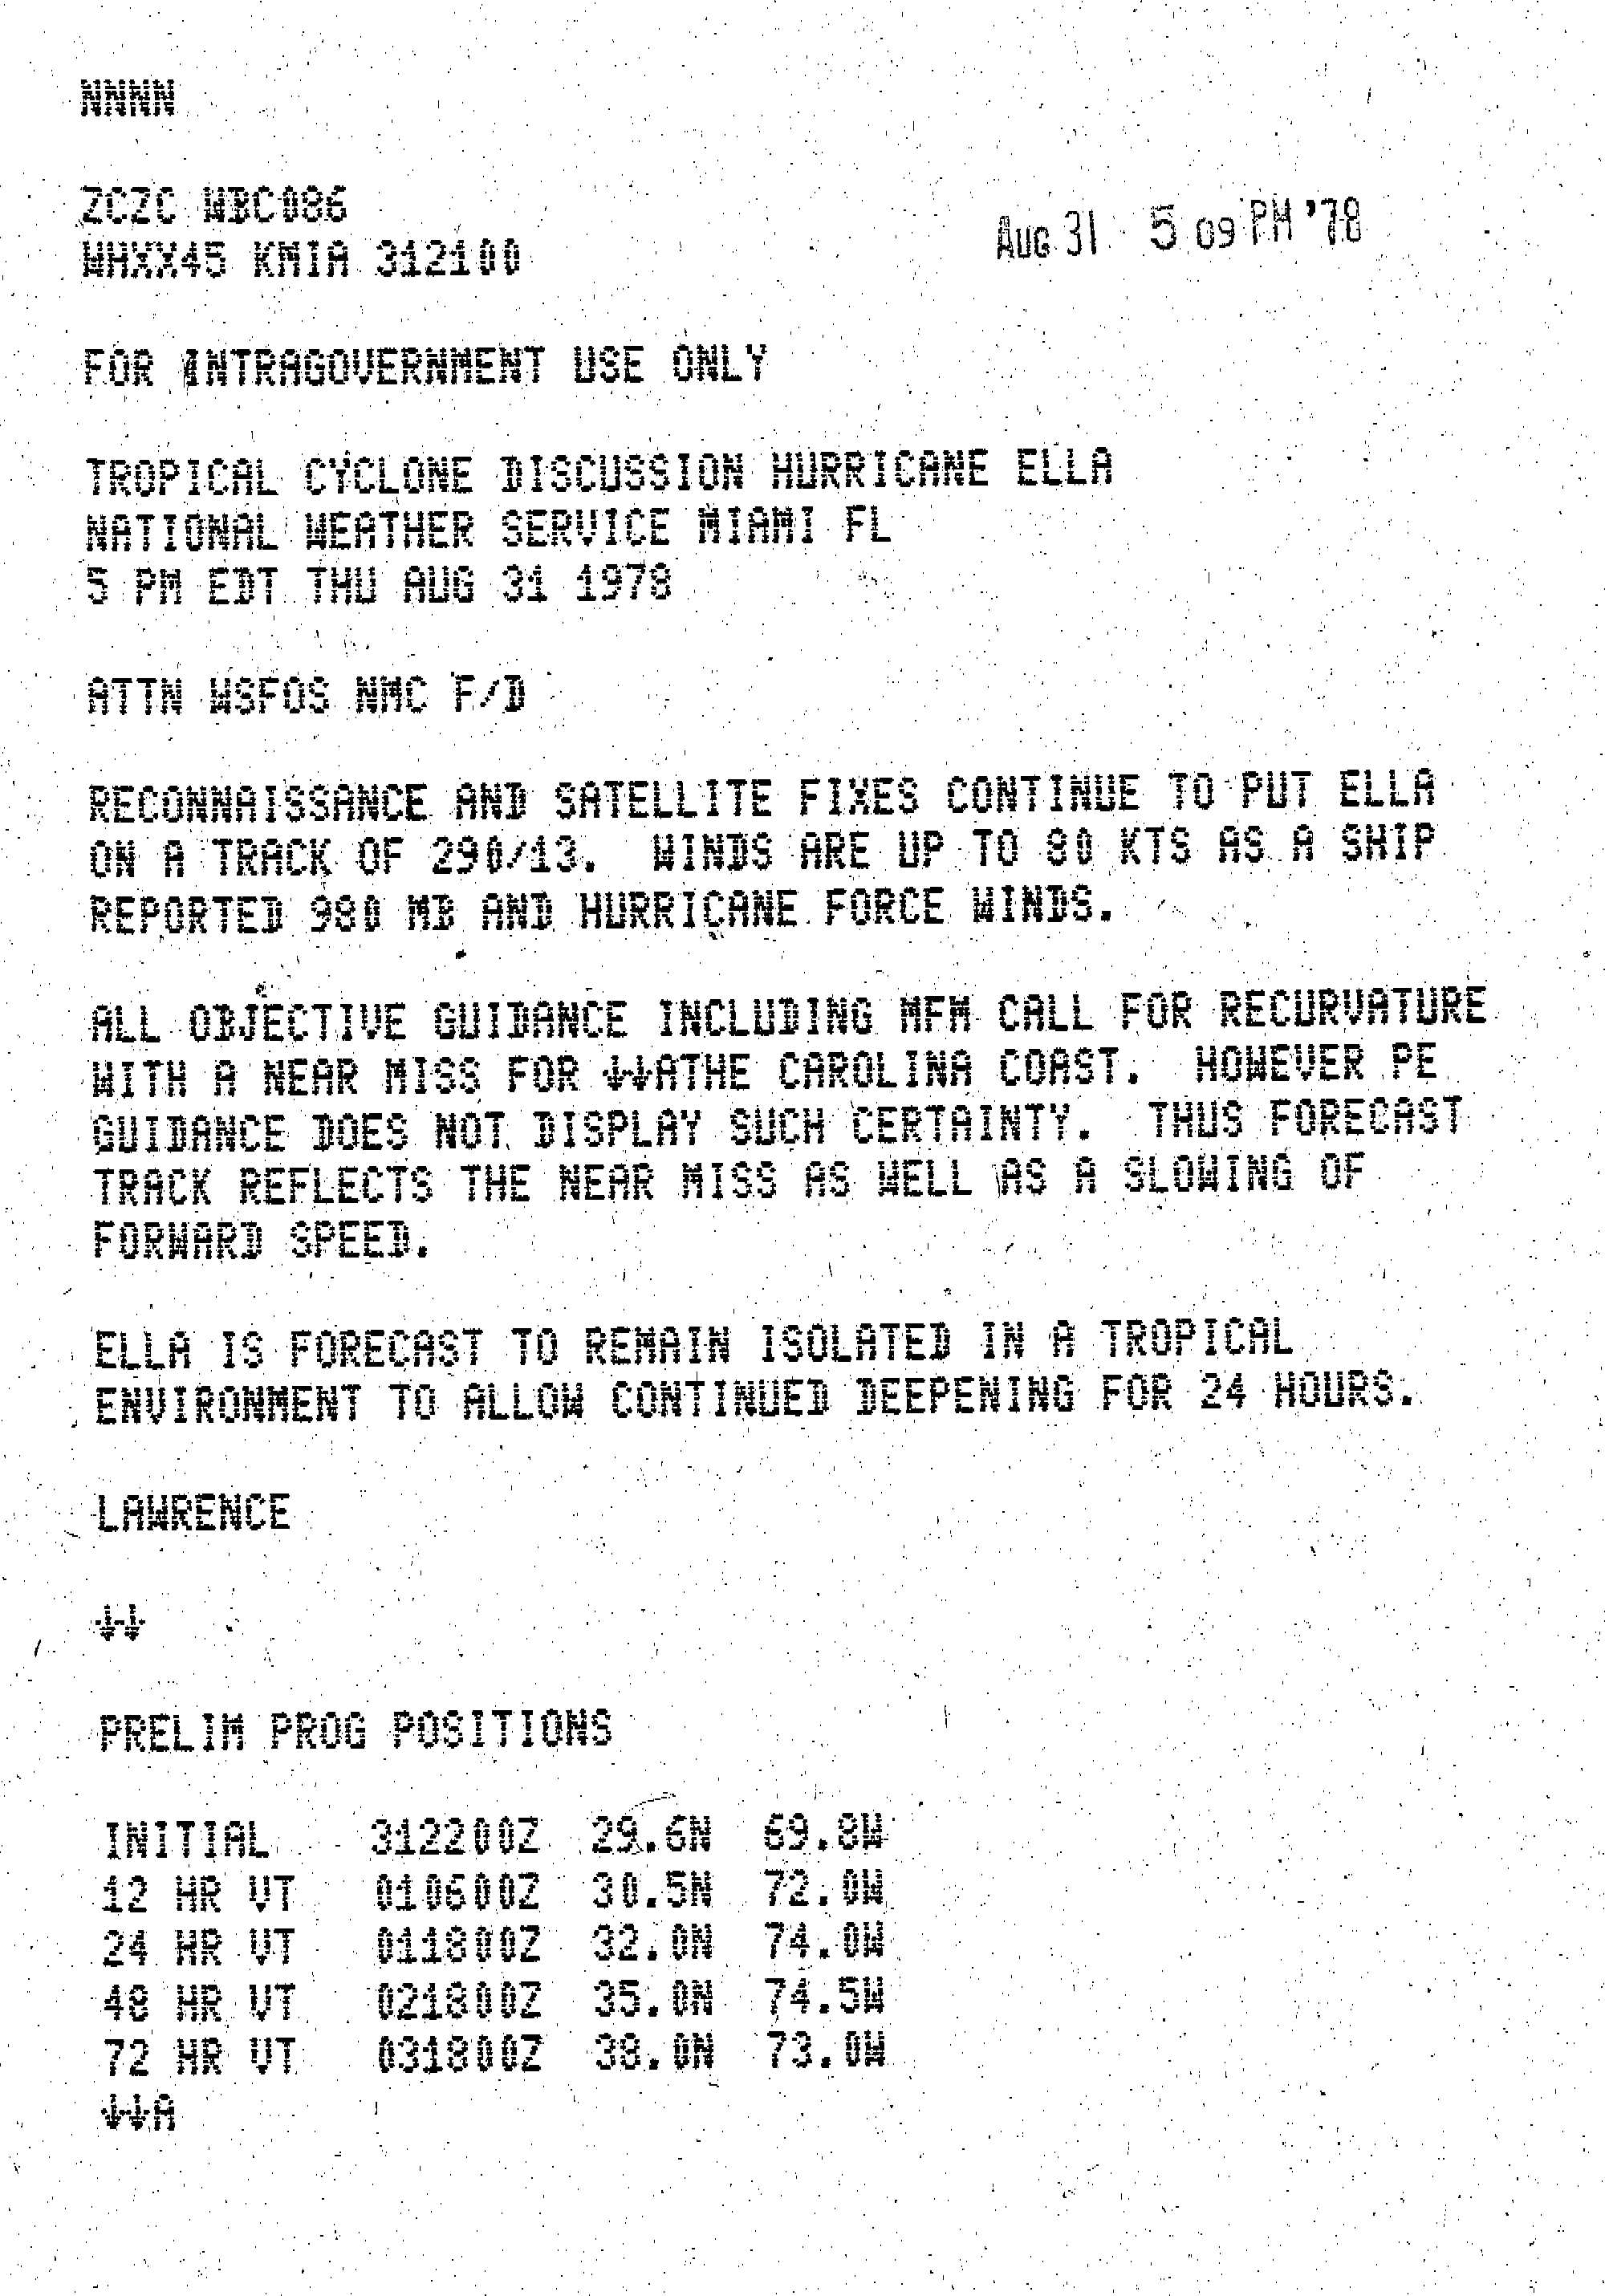
A cold front spawned a tropical disturbance near Bermuda, which became a tropical depression on August 30. The depression strengthened, and by early on August 31, it was upgraded to Tropical Storm Ella. Ship reports indicated that Ella became a hurricane later that day. Further significant intensification occurred, and the storm reached a preliminary peak intensity of 125 mph (201 km/h). A short-wave trough over the Eastern United States caused Ella to decelerate and turn north.[39] Simultaneously, dry air diminished convection on September 2, which in turn resulted in weakening.[40][41] Eventually, another trough forced Ella to re-curve northeastward, thereby remaining well offshore the East Coast of the United States.[41]
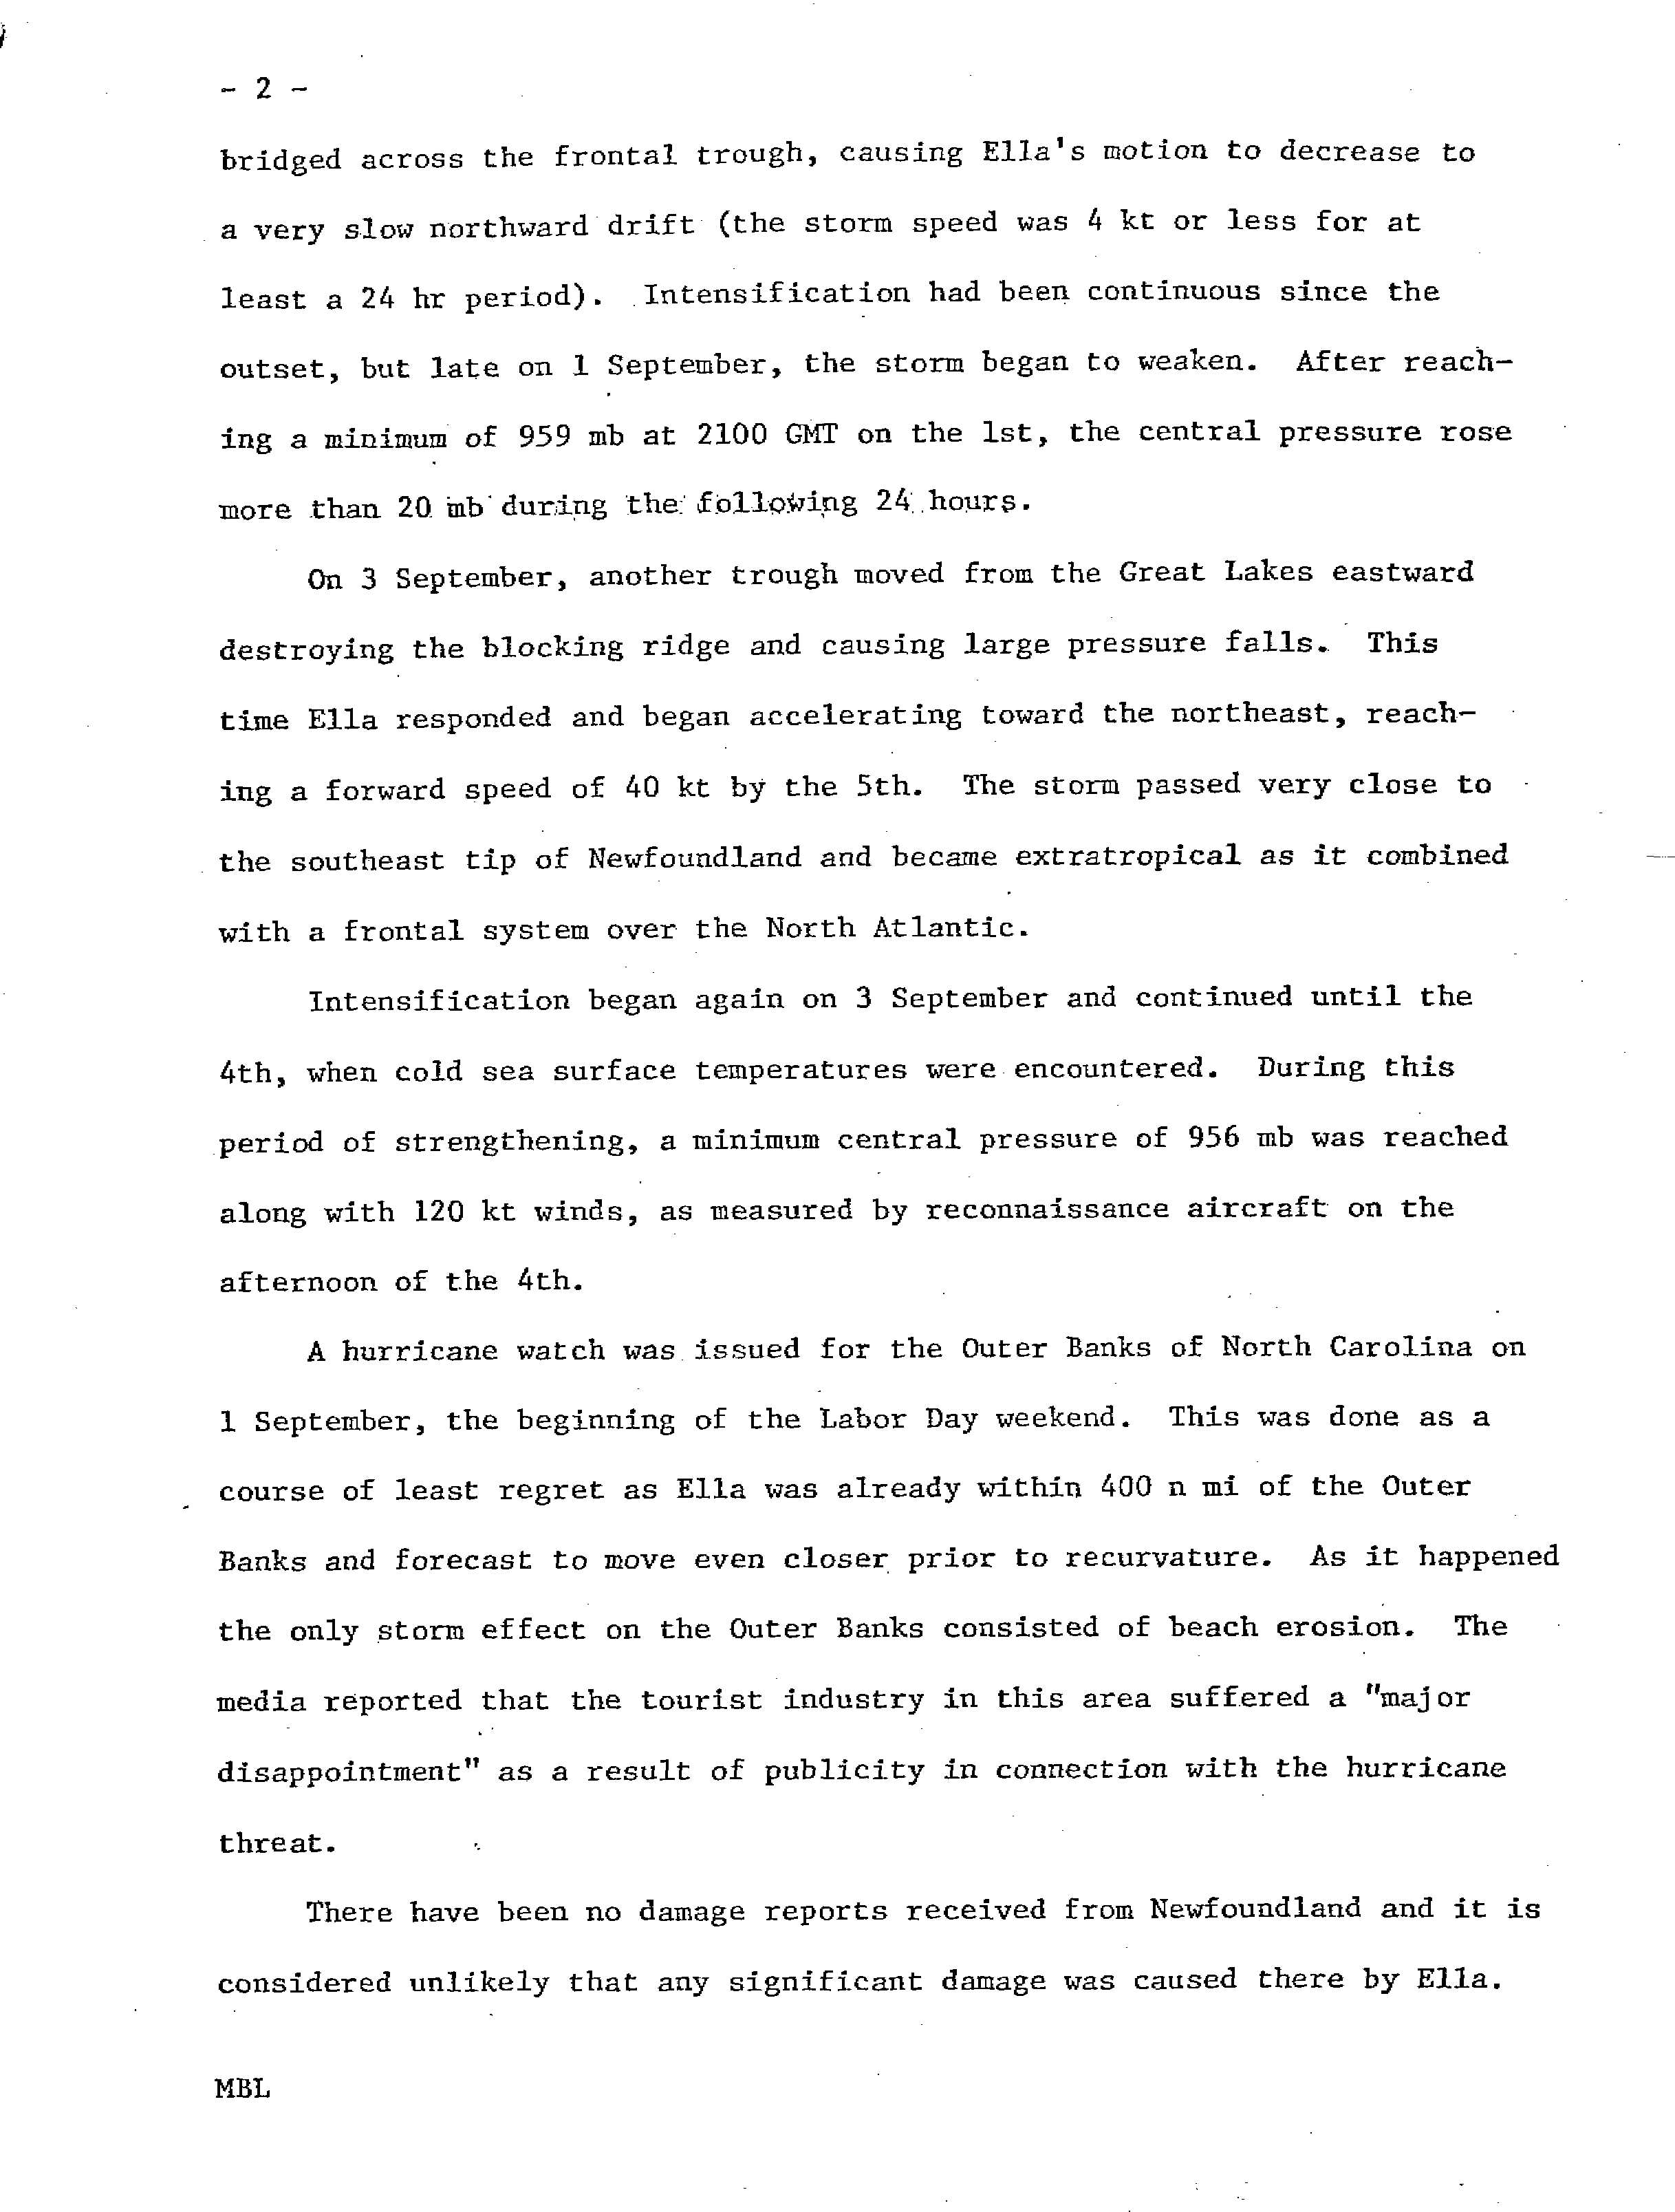
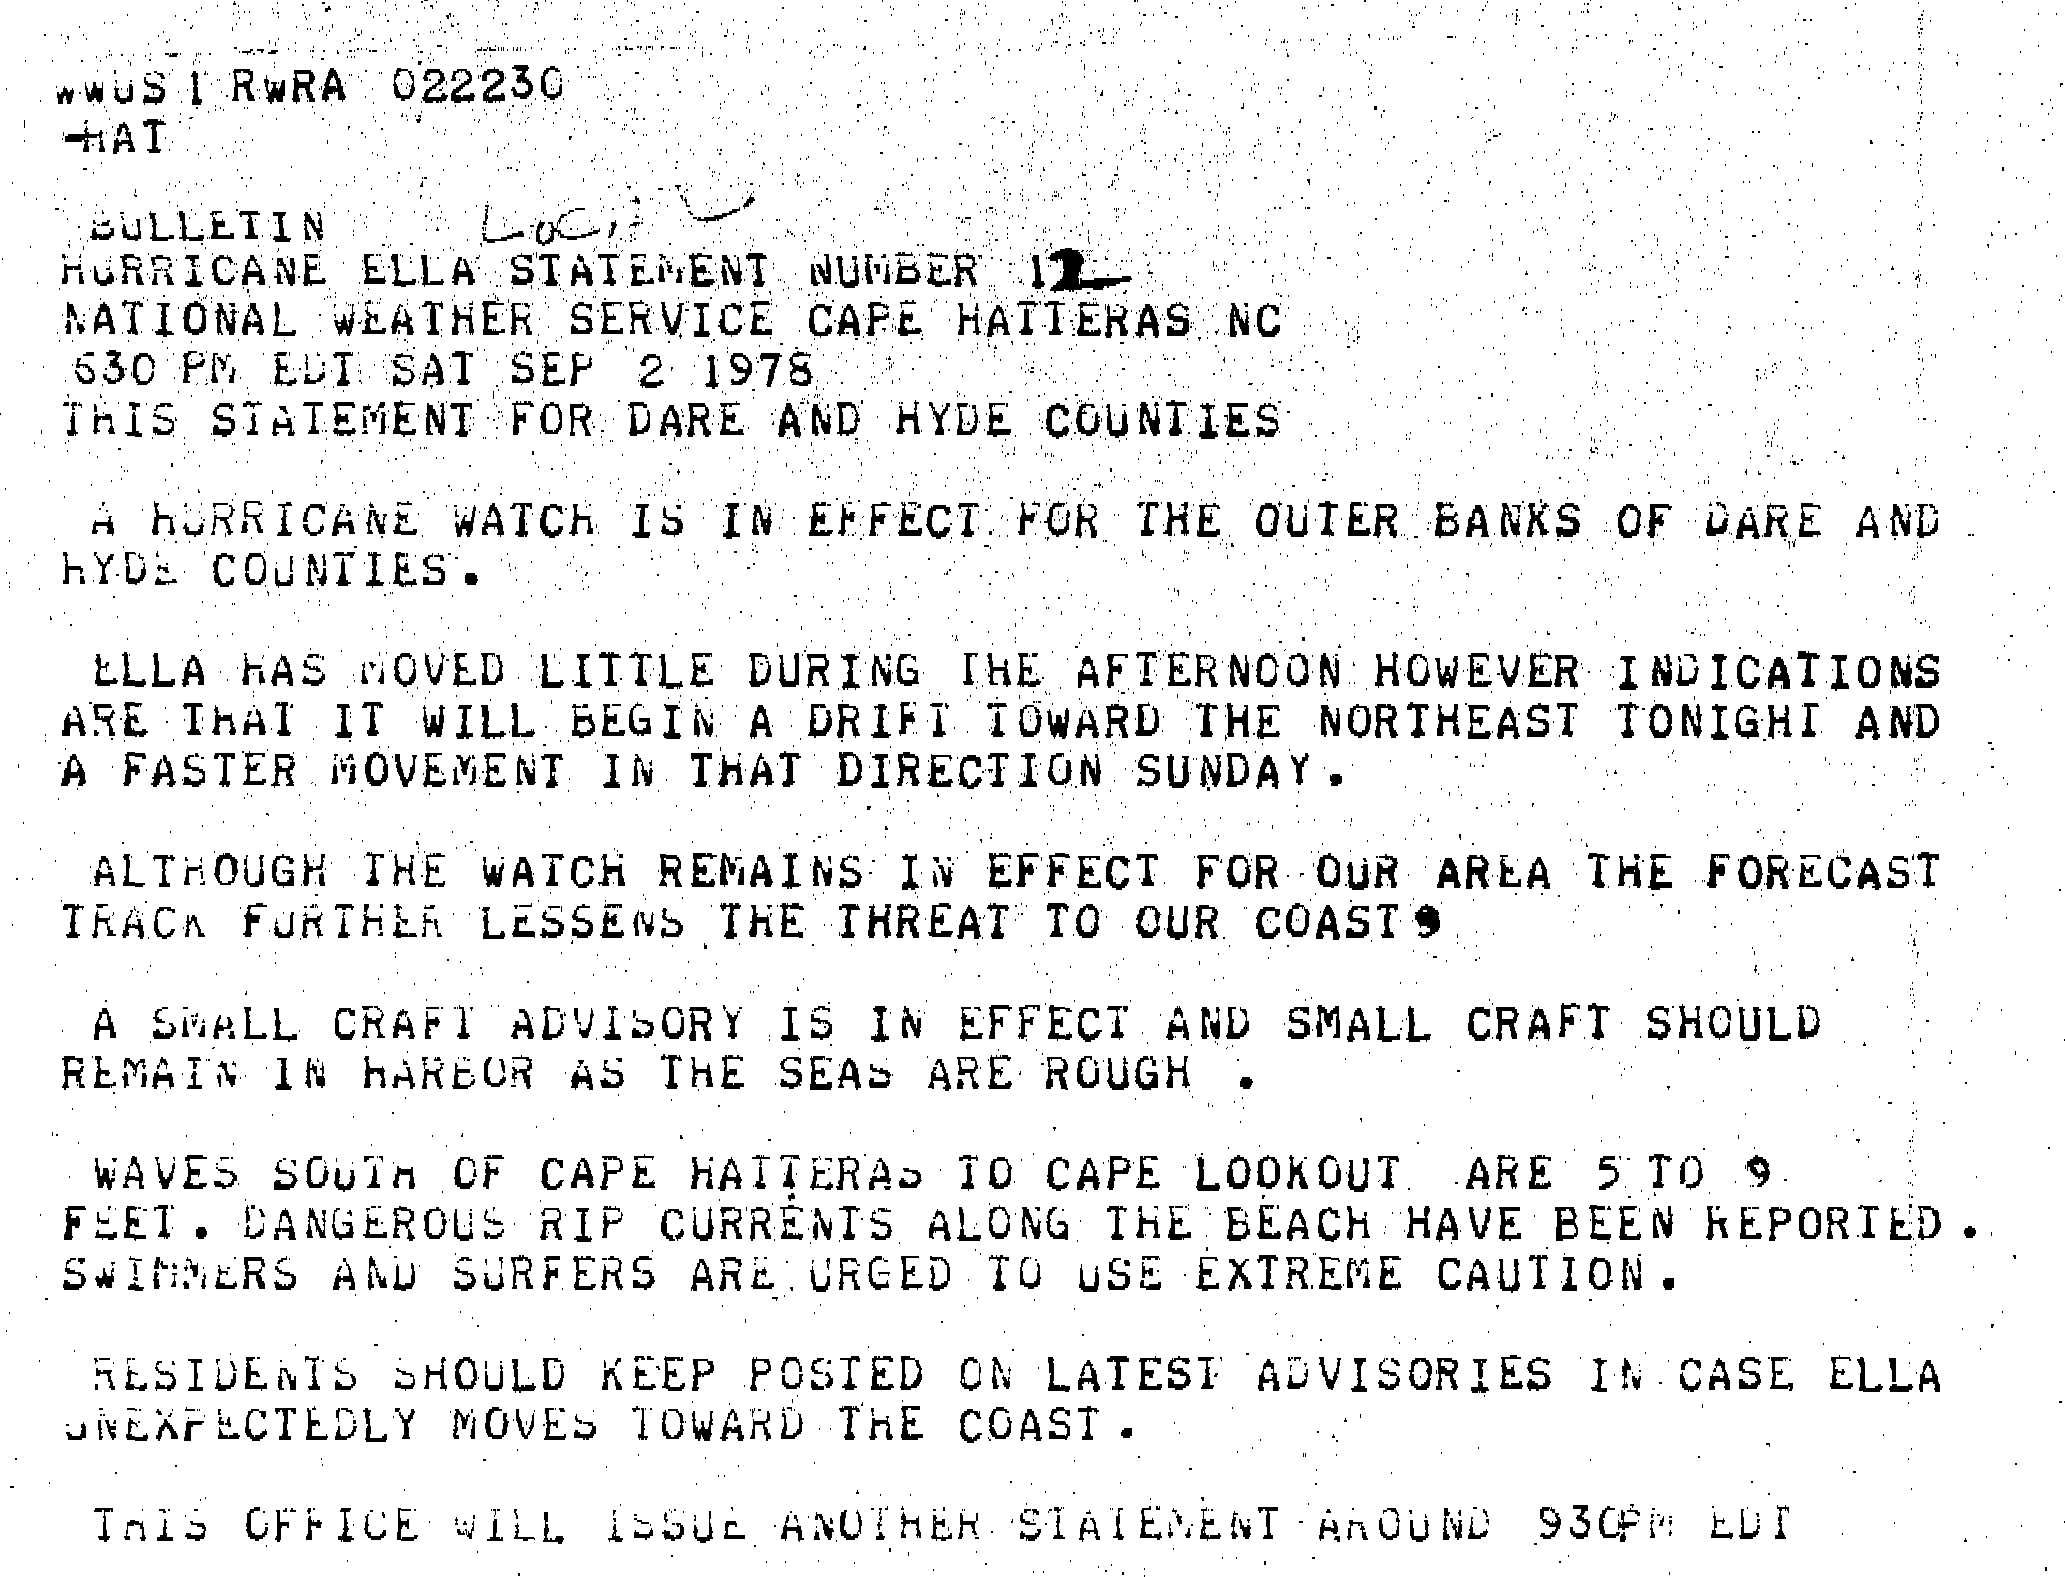
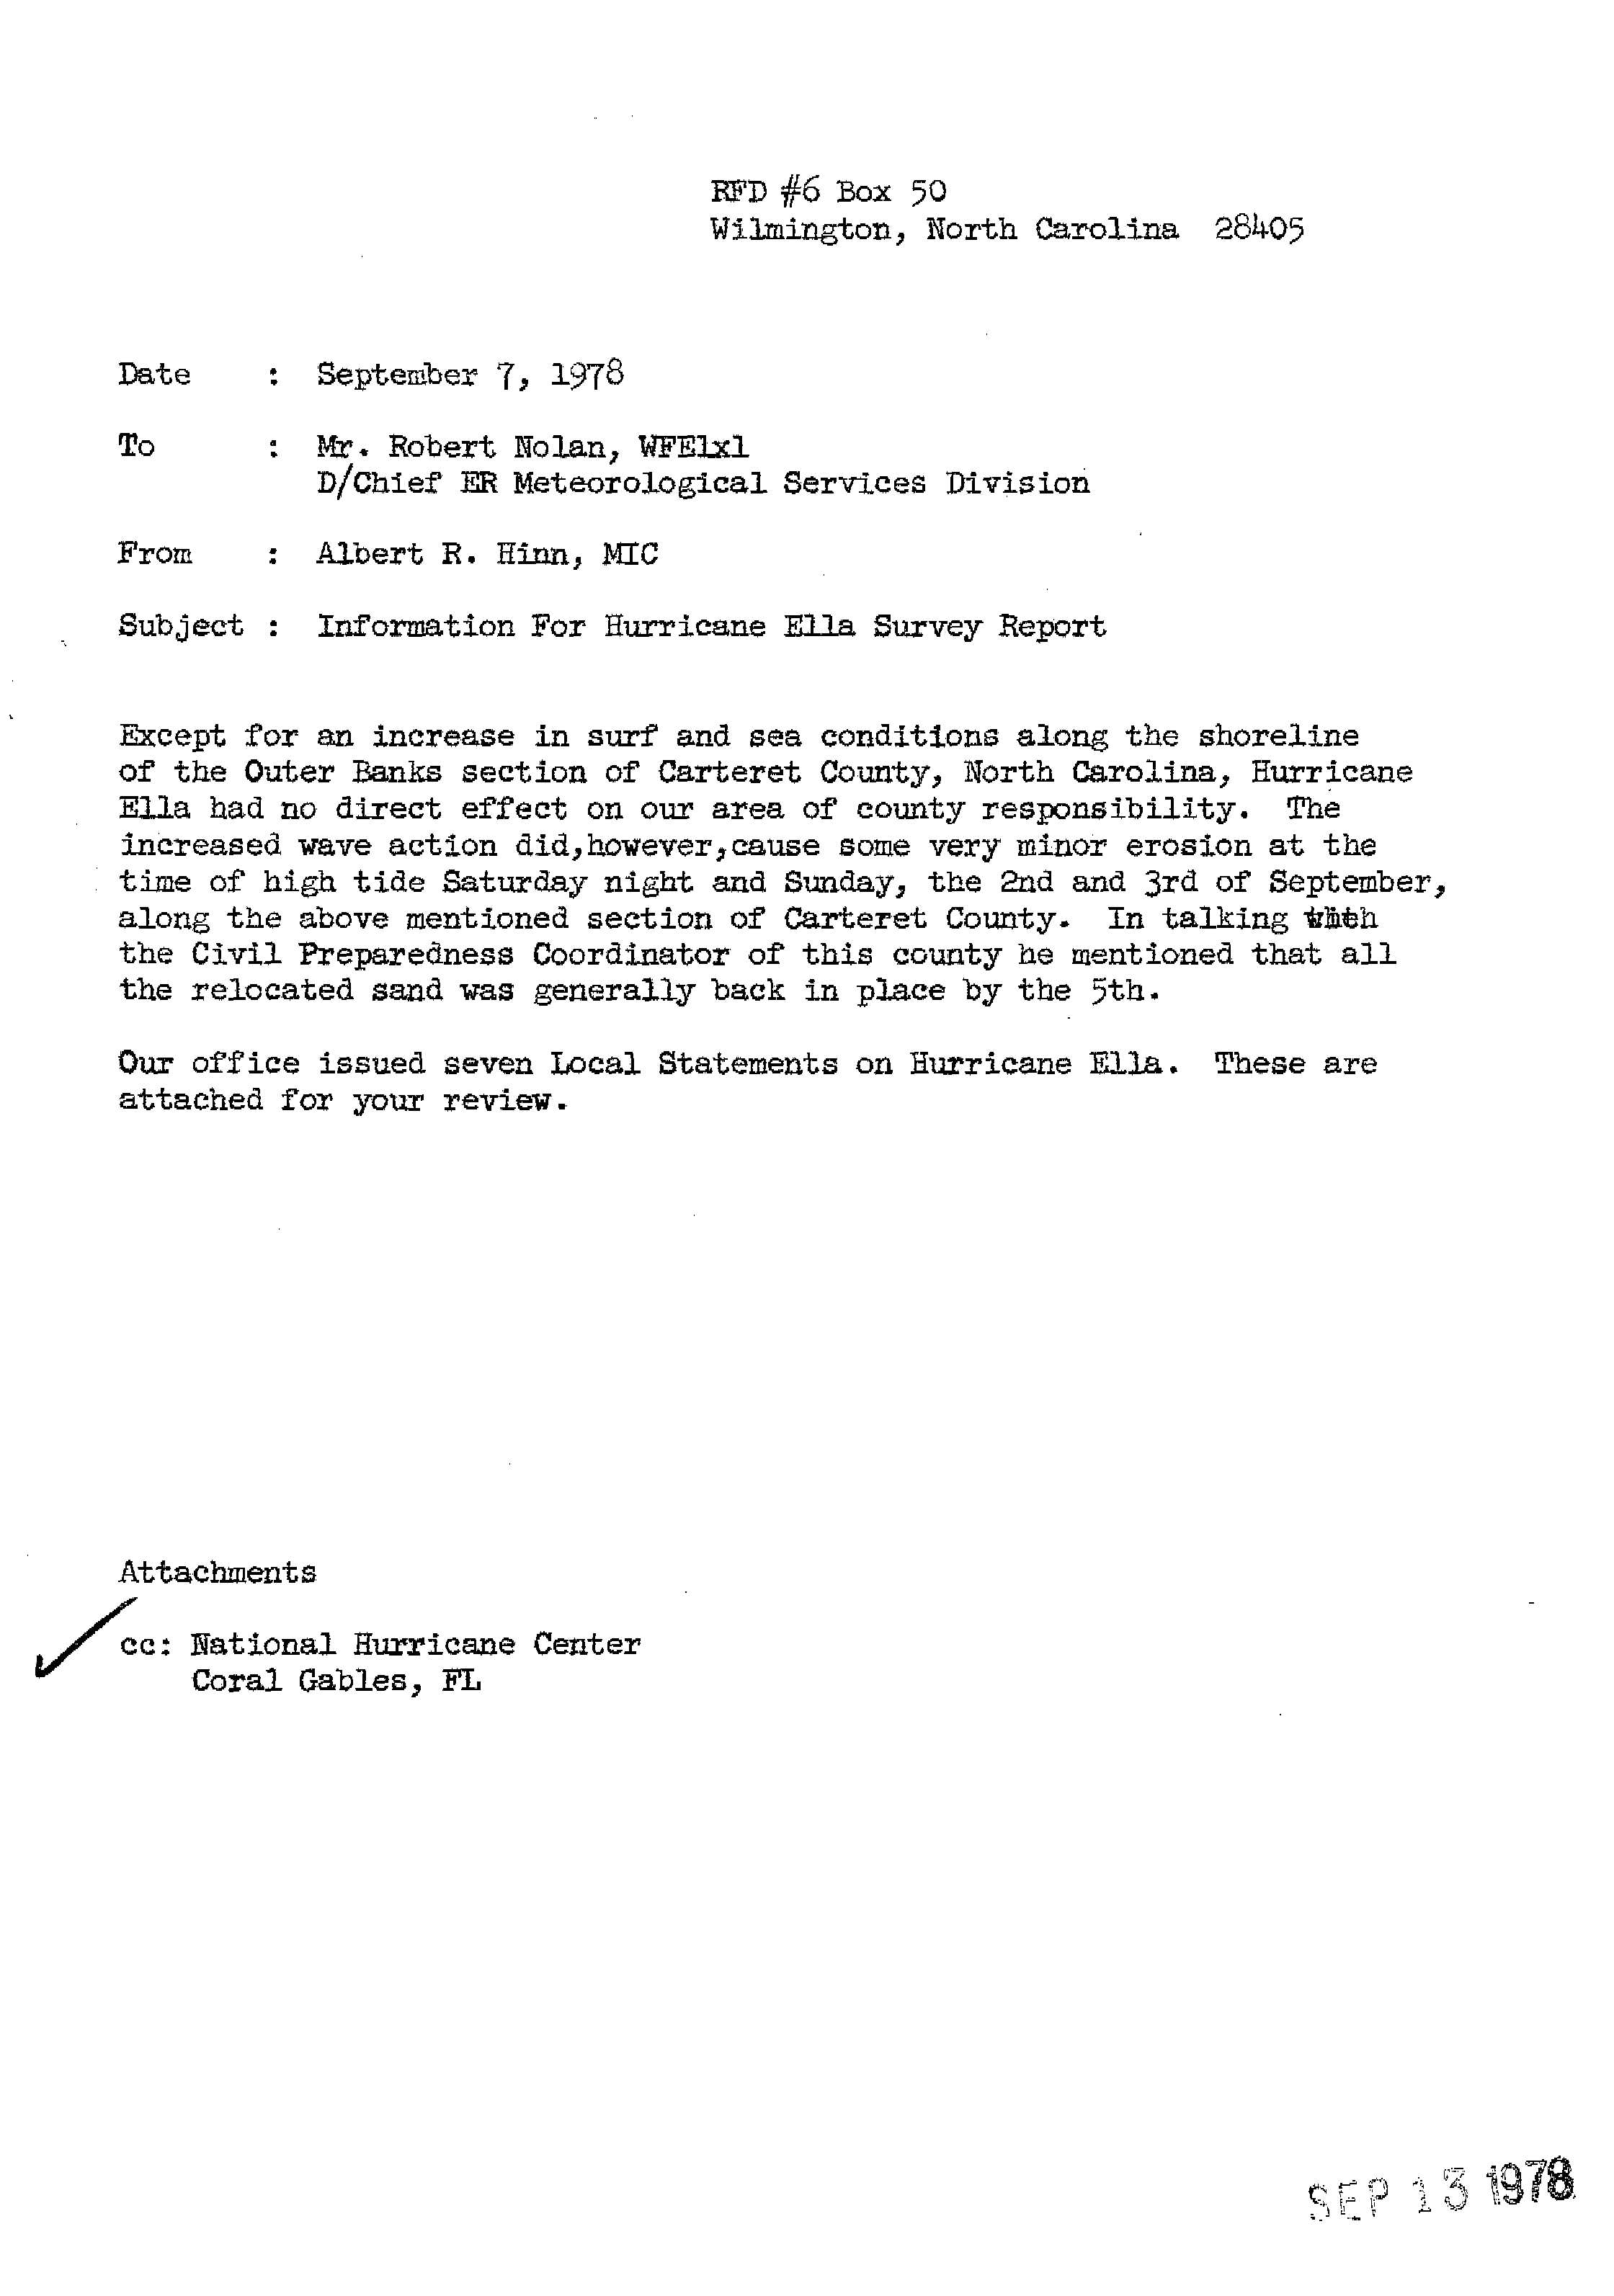
The storm then re-intensified and by 1200 UTC on September 4, Ella peaked as a Category 4 hurricane with winds of 140 mph (230 km/h). Thereafter, Ella rapidly weakened as it passed offshore Atlantic Canada, before being absorbed by an extratropical storm while located more than 700 mi (1,100 km) northeast of St. John's on September 5.[41] Ella threatened to pass within 50 mi (80 km) of North Carolina.[42] Because of this, a hurricane watch being issued for the Outer Banks of North Carolina during Labor Day Weekend, resulting in a significant drop in tourism occurred. However, because the storm veered northeastward,[41] little effects other than 5 to 9 ft (1.5 to 2.7 m) waves,[43] minor beach erosion, and light winds in coastal portions of North Carolina.[44] In Newfoundland, Ella produced rainfall amounts reaching 2.39 in (61 mm) and wind gusts up to 71 mph (114 km/h).[45]
Hurricane Flossie
| Category 2 hurricane (SSHWS) | |||
|---|---|---|---|
| |||
| Duration | September 4 – September 15 | ||
| Peak intensity | 100 mph (155 km/h) (1-min) 976 mbar (hPa) | ||

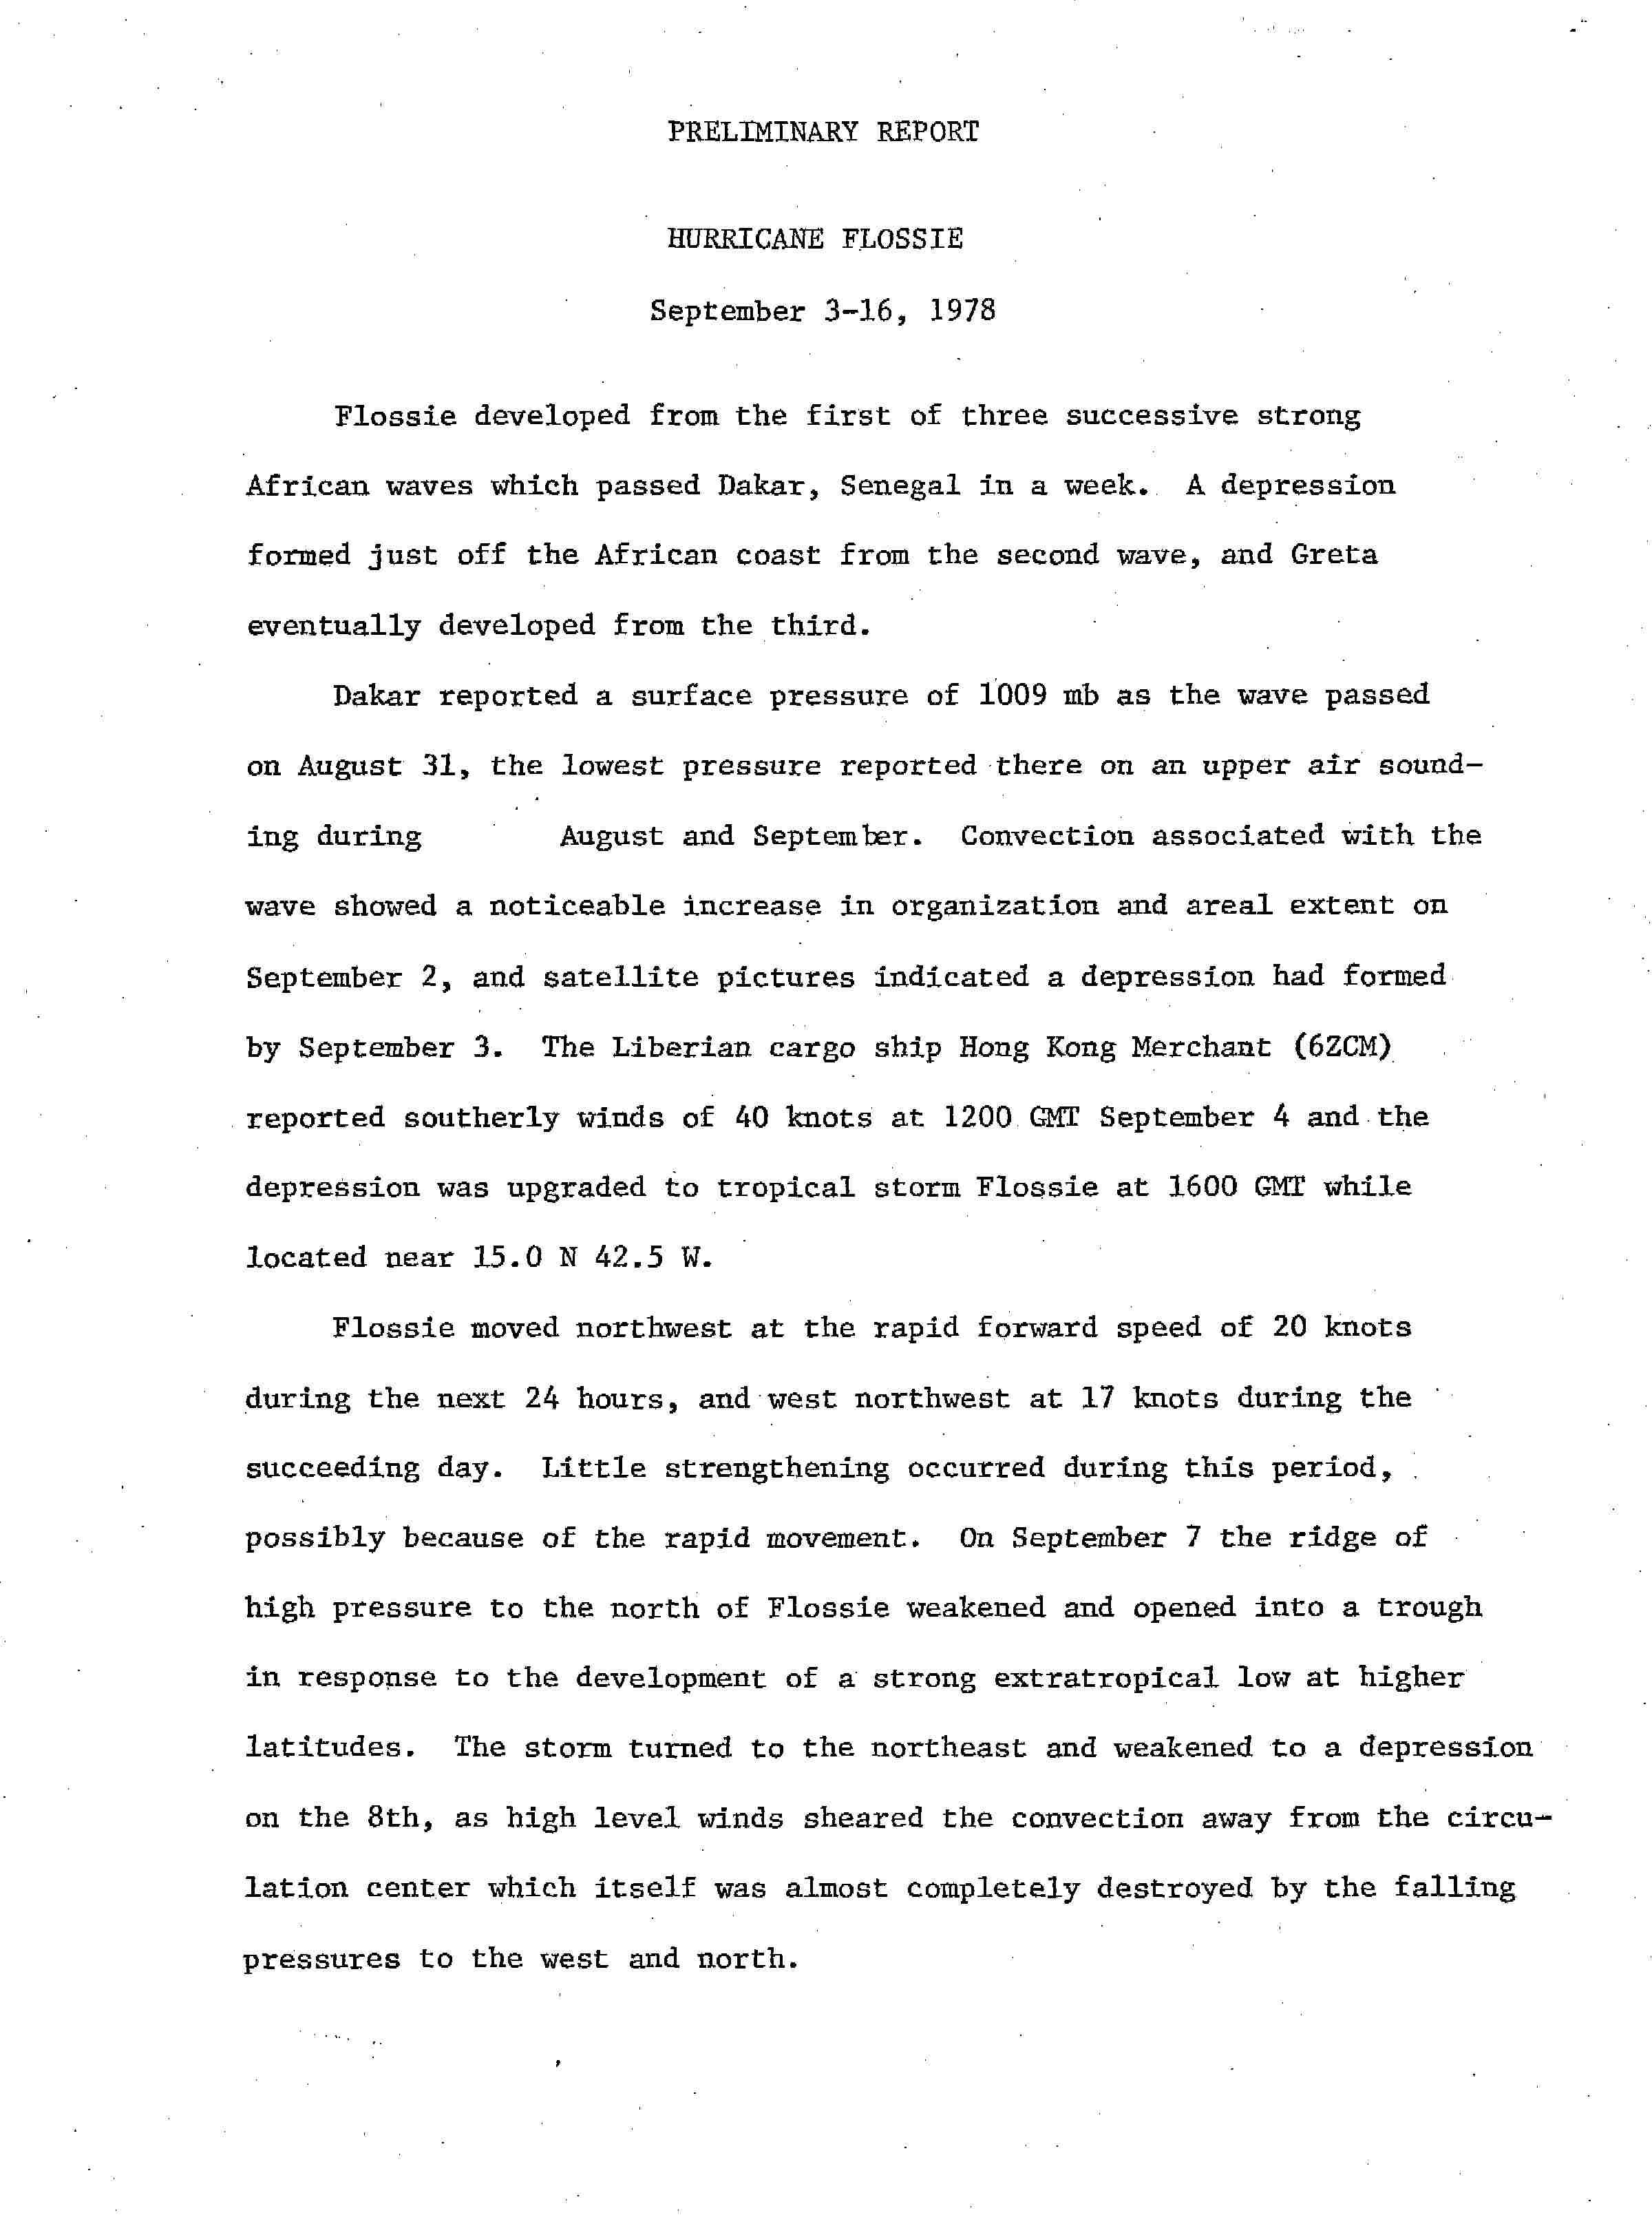
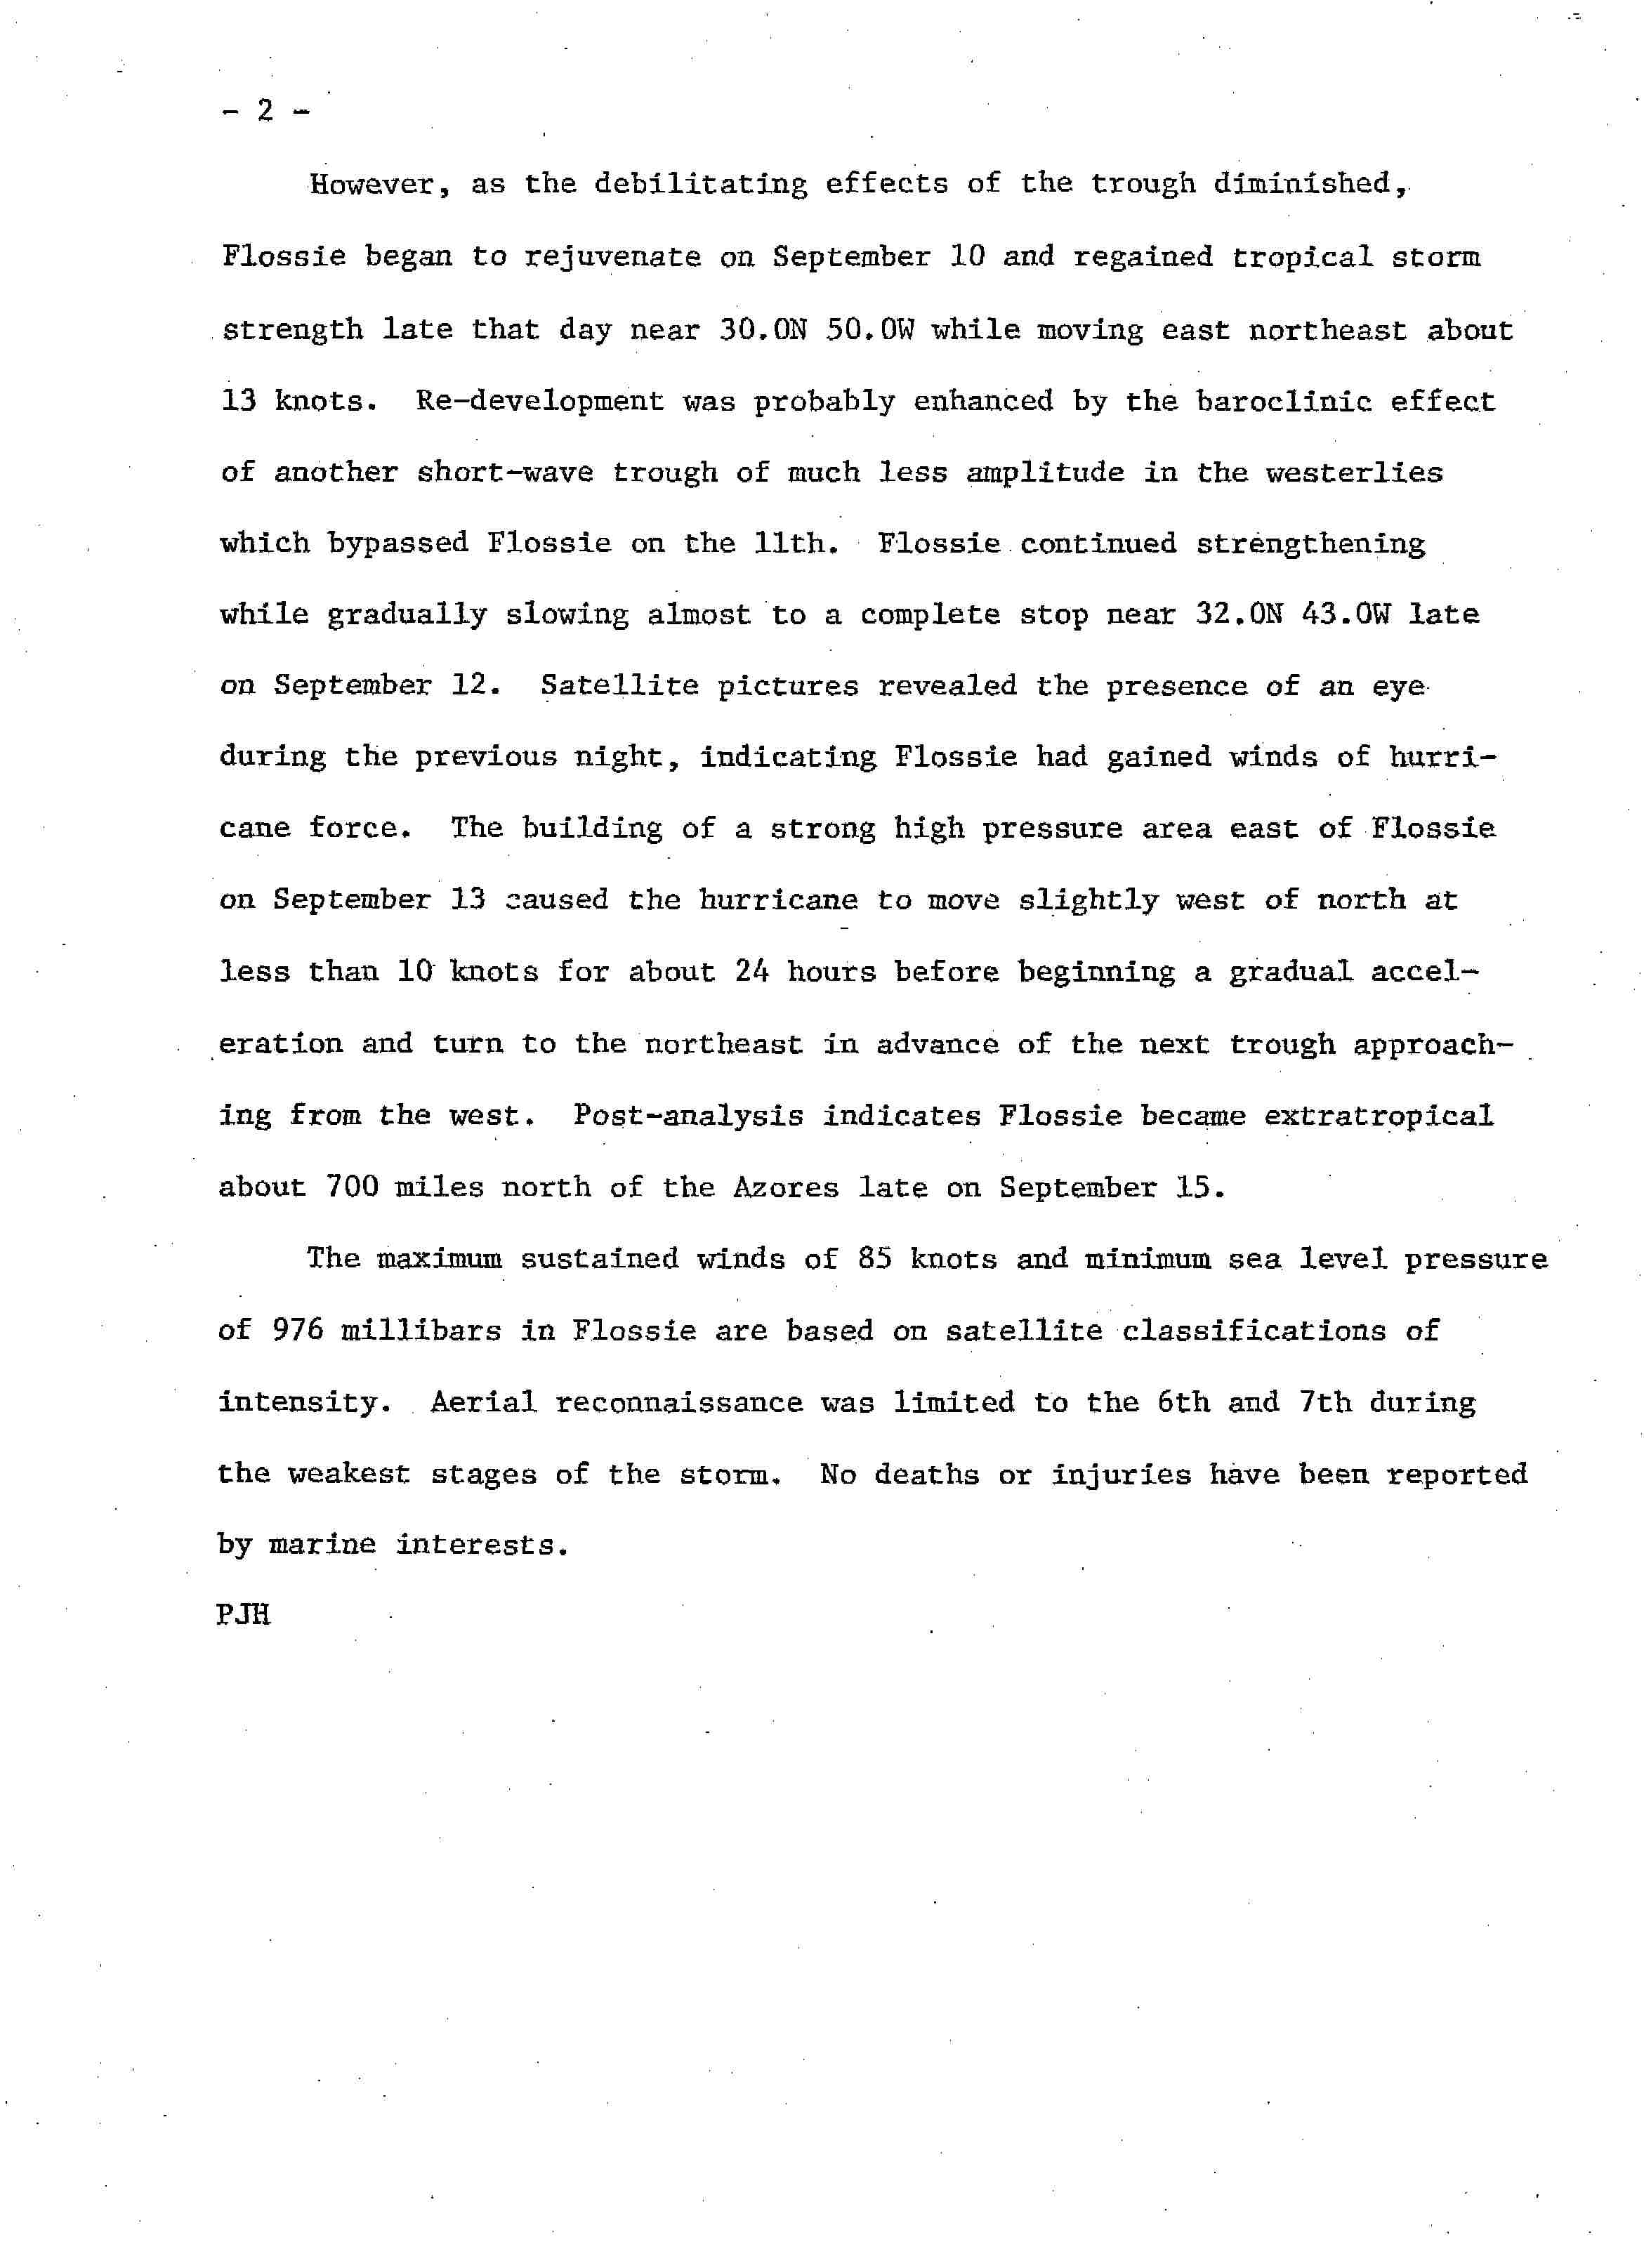
A tropical wave passed westward across Dakar, Senegal on August 31 and entered the Atlantic Ocean later that day. Convection markedly increased over the next few days and by 0000 UTC on September 4, the wave developed into a tropical depression while located about midway between Africa and the Lesser Antilles. Later that day, the Hong Kong Merchant reported tropical storm force winds, thus the depression was upgraded to Tropical Storm Flossie. It initially tracked northwestward at 23 mph (37 km/h) and minimal strengthening occurred, possibly due to rapid forward speeds. On September 5, the storm curved westward, until turning north on September 7. A high-pressure area transitioned into a trough, causing Flossie to re-curve northeastward and generating strong upper-level winds.[46]
On September 8, Flossie was downgraded to a tropical depression.[46] After the trough began weakening, favorable conditions returned, allowing Flossie to re-strengthen into a tropical storm on September 10. Flossie then decelerated and became nearly stationary on September 12. Around that time, the storm was upgraded to a hurricane. Further intensification continued, and Flossie peaked with winds of 100 mph (160 km/h) early on September 13. The storm began turned nearly due northward and began weakening. Flossie accelerated to the northeast and eventually transitioned into an extratropical cyclone while 700 miles (1,100 km) north of the Azores on September 15.[47] The strong extratropical cyclone brought winds as high as 104 mph (167 km/h) to Fair Isle, Great Britain.[48]
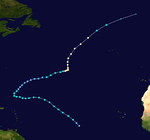
Hurricane Greta
| Category 4 hurricane (SSHWS) | |||
|---|---|---|---|
| |||
| Duration | September 13 – September 20 | ||
| Peak intensity | 130 mph (215 km/h) (1-min) 947 mbar (hPa) | ||
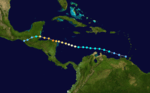
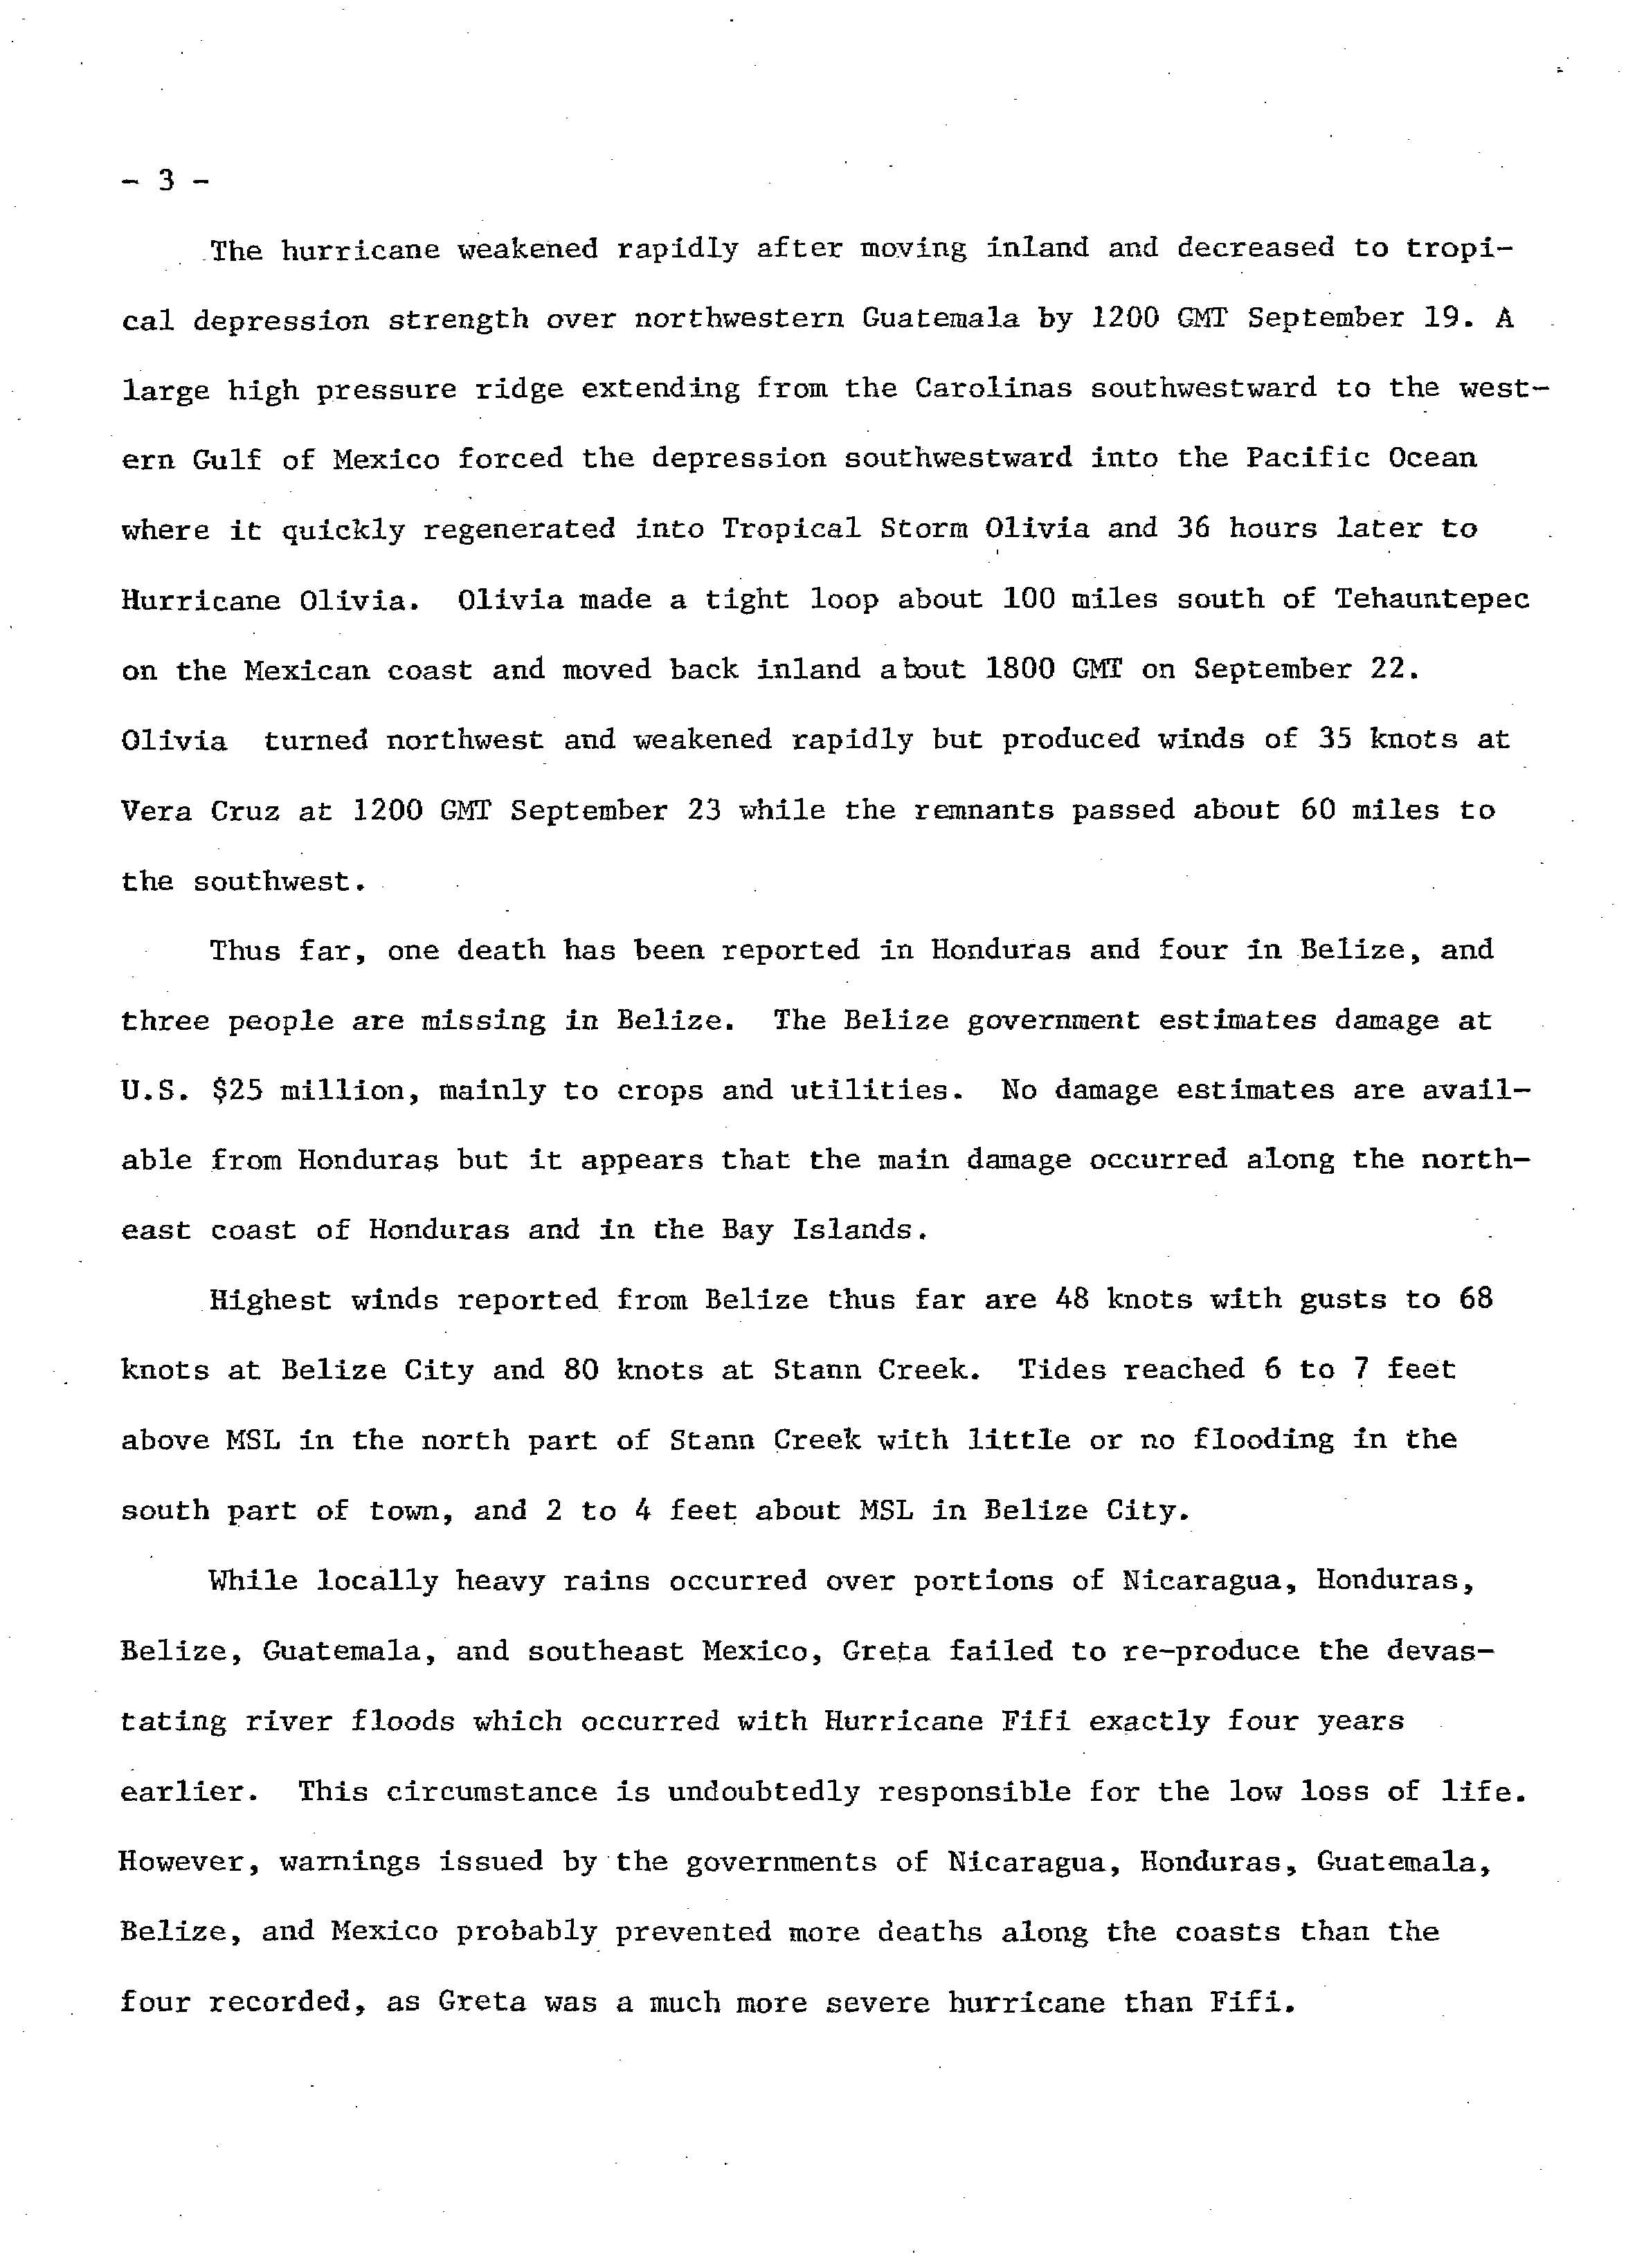
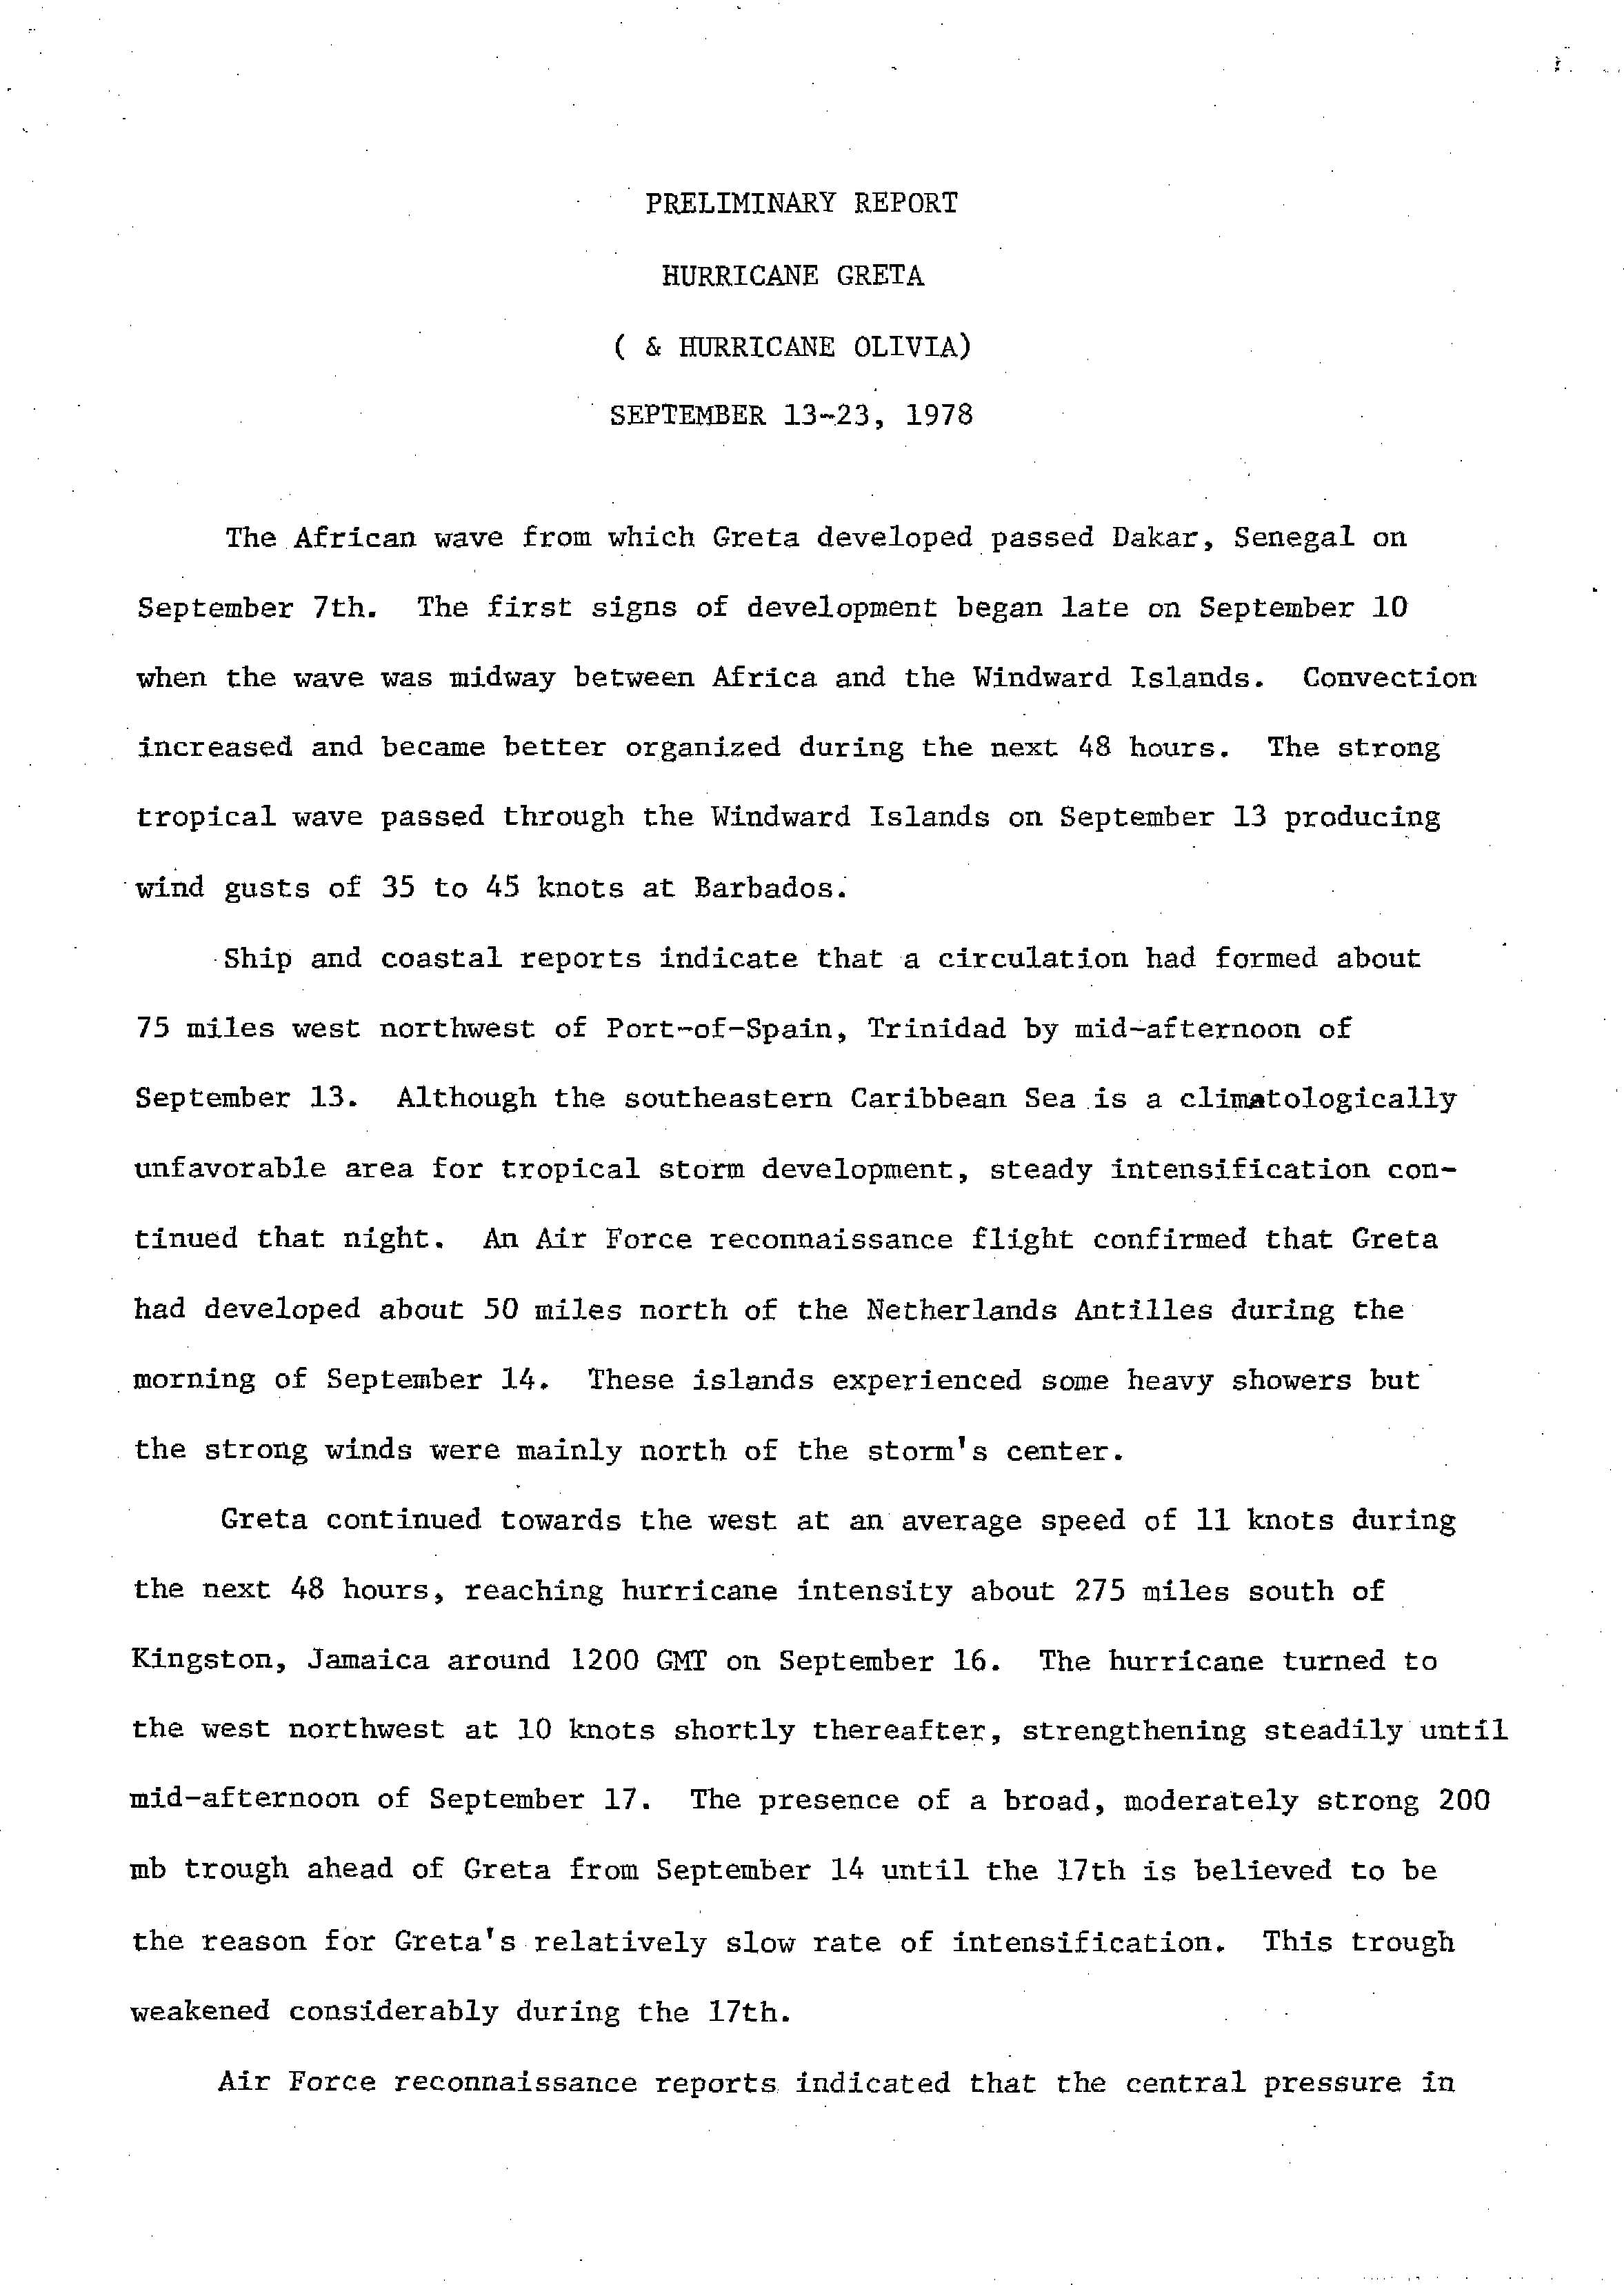
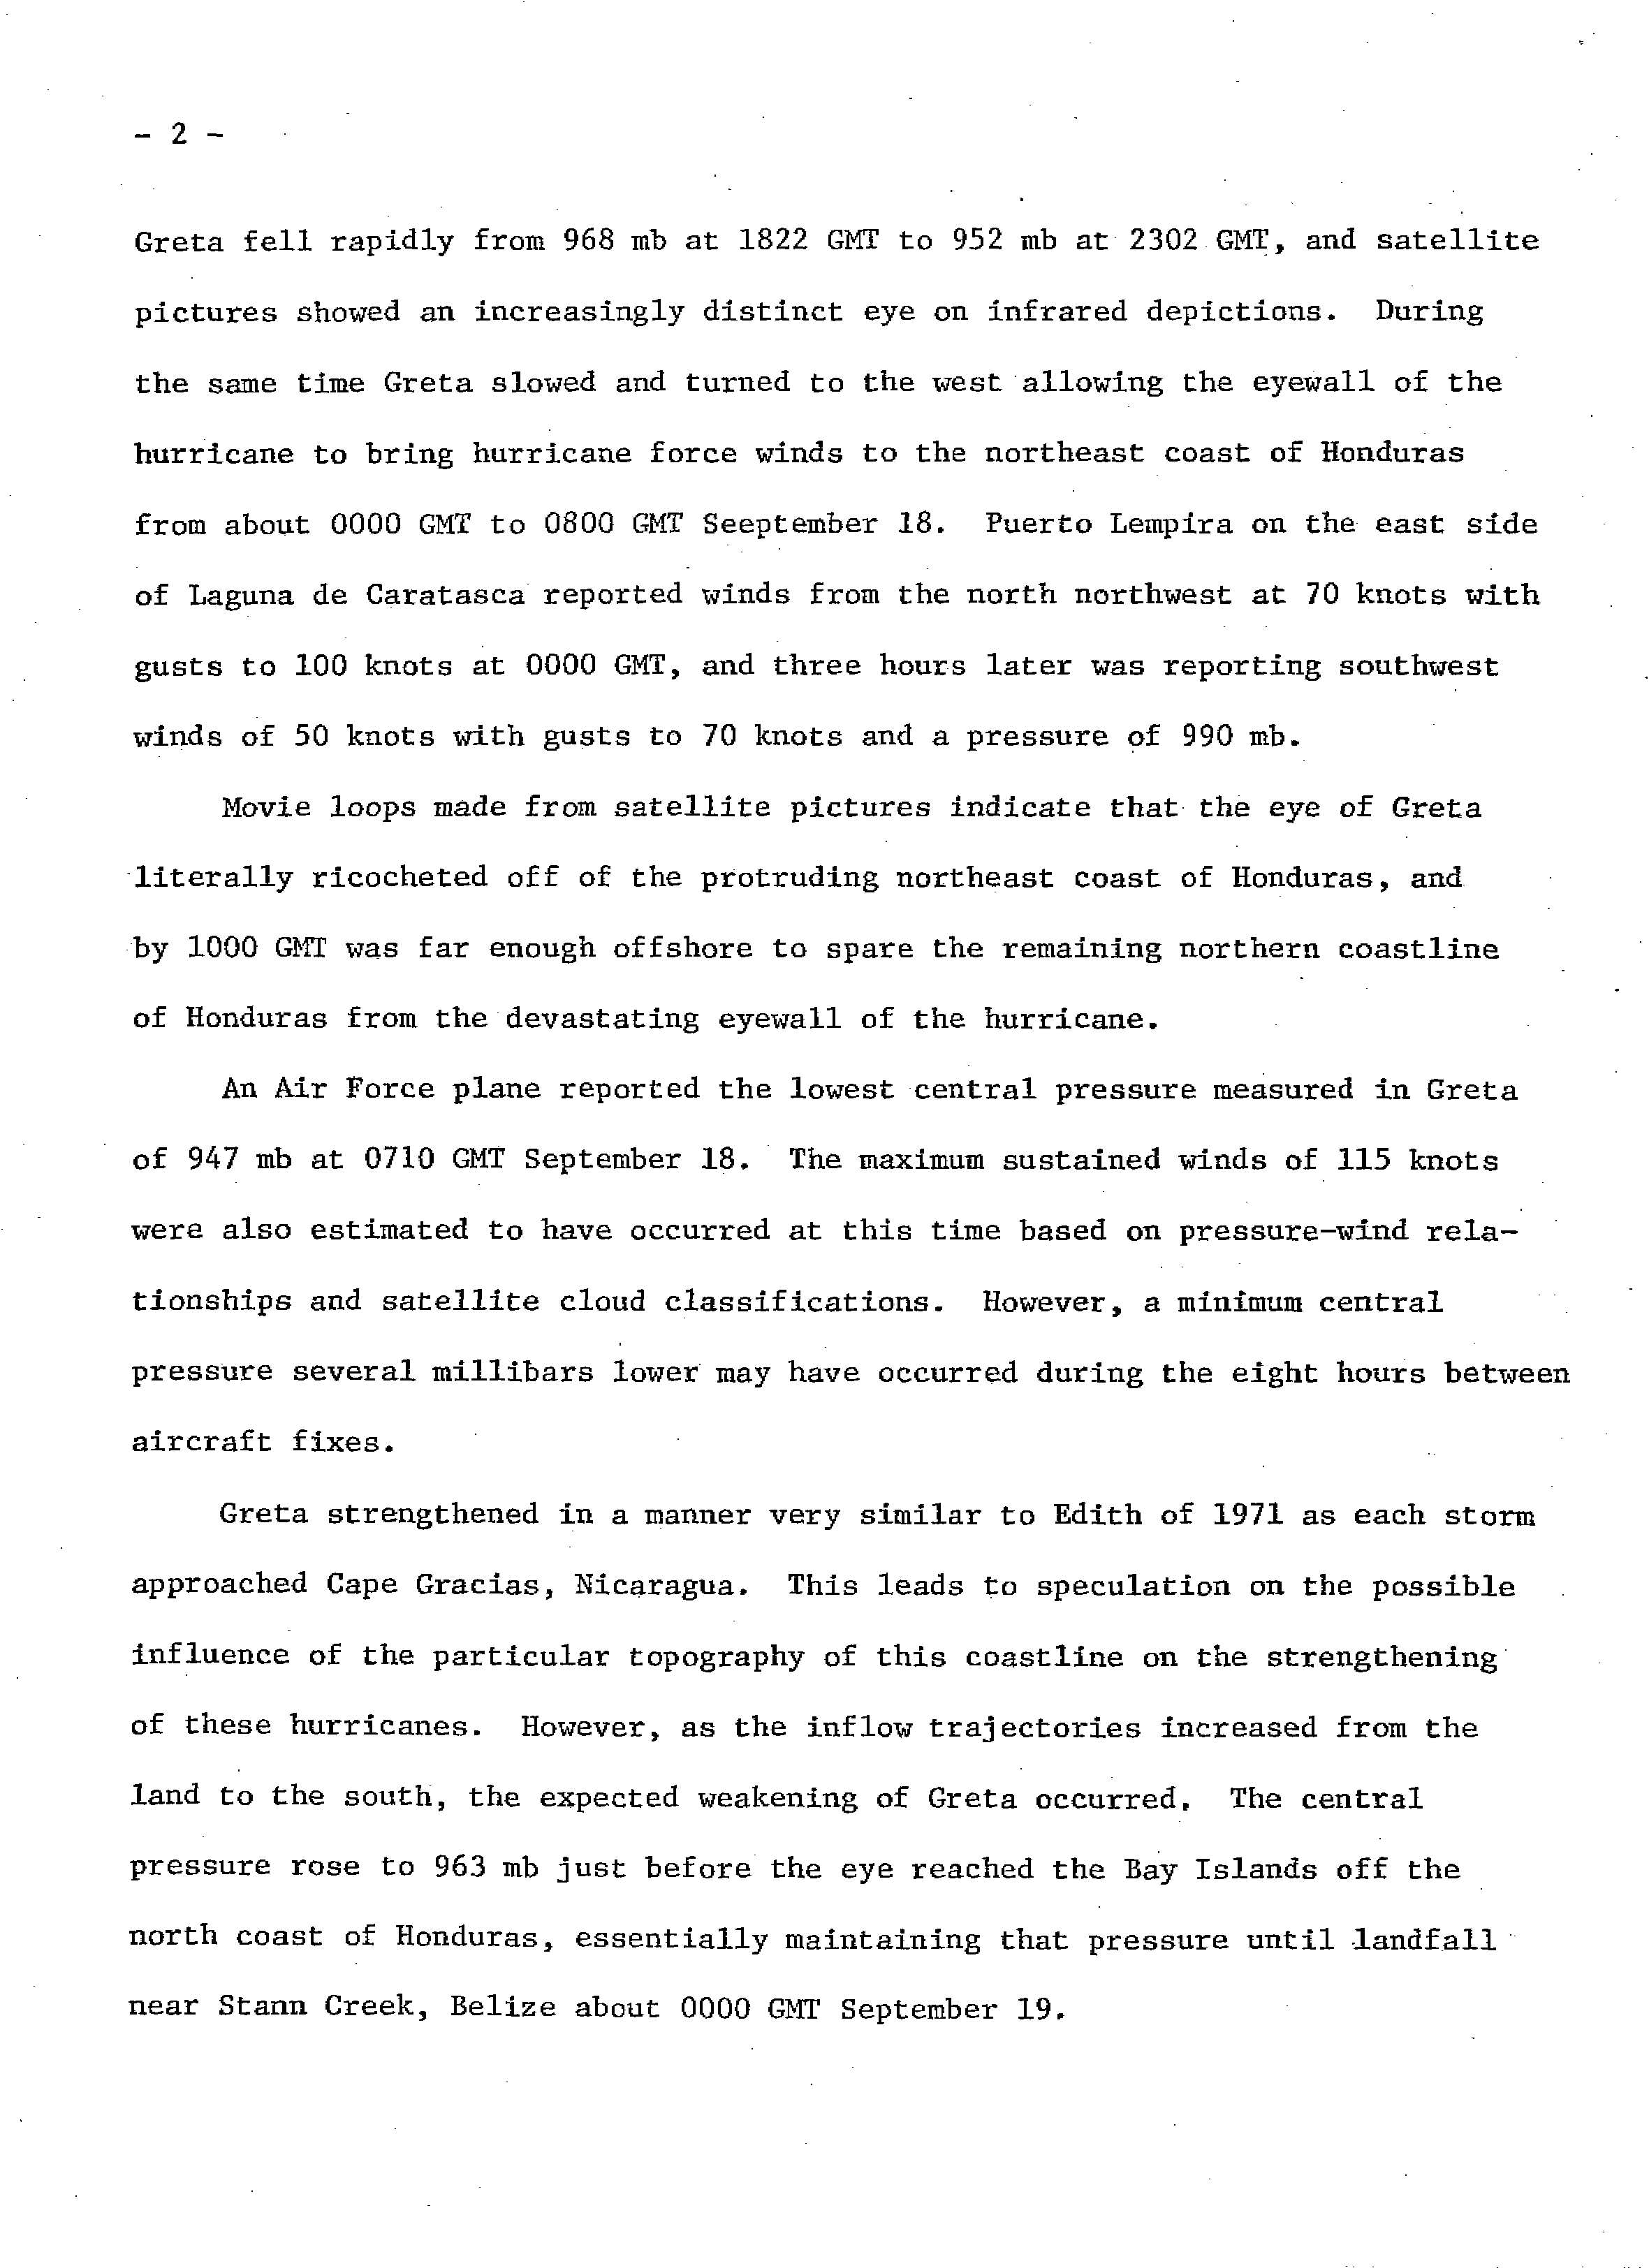
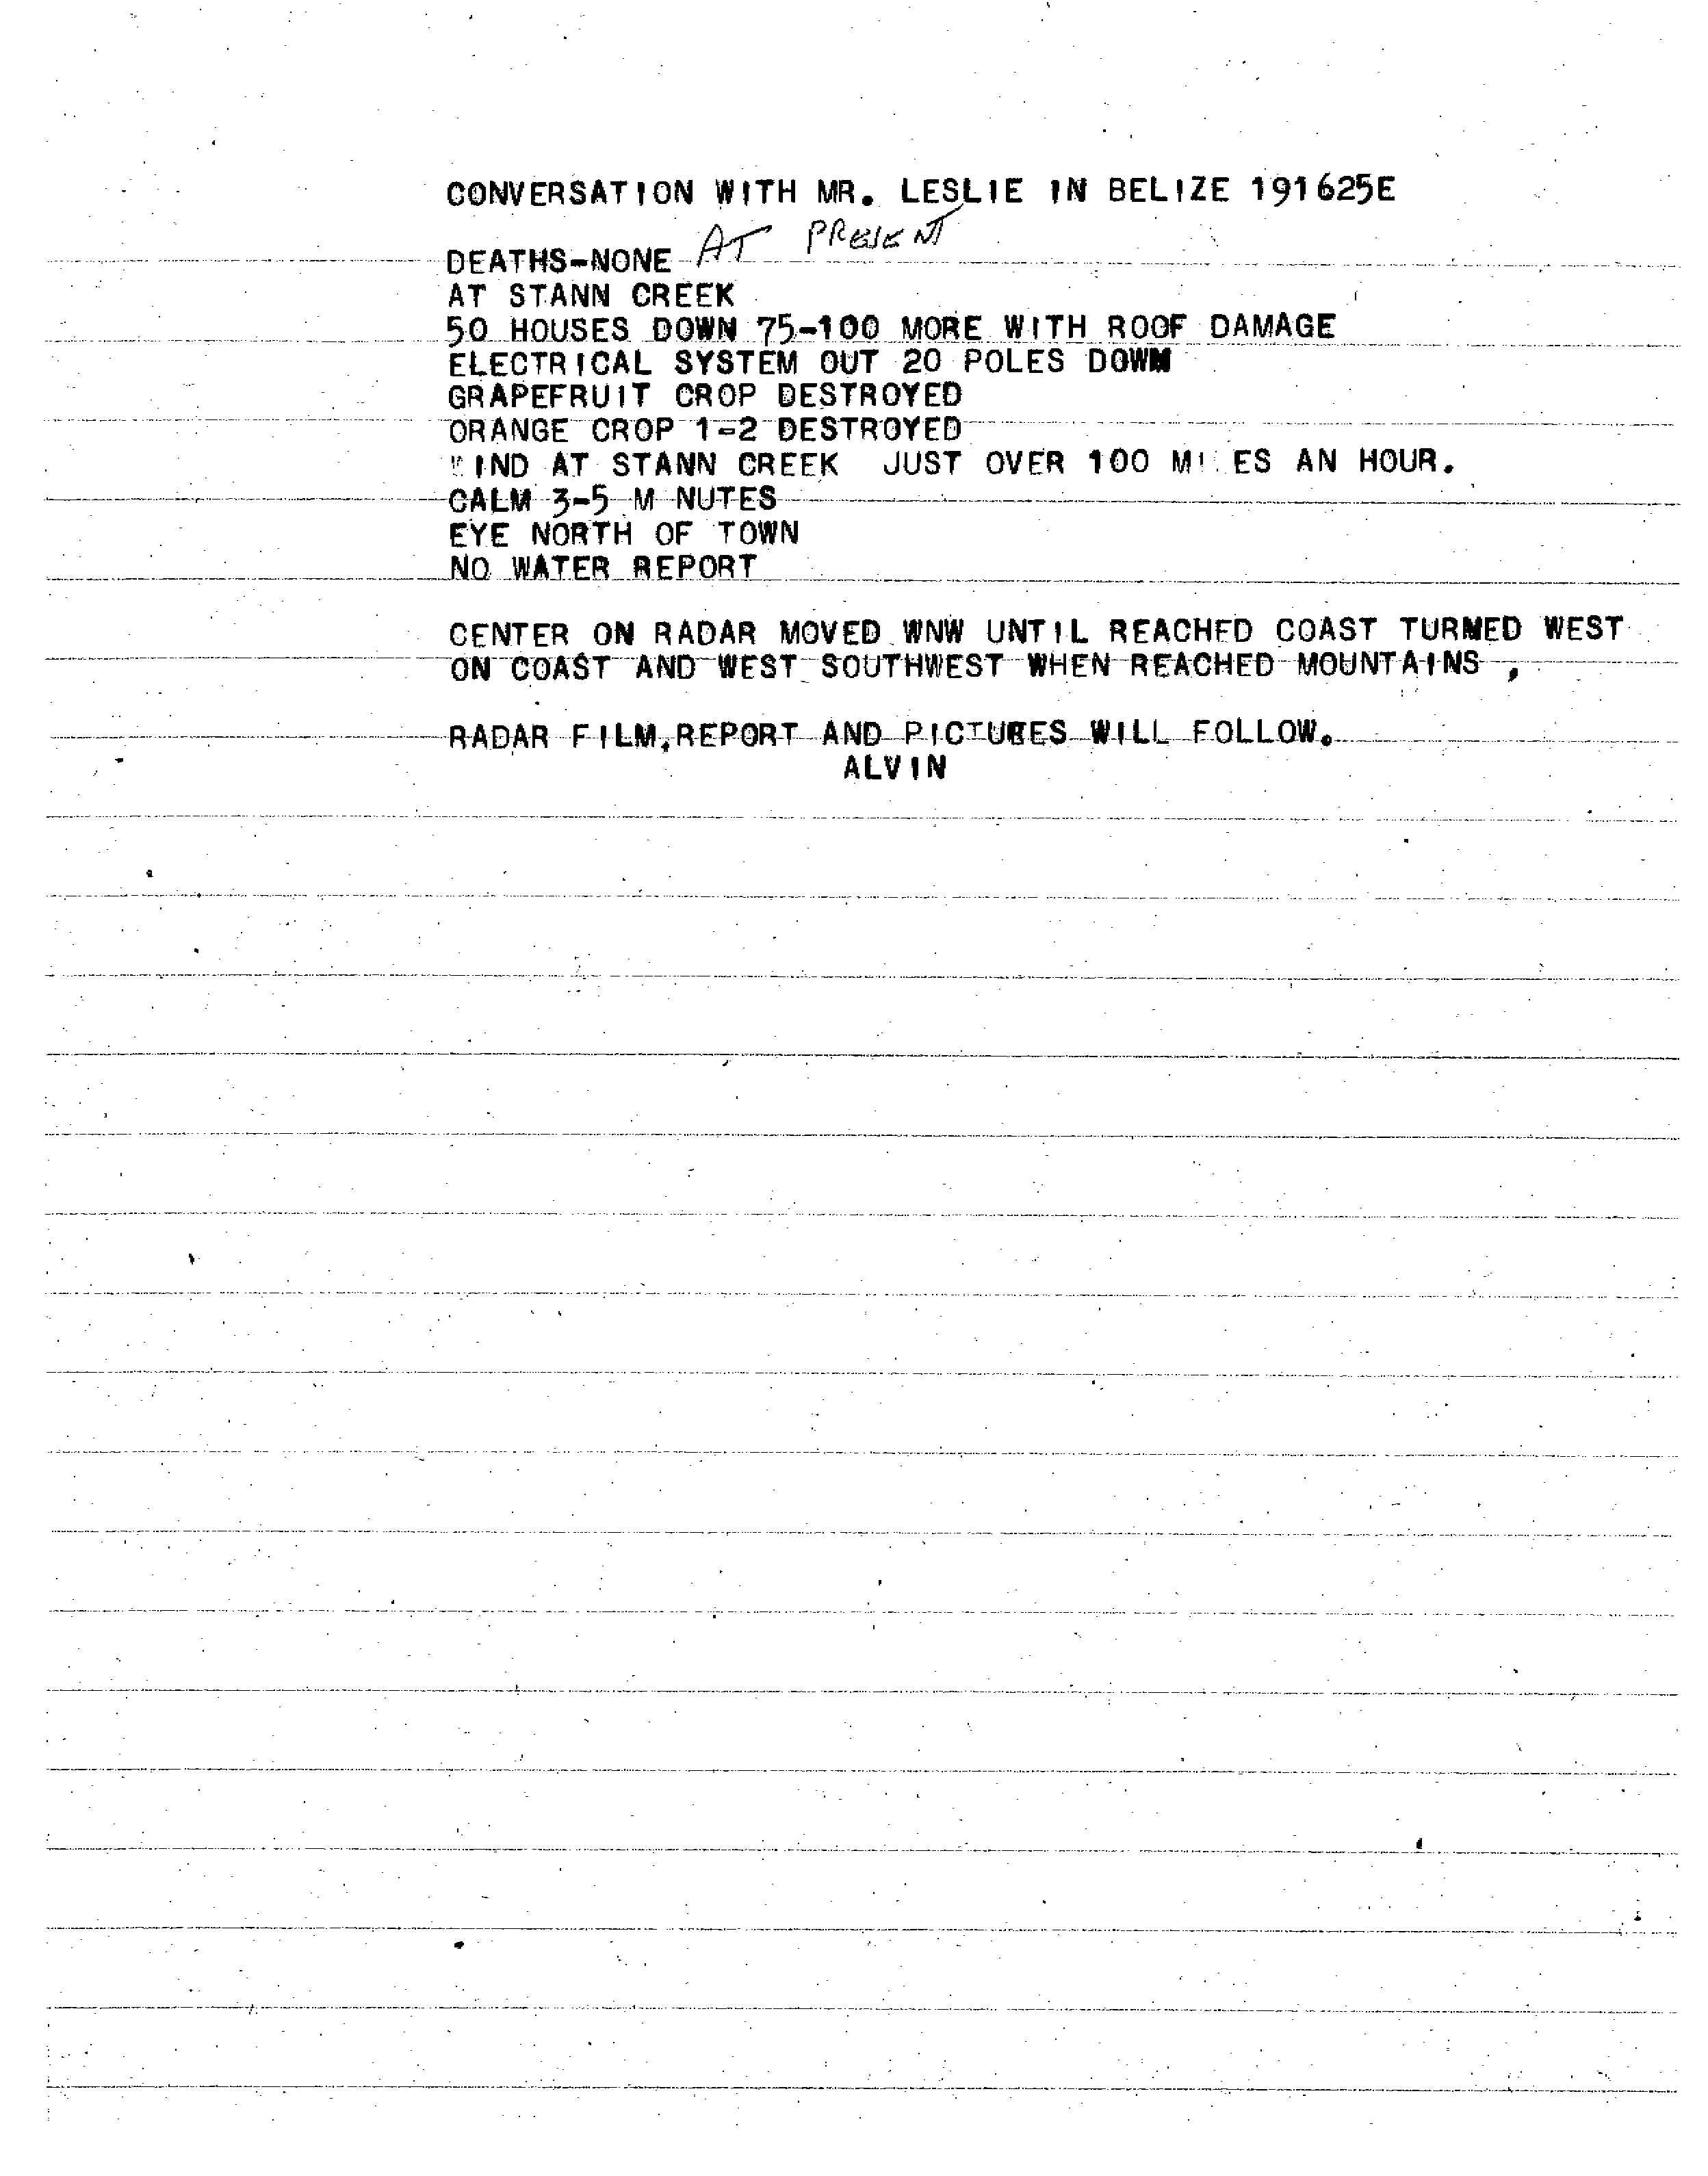
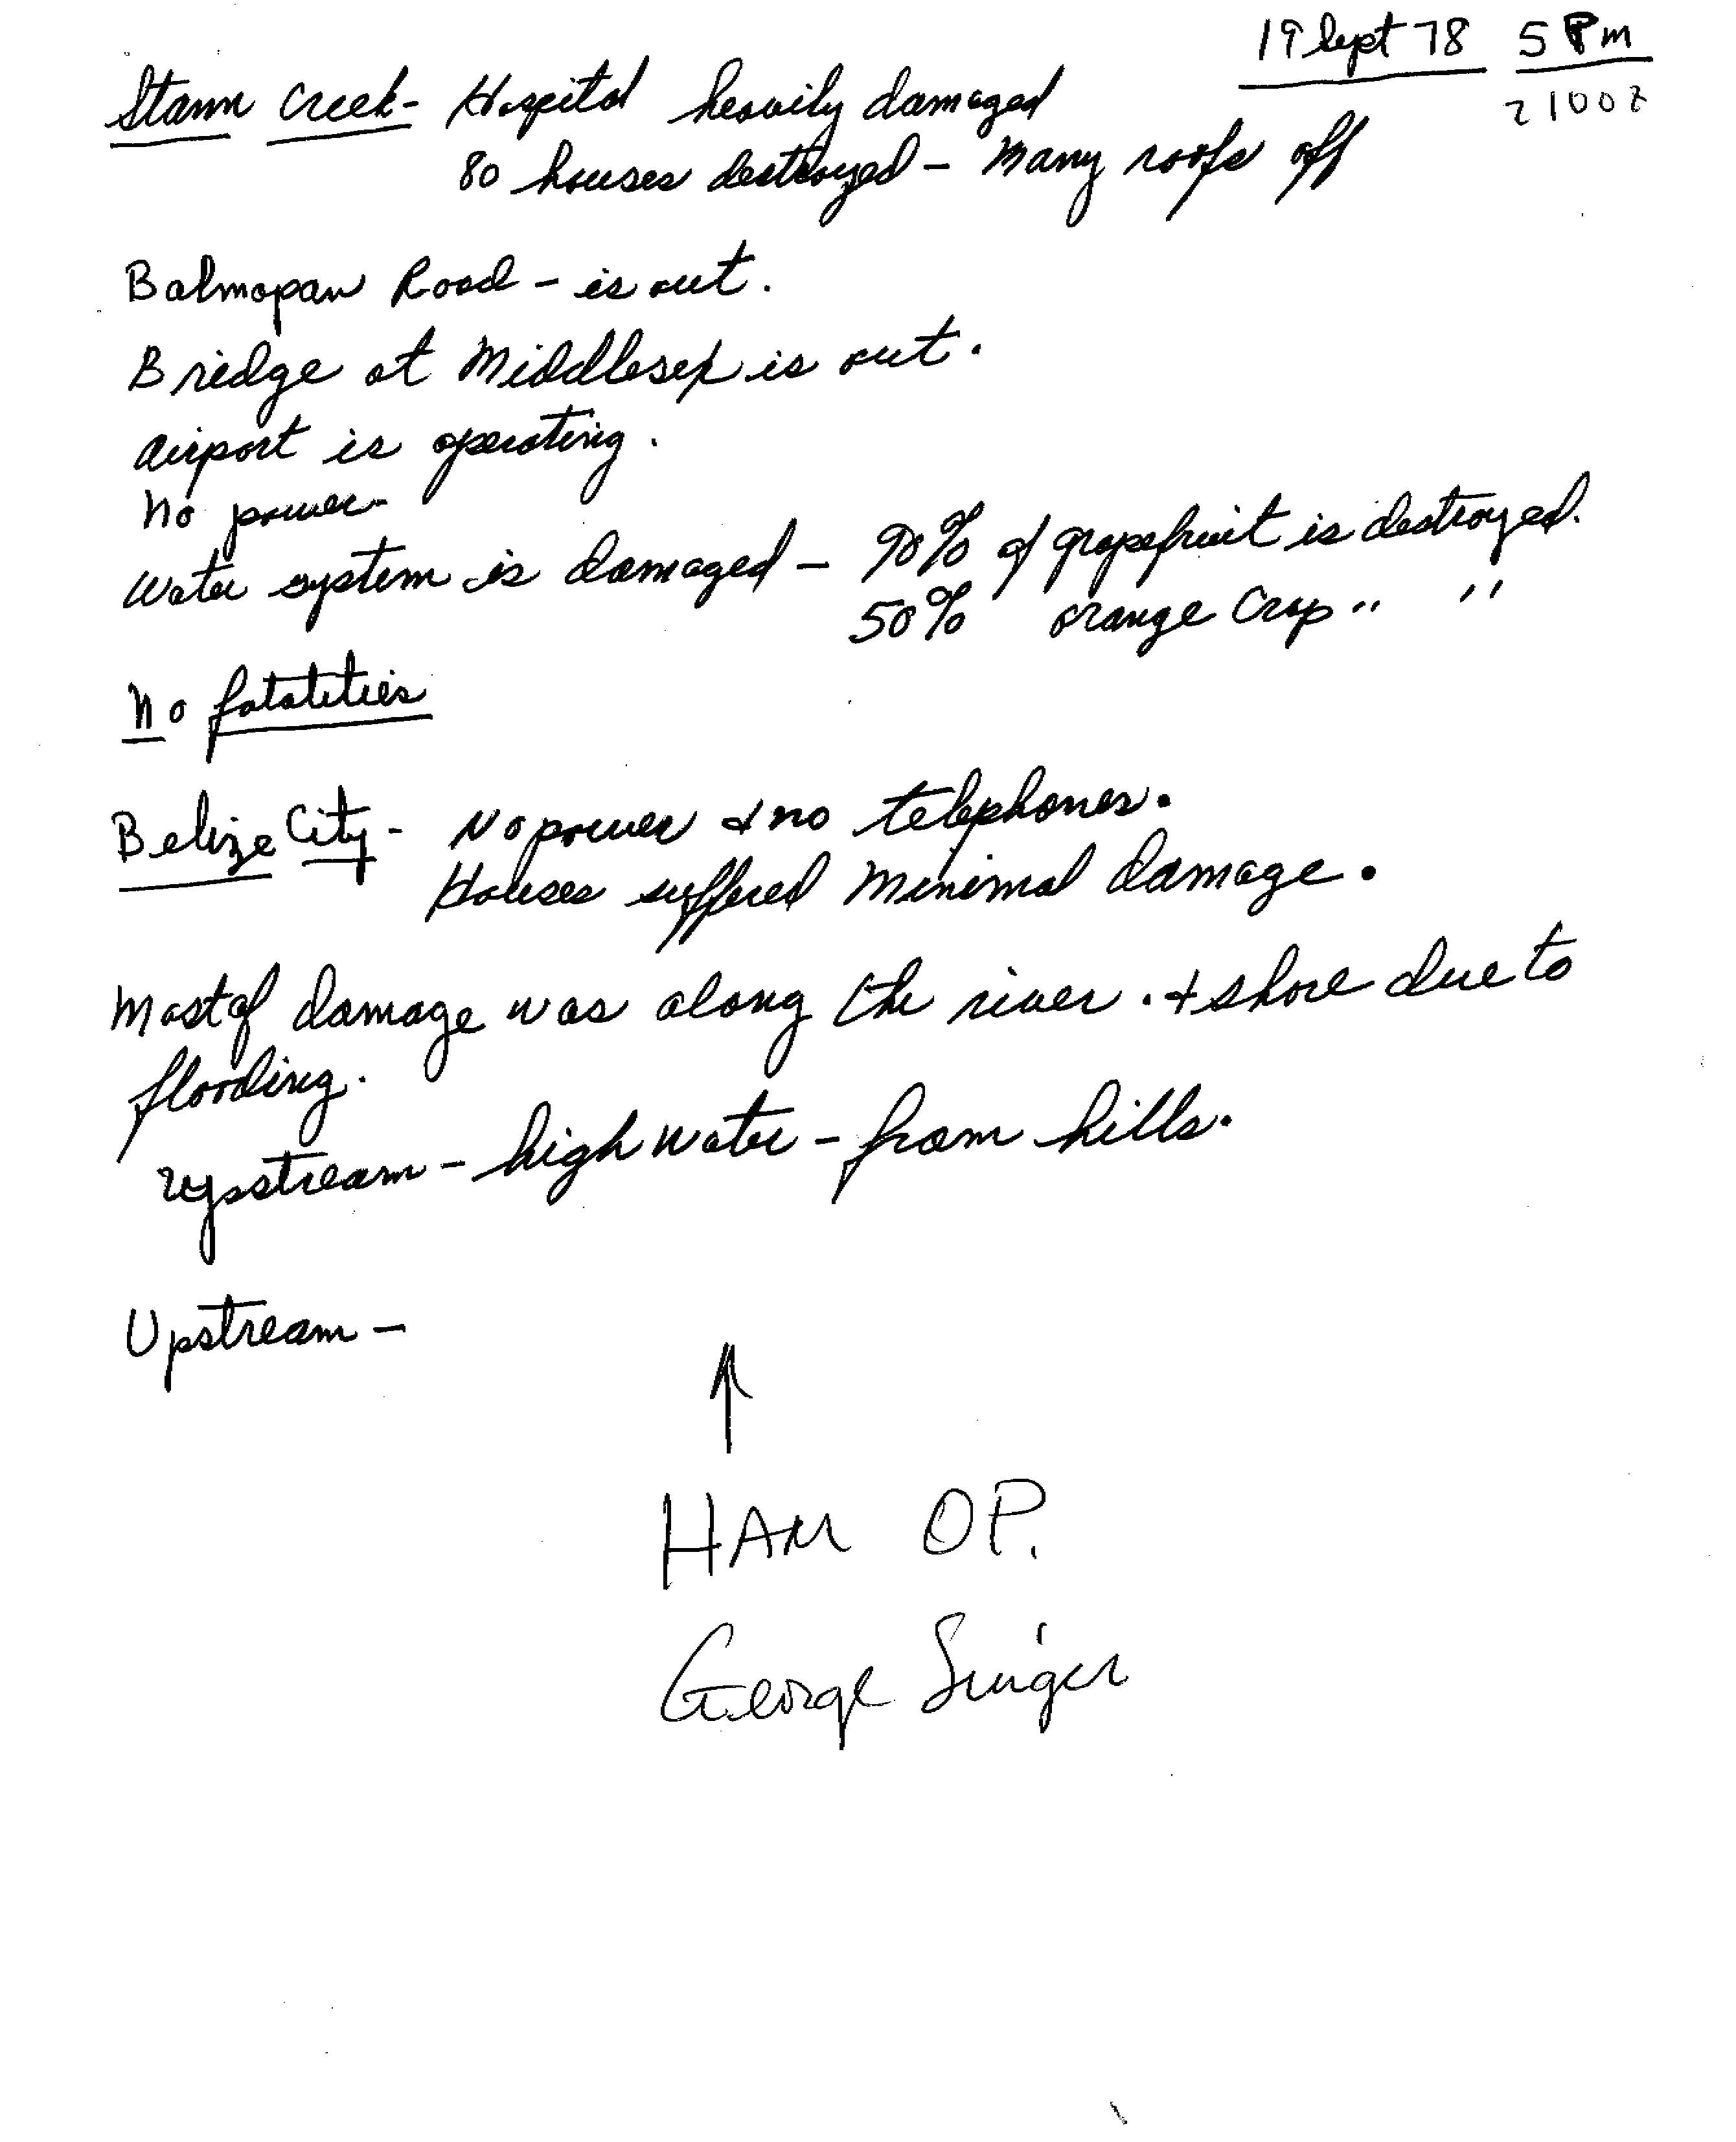
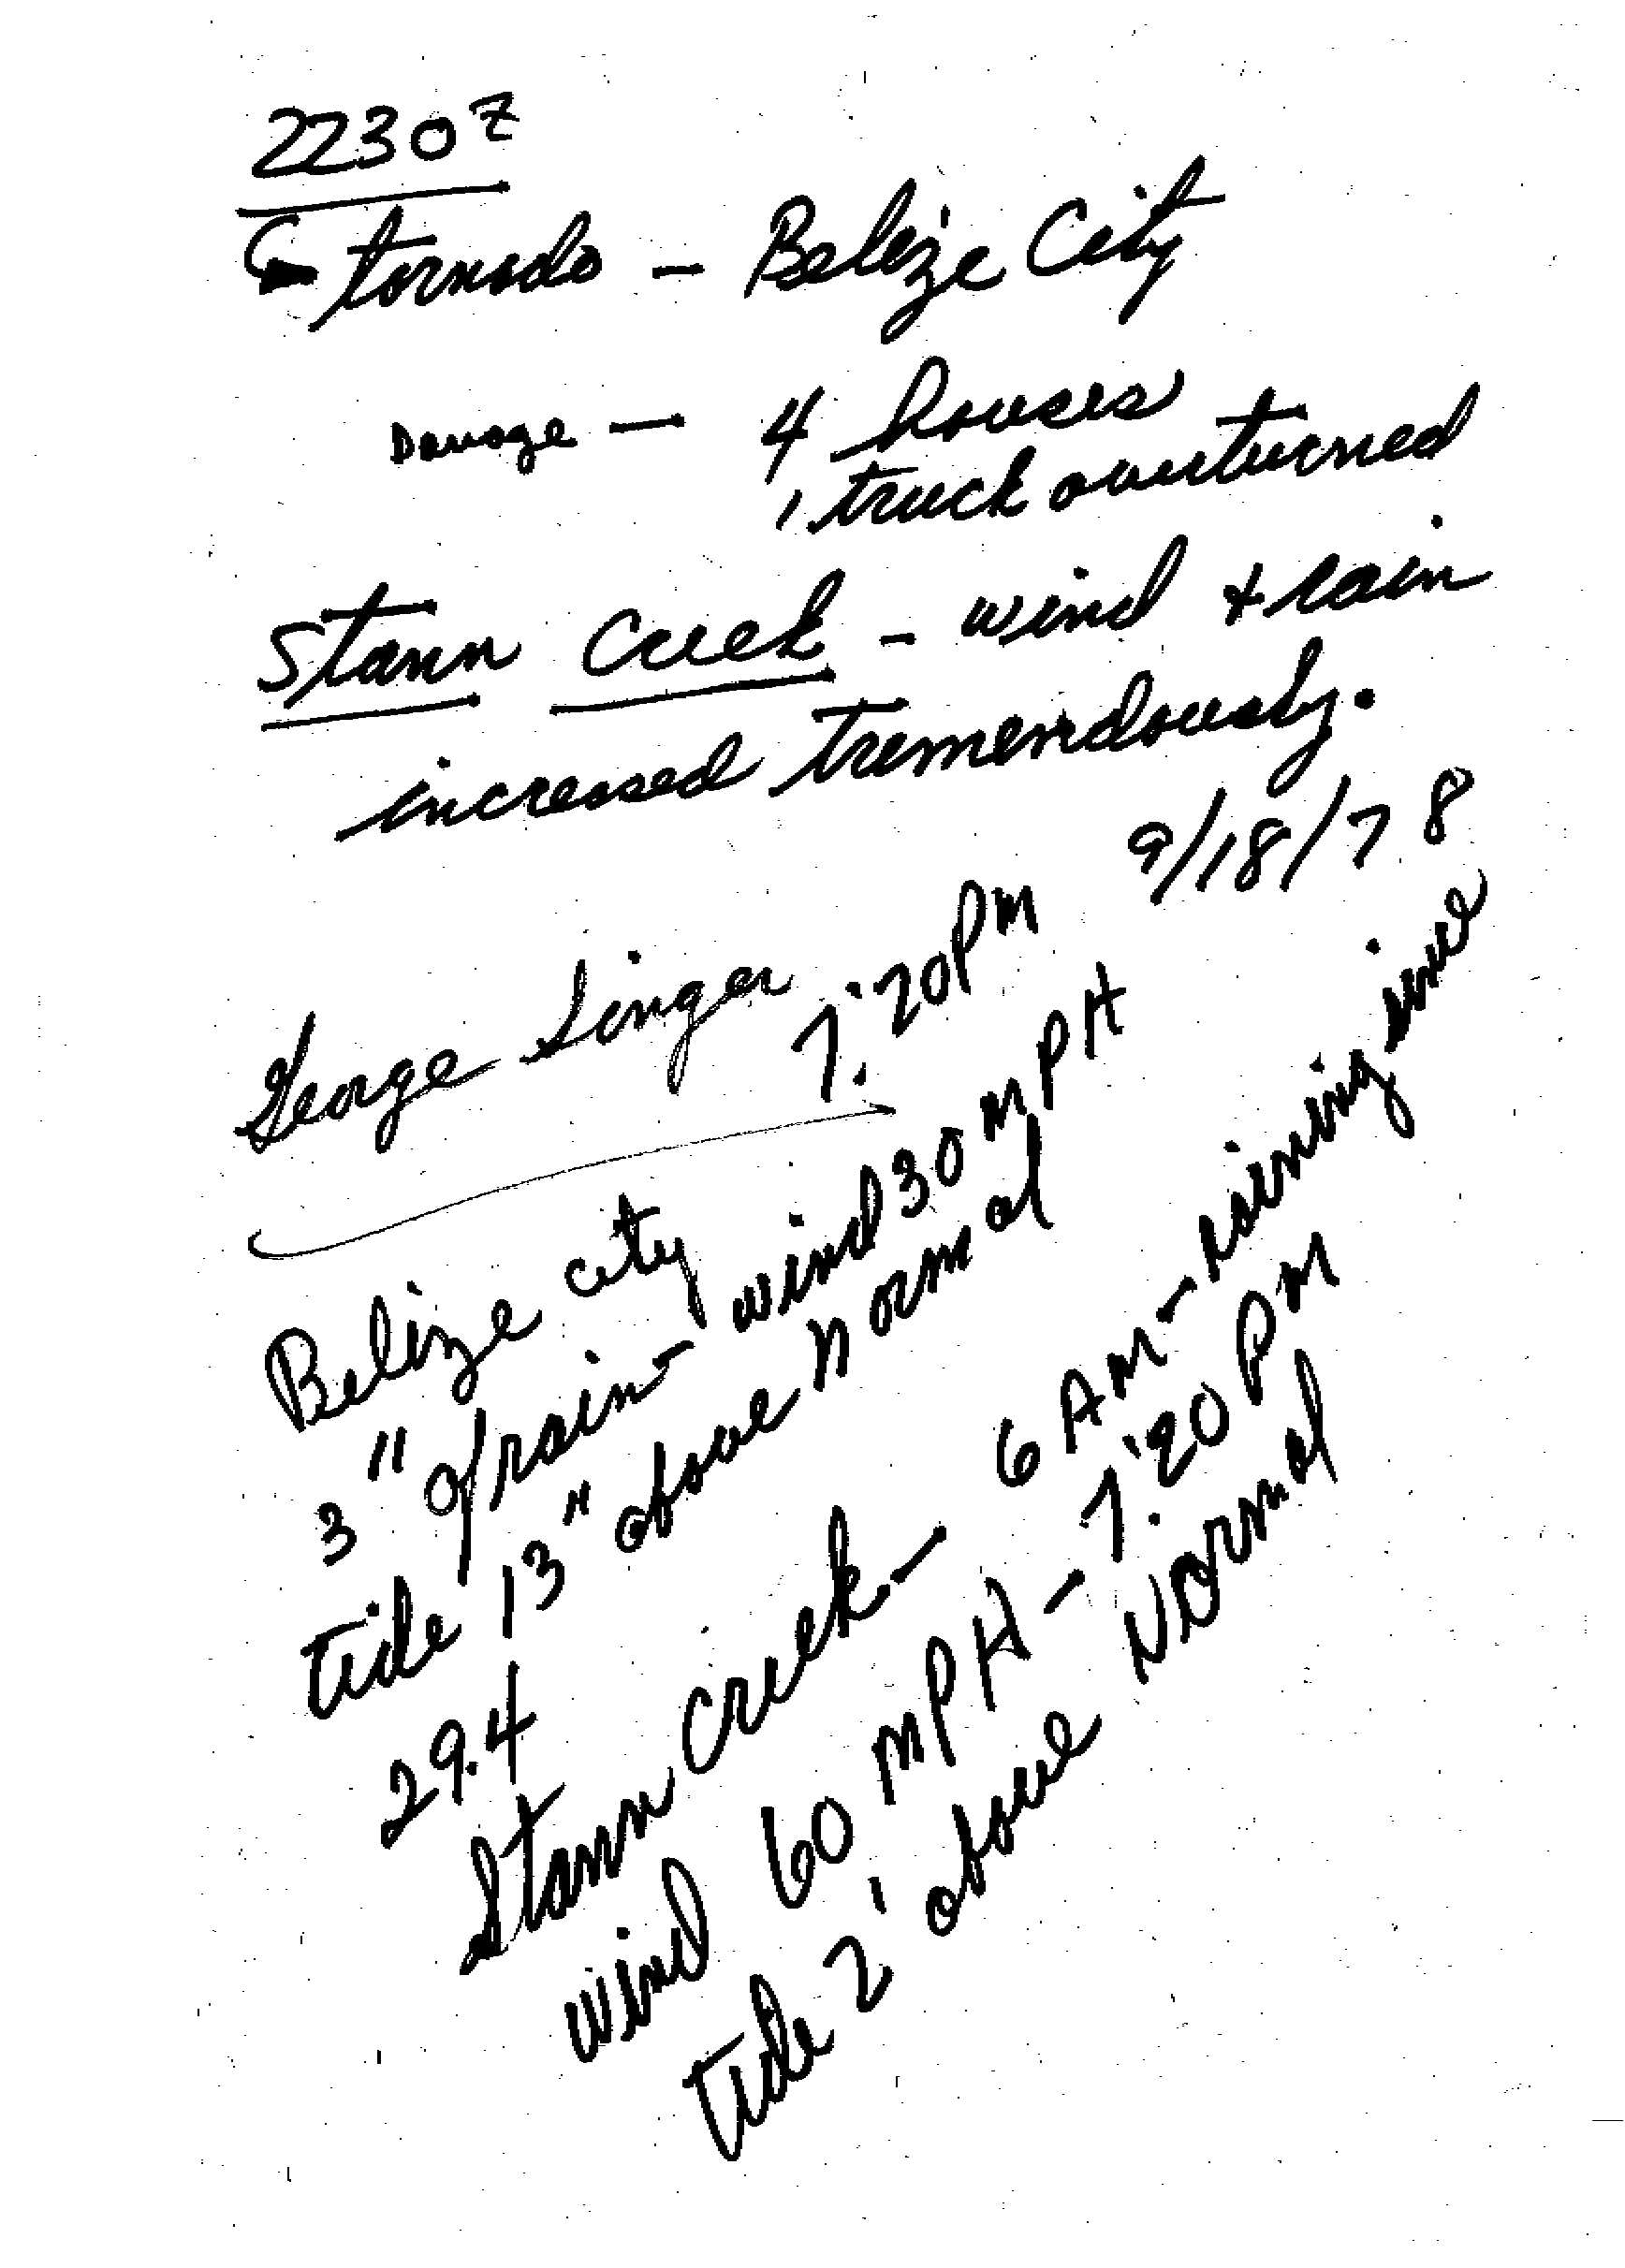
A tropical wave developed into a tropical depression near Trinidad on September 13. By the following day, the depression strengthened into Tropical Storm Greta. It headed westward to west-northwestward across the Caribbean Sea and slowly intensified, becoming a hurricane on September 16.[49] The rate of intensification increased as Greta was approaching the northwestern Caribbean Sea. Greta briefly peaked as a Category 4 hurricane with maximum sustained winds of 130 mph (210 km/h) and a minimum barometric pressure of 947 mbar (28.0 inHg), while brushing northeastern Honduras. Although the storm remained offshore, land interaction caused significant weakening. On September 19, Greta made landfall in Stann Creek District, Belize with winds of 110 mph (180 km/h).[50] The storm rapidly weakened inland over Central America, but survived its passage and eventually became Hurricane Olivia in the Eastern Pacific Ocean.[51]
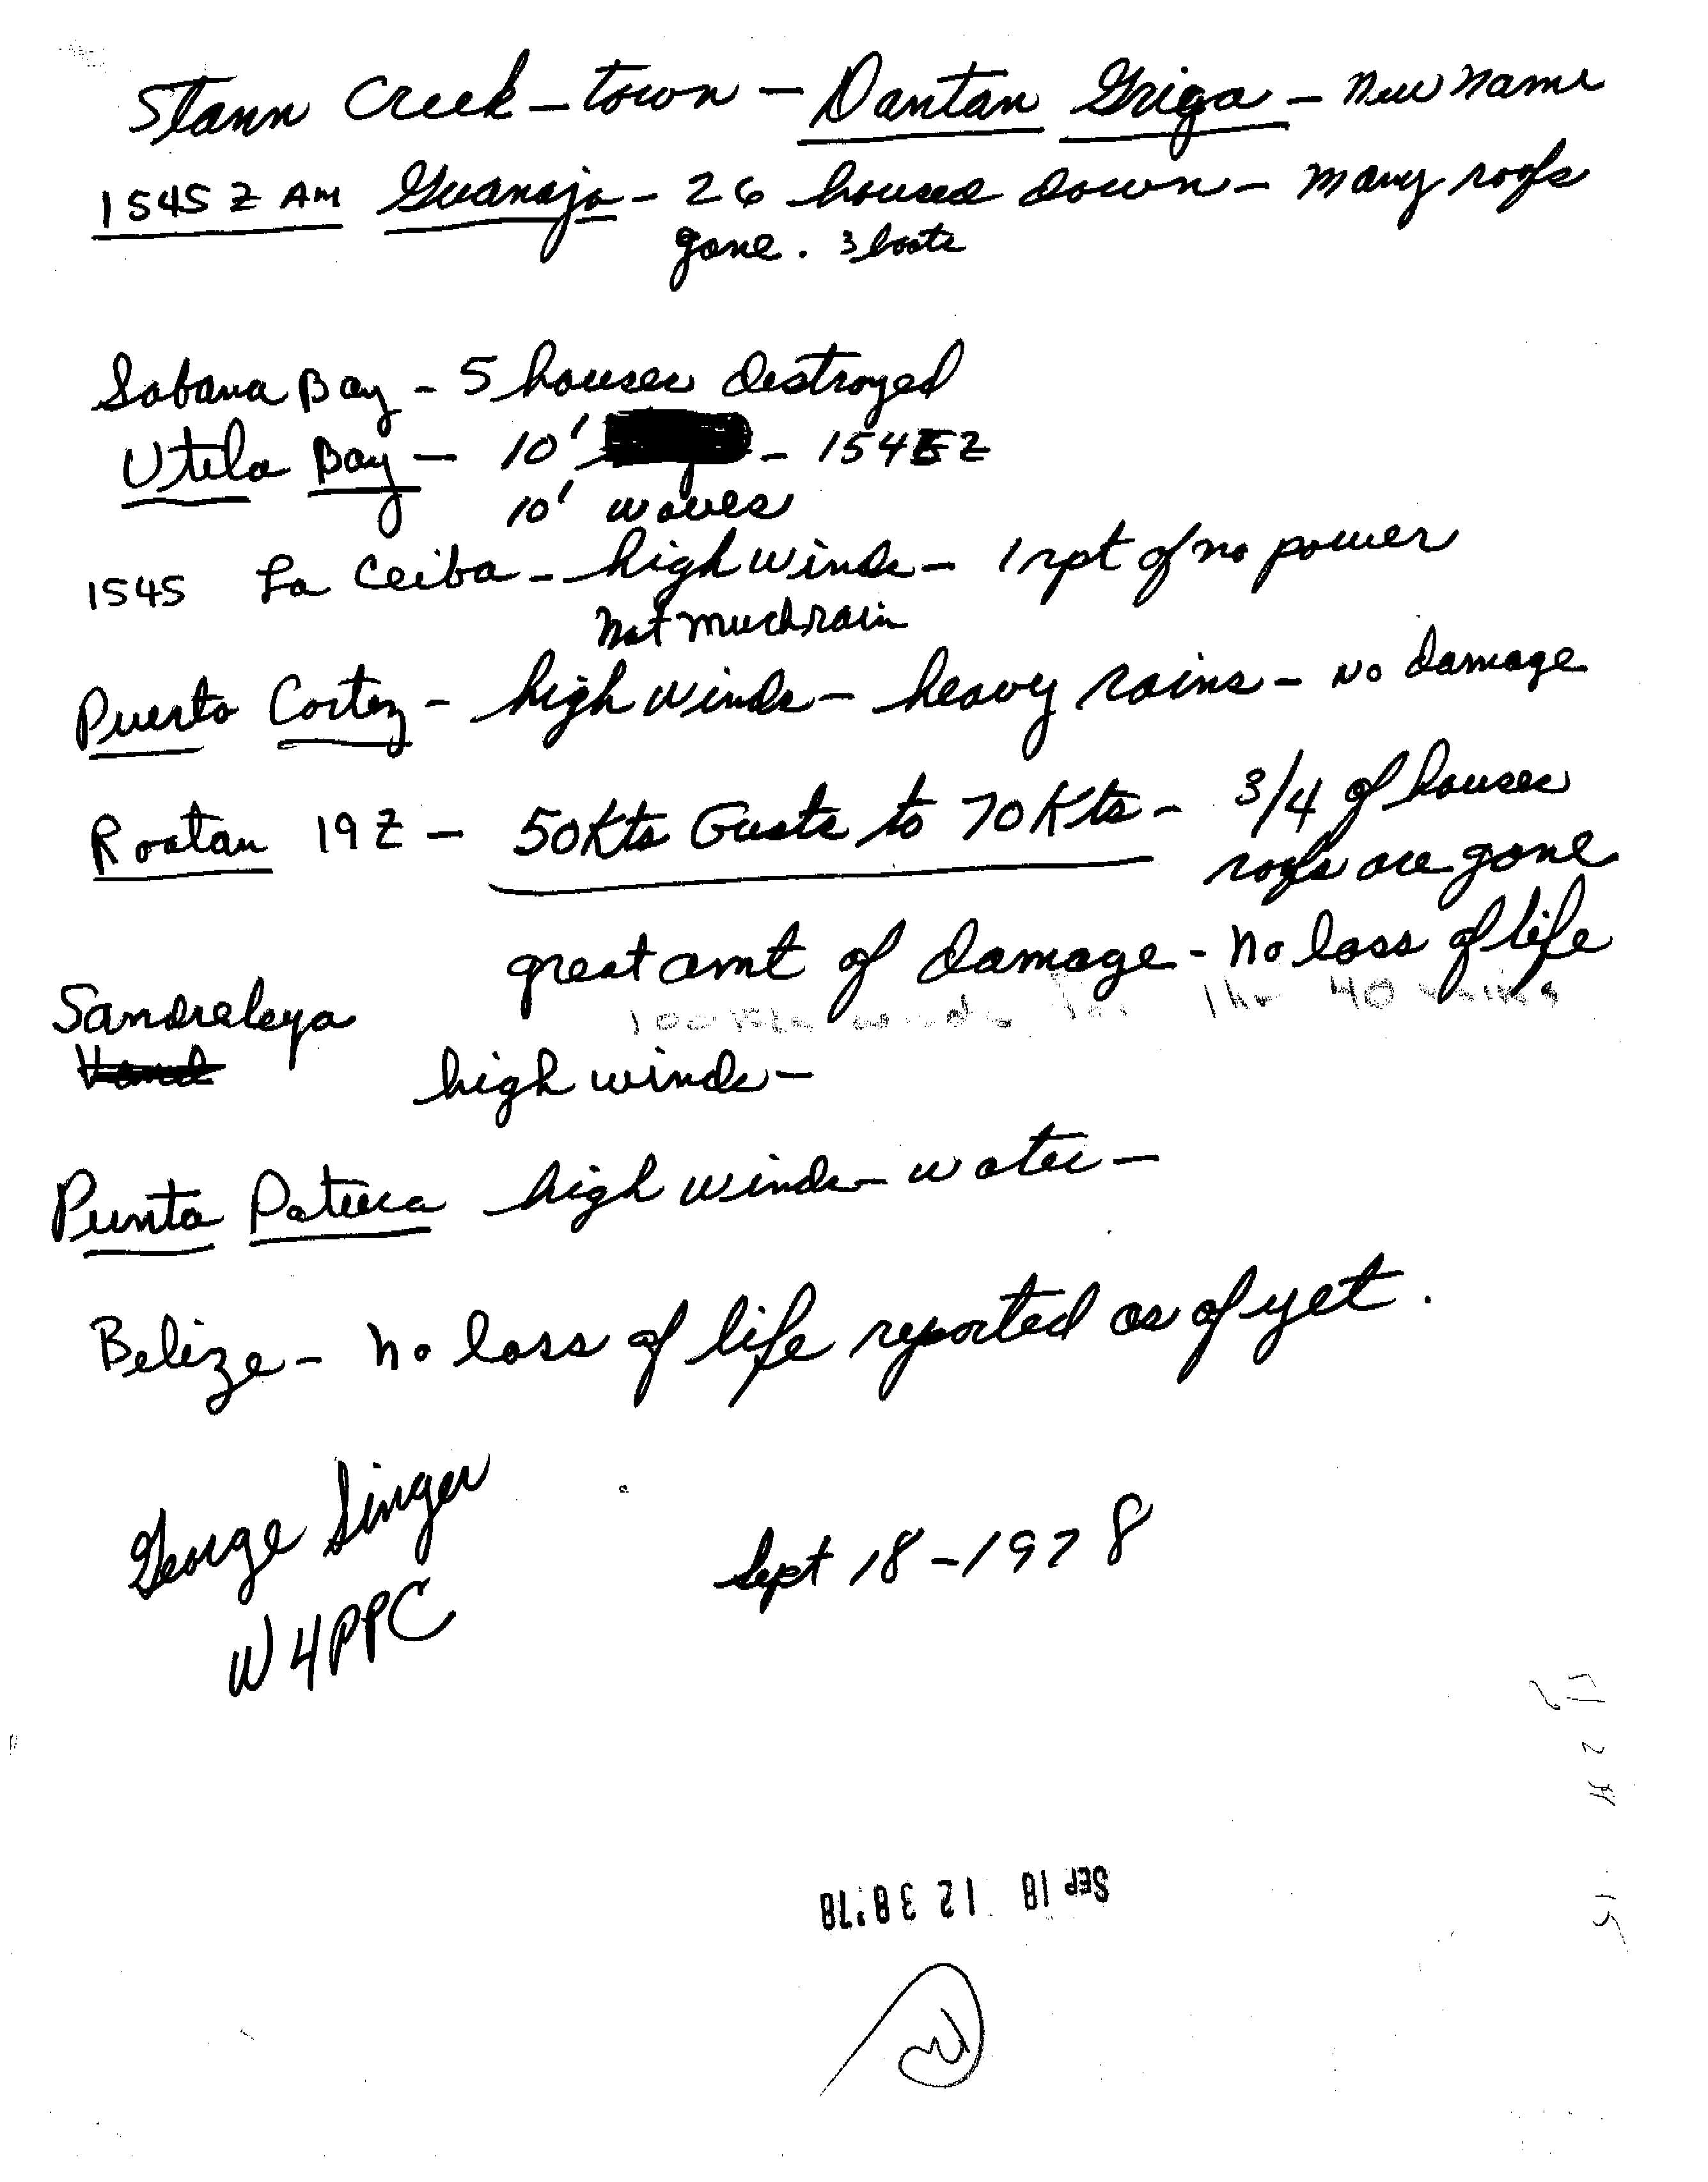
Early in its duration, Greta produced heavy rainfall in the Netherlands Antilles.[49] With a similar path to Hurricane Fifi four years prior, Greta threatened to reproduce the devastating effects of the catastrophic storm;[52] however, damage and loss of life was significantly less than feared.[51] In Honduras, about 1,200 homes were damaged, about half of which in towns along the coastline.[53] The storm damaged about 75% of the houses on Roatán along the offshore Bay Islands,[54] and there was one death in the country.[51] In the Belize Barrier Reef, Greta downed trees and produced high waves,[55] while on the mainland, there was minimal flooding despite a high storm surge.[51] In Dangriga where it made landfall, the hurricane damaged or destroyed 125 houses and the primary hospital.[56][57] In Belize City, a tornado flipped over a truck and damaged four houses.[58] Damage in Belize was estimated at $25 million, and there were four deaths.[51]
Tropical Storm Hope
| Tropical storm (SSHWS) | |||
|---|---|---|---|
| |||
| Duration | September 12 – September 21 | ||
| Peak intensity | 65 mph (100 km/h) (1-min) 987 mbar (hPa) | ||

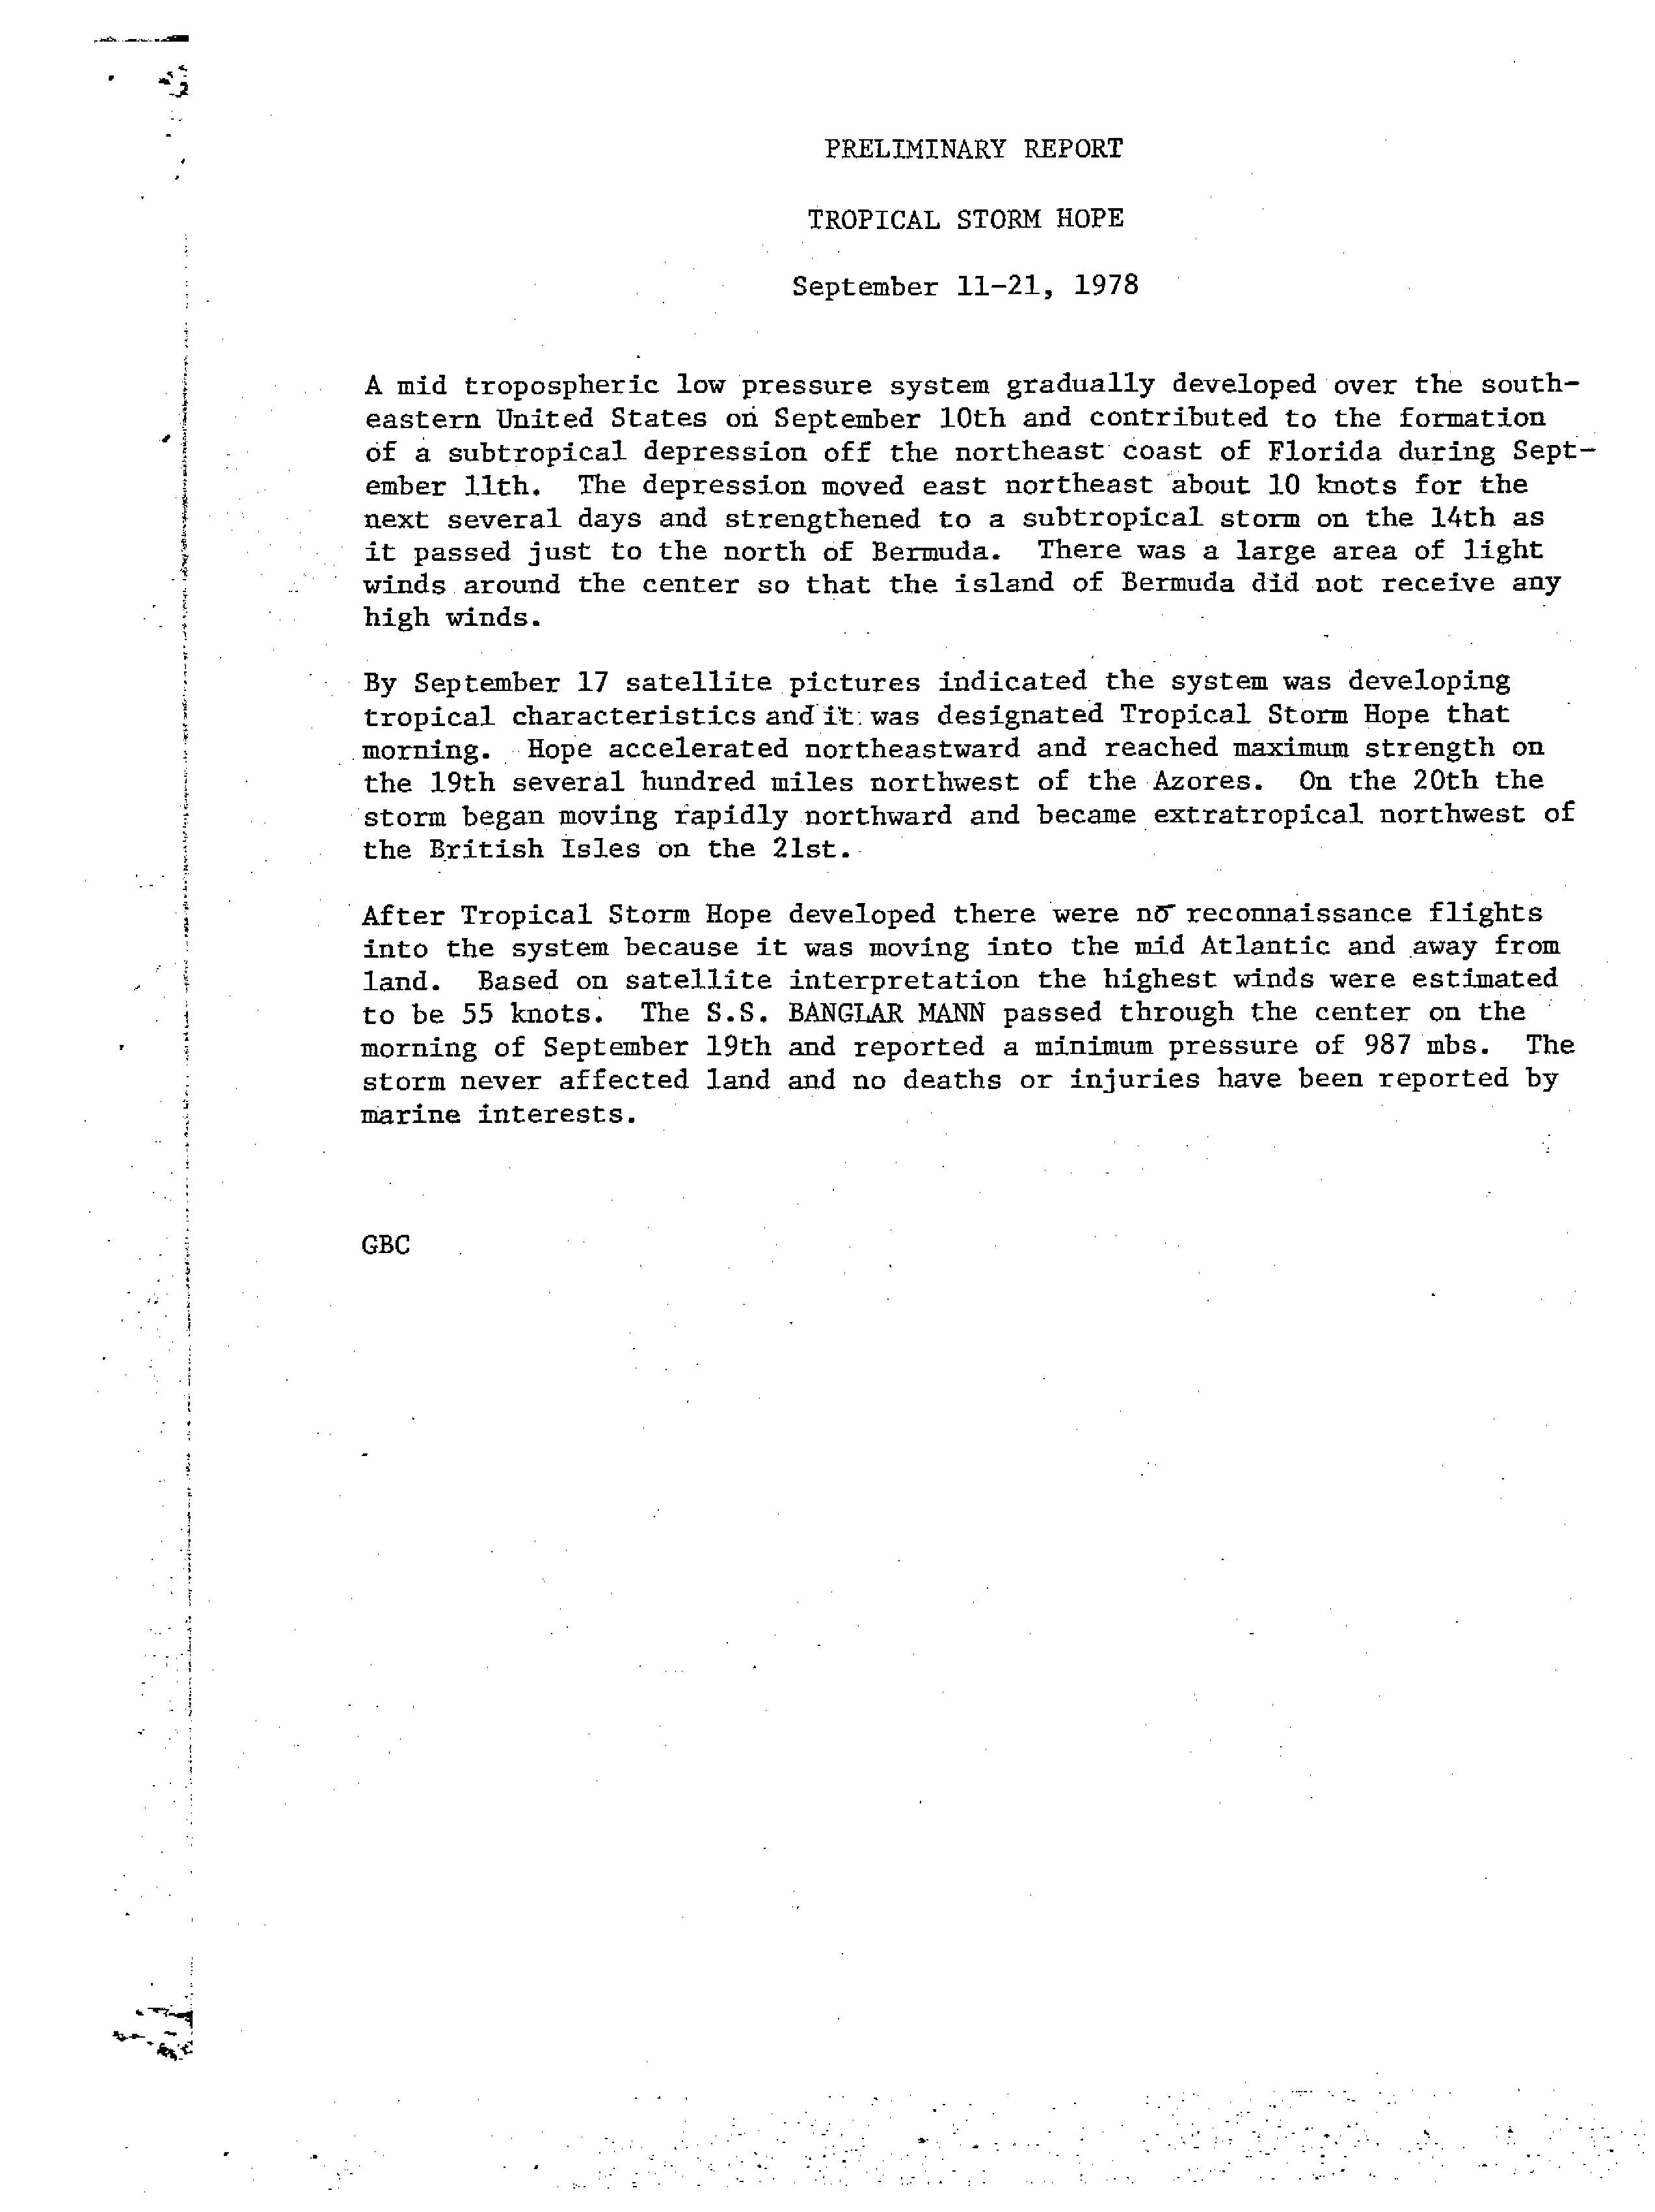
A mid-tropospheric low-pressure area developed over the Southeastern United States on September 10. The system developed into a subtropical depression early on September 12, while located about 75 mi (121 km) east of St. Augustine, Florida. Over the next few days, the depression tracked east-northeastward to eastward. While strengthening into a subtropical storm on September 15, it passed just north of Bermuda,[59] but produced only 1.07 in (27 mm) of rain on the island.[19] The storm then made a brief dip to the east-southeast, before resuming its east-northeastward course on September 16. Beginning on the following day, satellite imagery indicated that the system was acquiring tropical characteristics. As a result, it was reclassified as Tropical Storm Hope at 0600 UTC on September 17.[59]
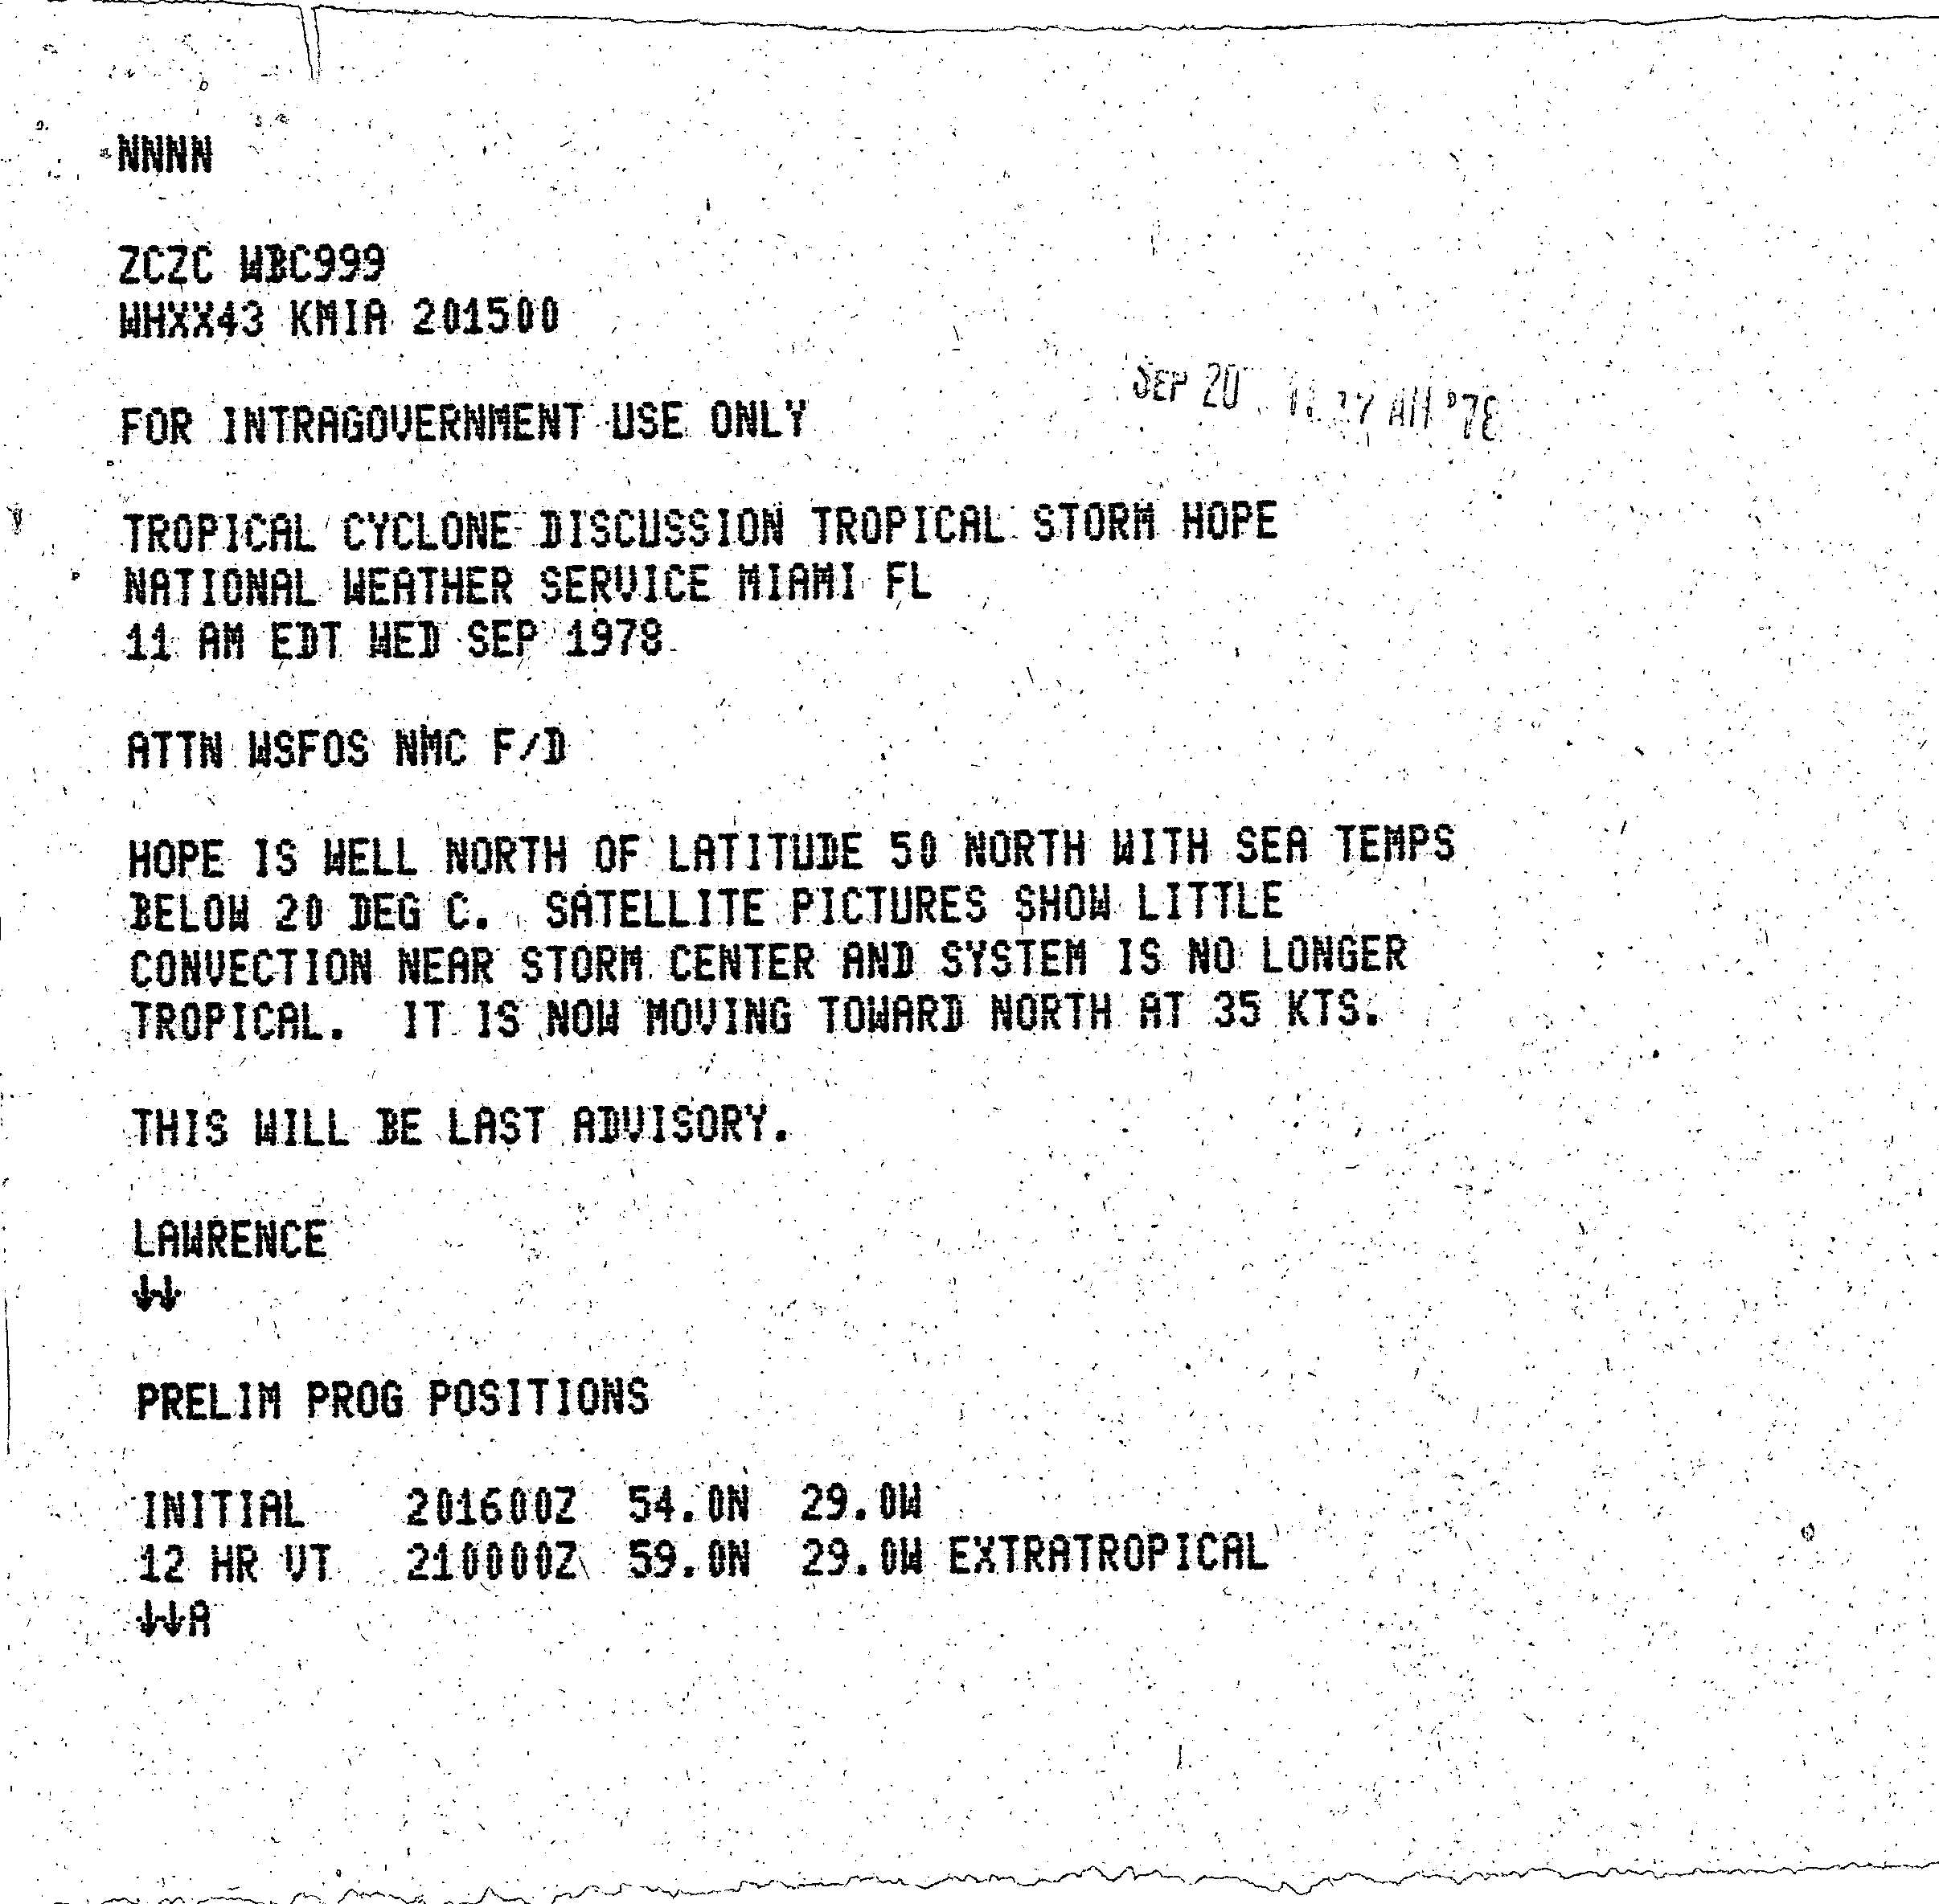
Because Hope remained out of range of reconnaissance aircraft flights, the National Hurricane Center relied on ships and satellite estimates. After becoming a tropical cyclone, Hope began to accelerate while slowly intensifying. Satellite estimates at 1200 UTC on September 19 indicated that the storm attained its peak intensity with maximum sustained winds of 65 mph (105 km/h) and a minimum pressure of 987 mbar (29.1 inHg), recorded by the S.S. Banglar Mann. While located hundreds of miles north of the Azores on September 20, the storm turned northward[59] and began crossing into sea surface temperatures of 68 °F (20 °C).[60] By 1200 UTC on September 21, Hope transitioned into an extratropical cyclone[59] and was absorbed by another extratropical storm while situated about 220 mi (350 km) south of Reykjavík, Iceland.[60]
Tropical Storm Irma
| Tropical storm (SSHWS) | |||
|---|---|---|---|
| |||
| Duration | October 2 – October 5 | ||
| Peak intensity | 50 mph (85 km/h) (1-min) 998 mbar (hPa) | ||

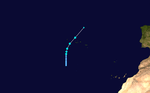
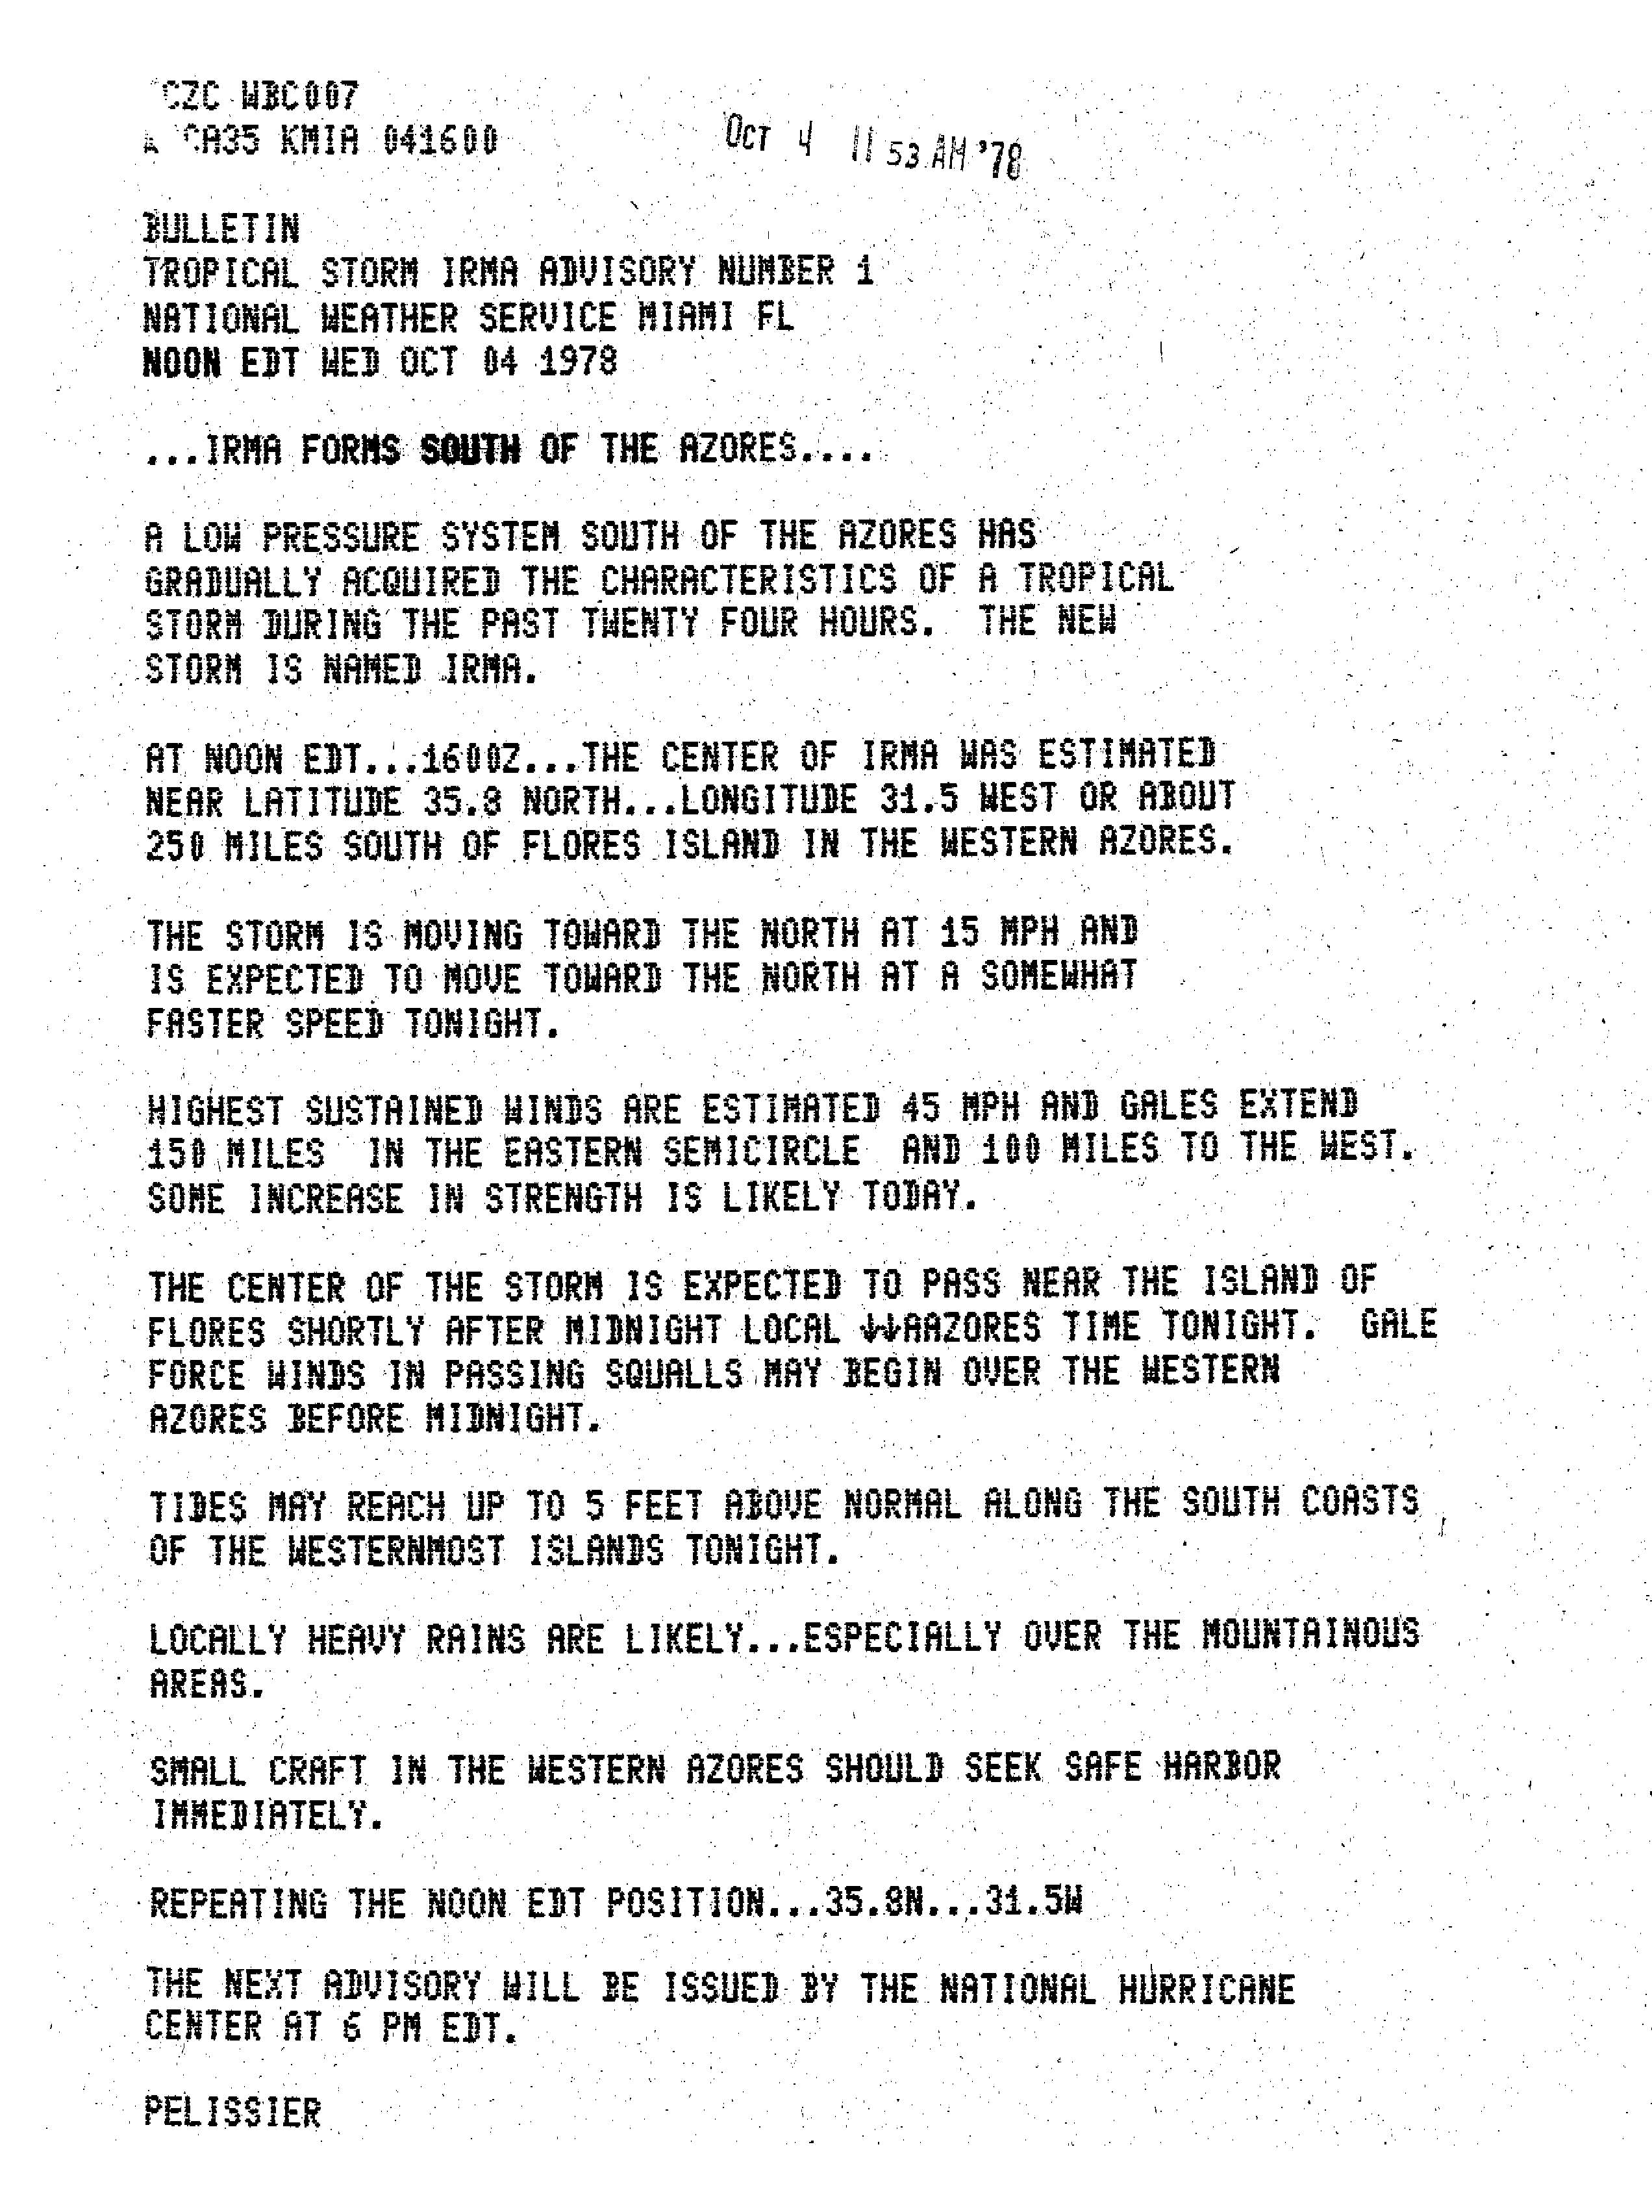
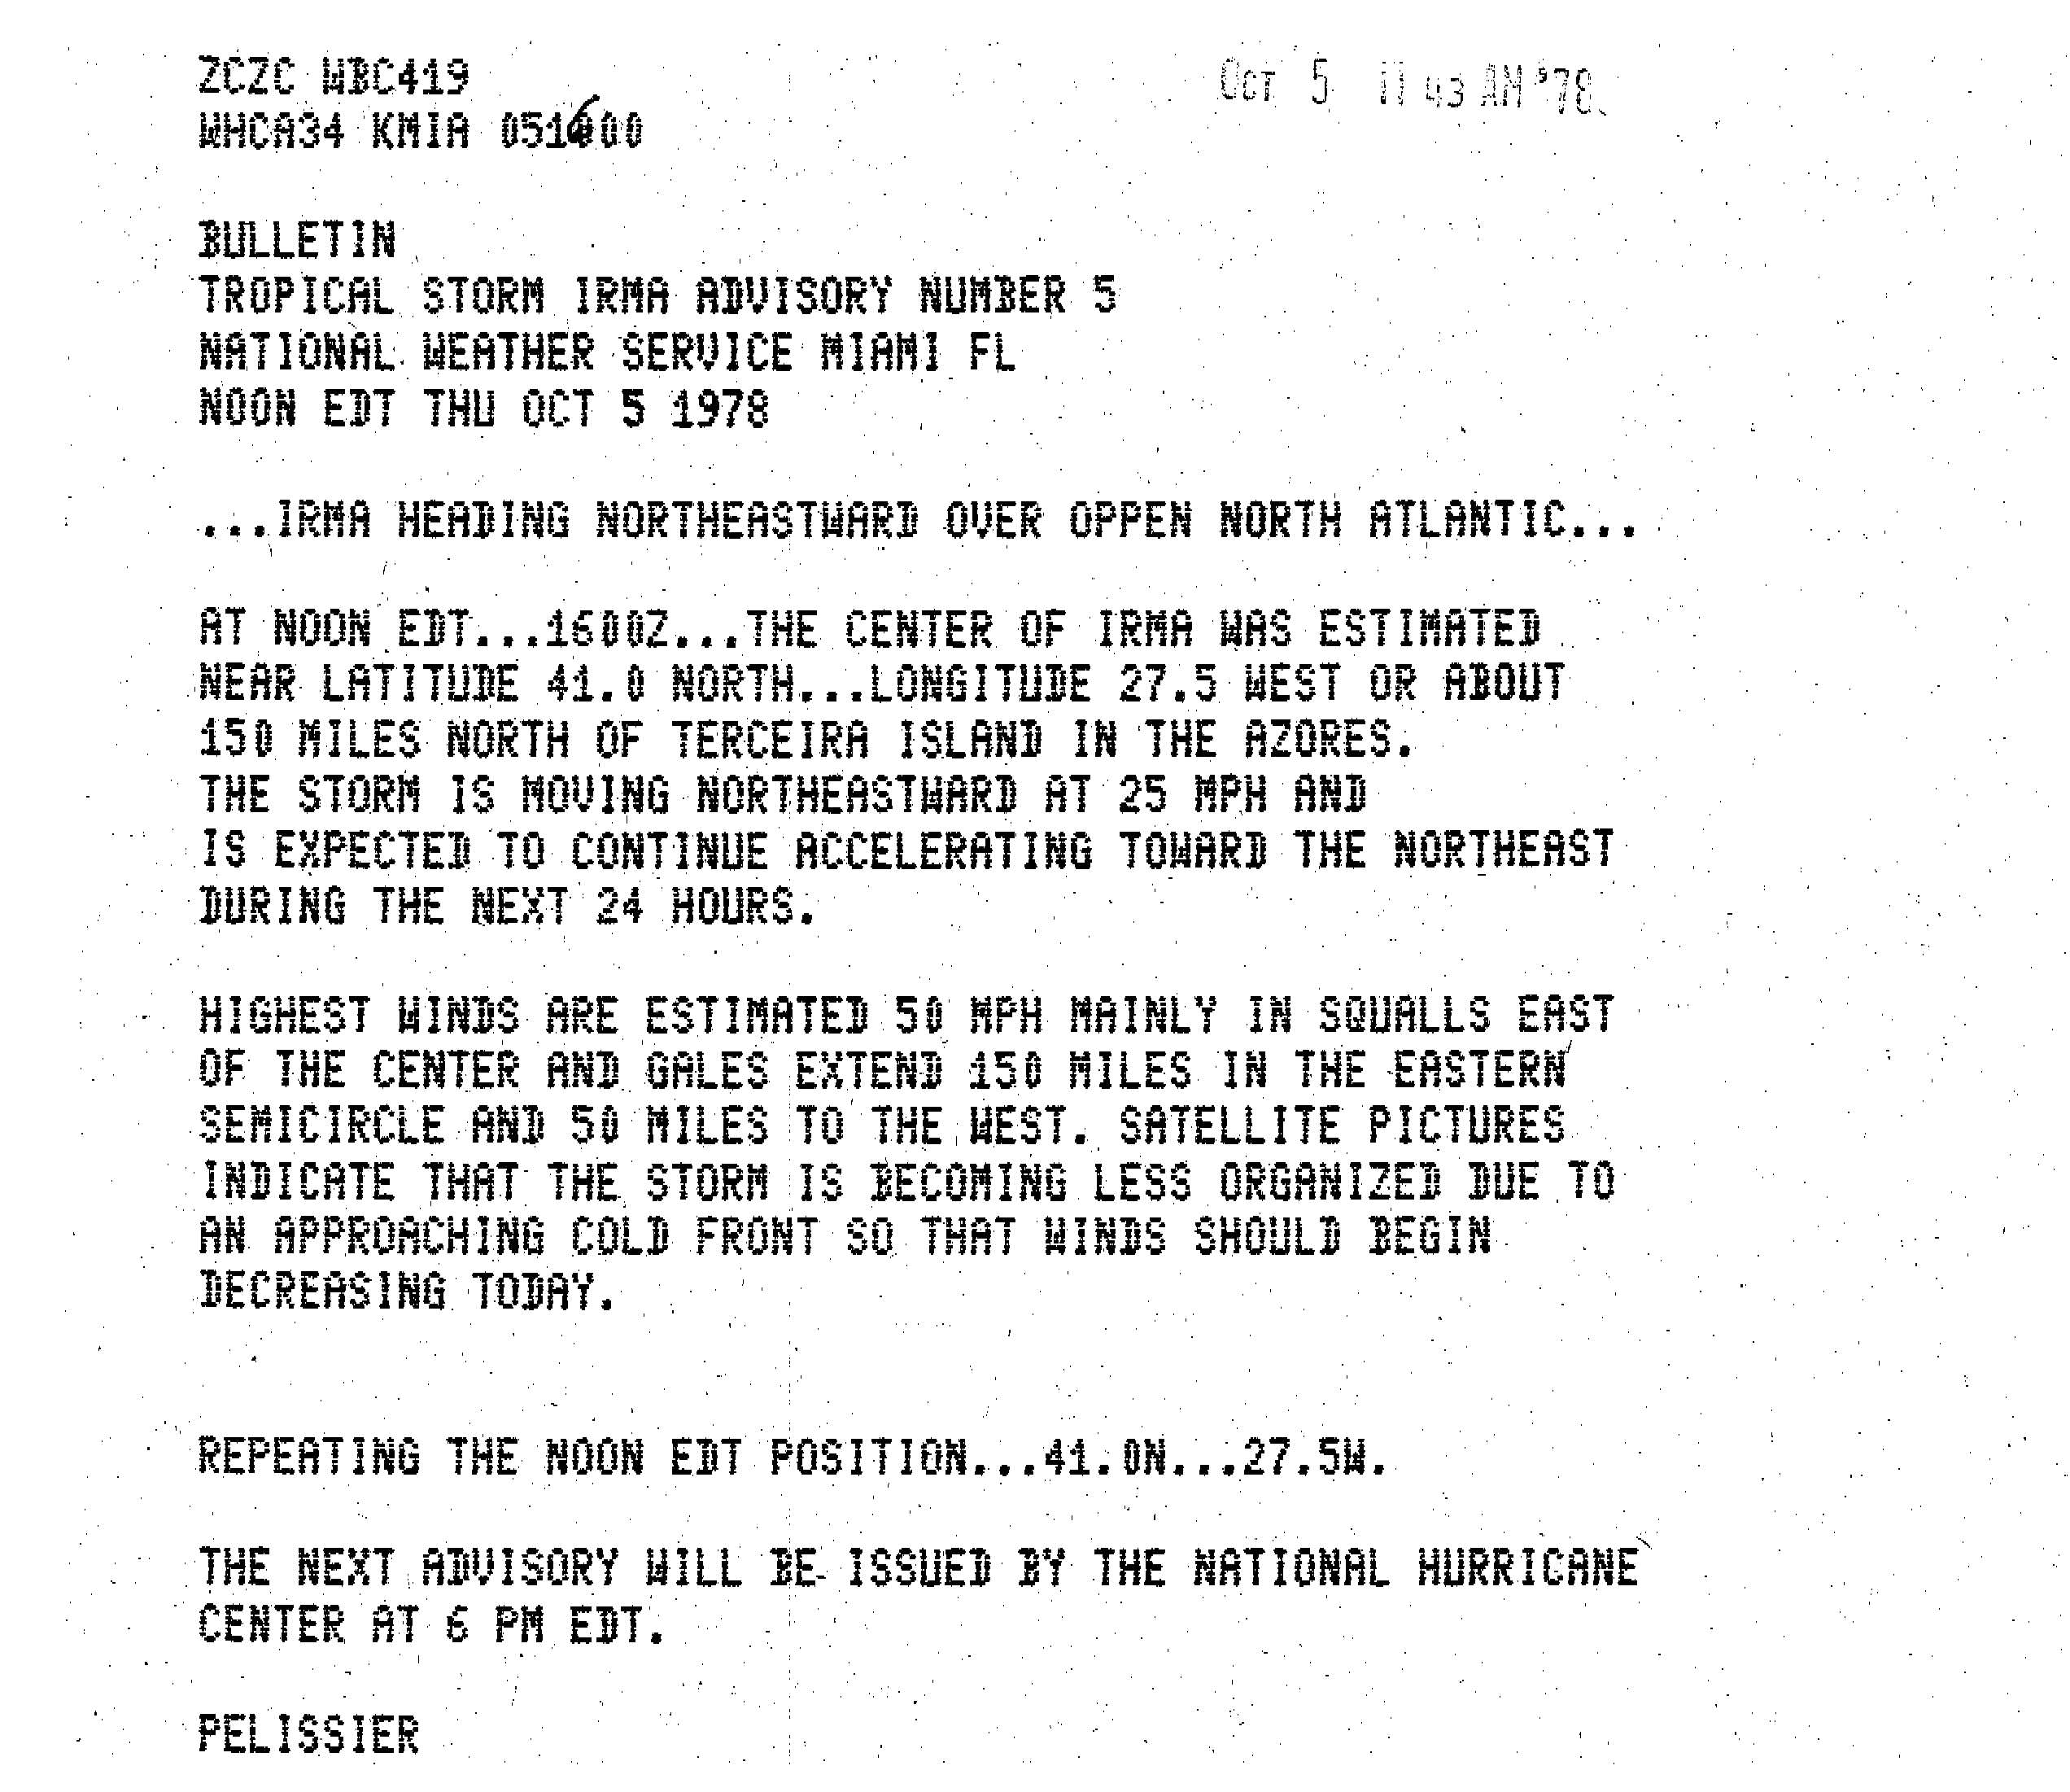
The origins of Tropical Storm Irma were from a subtropical depression that formed about 500 mi (800 km) south of the Azores on October 2. During the next two days, thunderstorm activity gradually increased around the circulation center as the storm drifted northward. On October 2, the storm had taken the appearance of a tropical storm on satellite photographs, and upper-level anticyclonic flow over the center of the storm was evident on satellite time-lapse movies. By the afternoon of October 4, the system had acquired the characteristics of a tropical storm and was named Irma; gale-force winds extended 150 mi (240 km) from the center of circulation.[61][62]
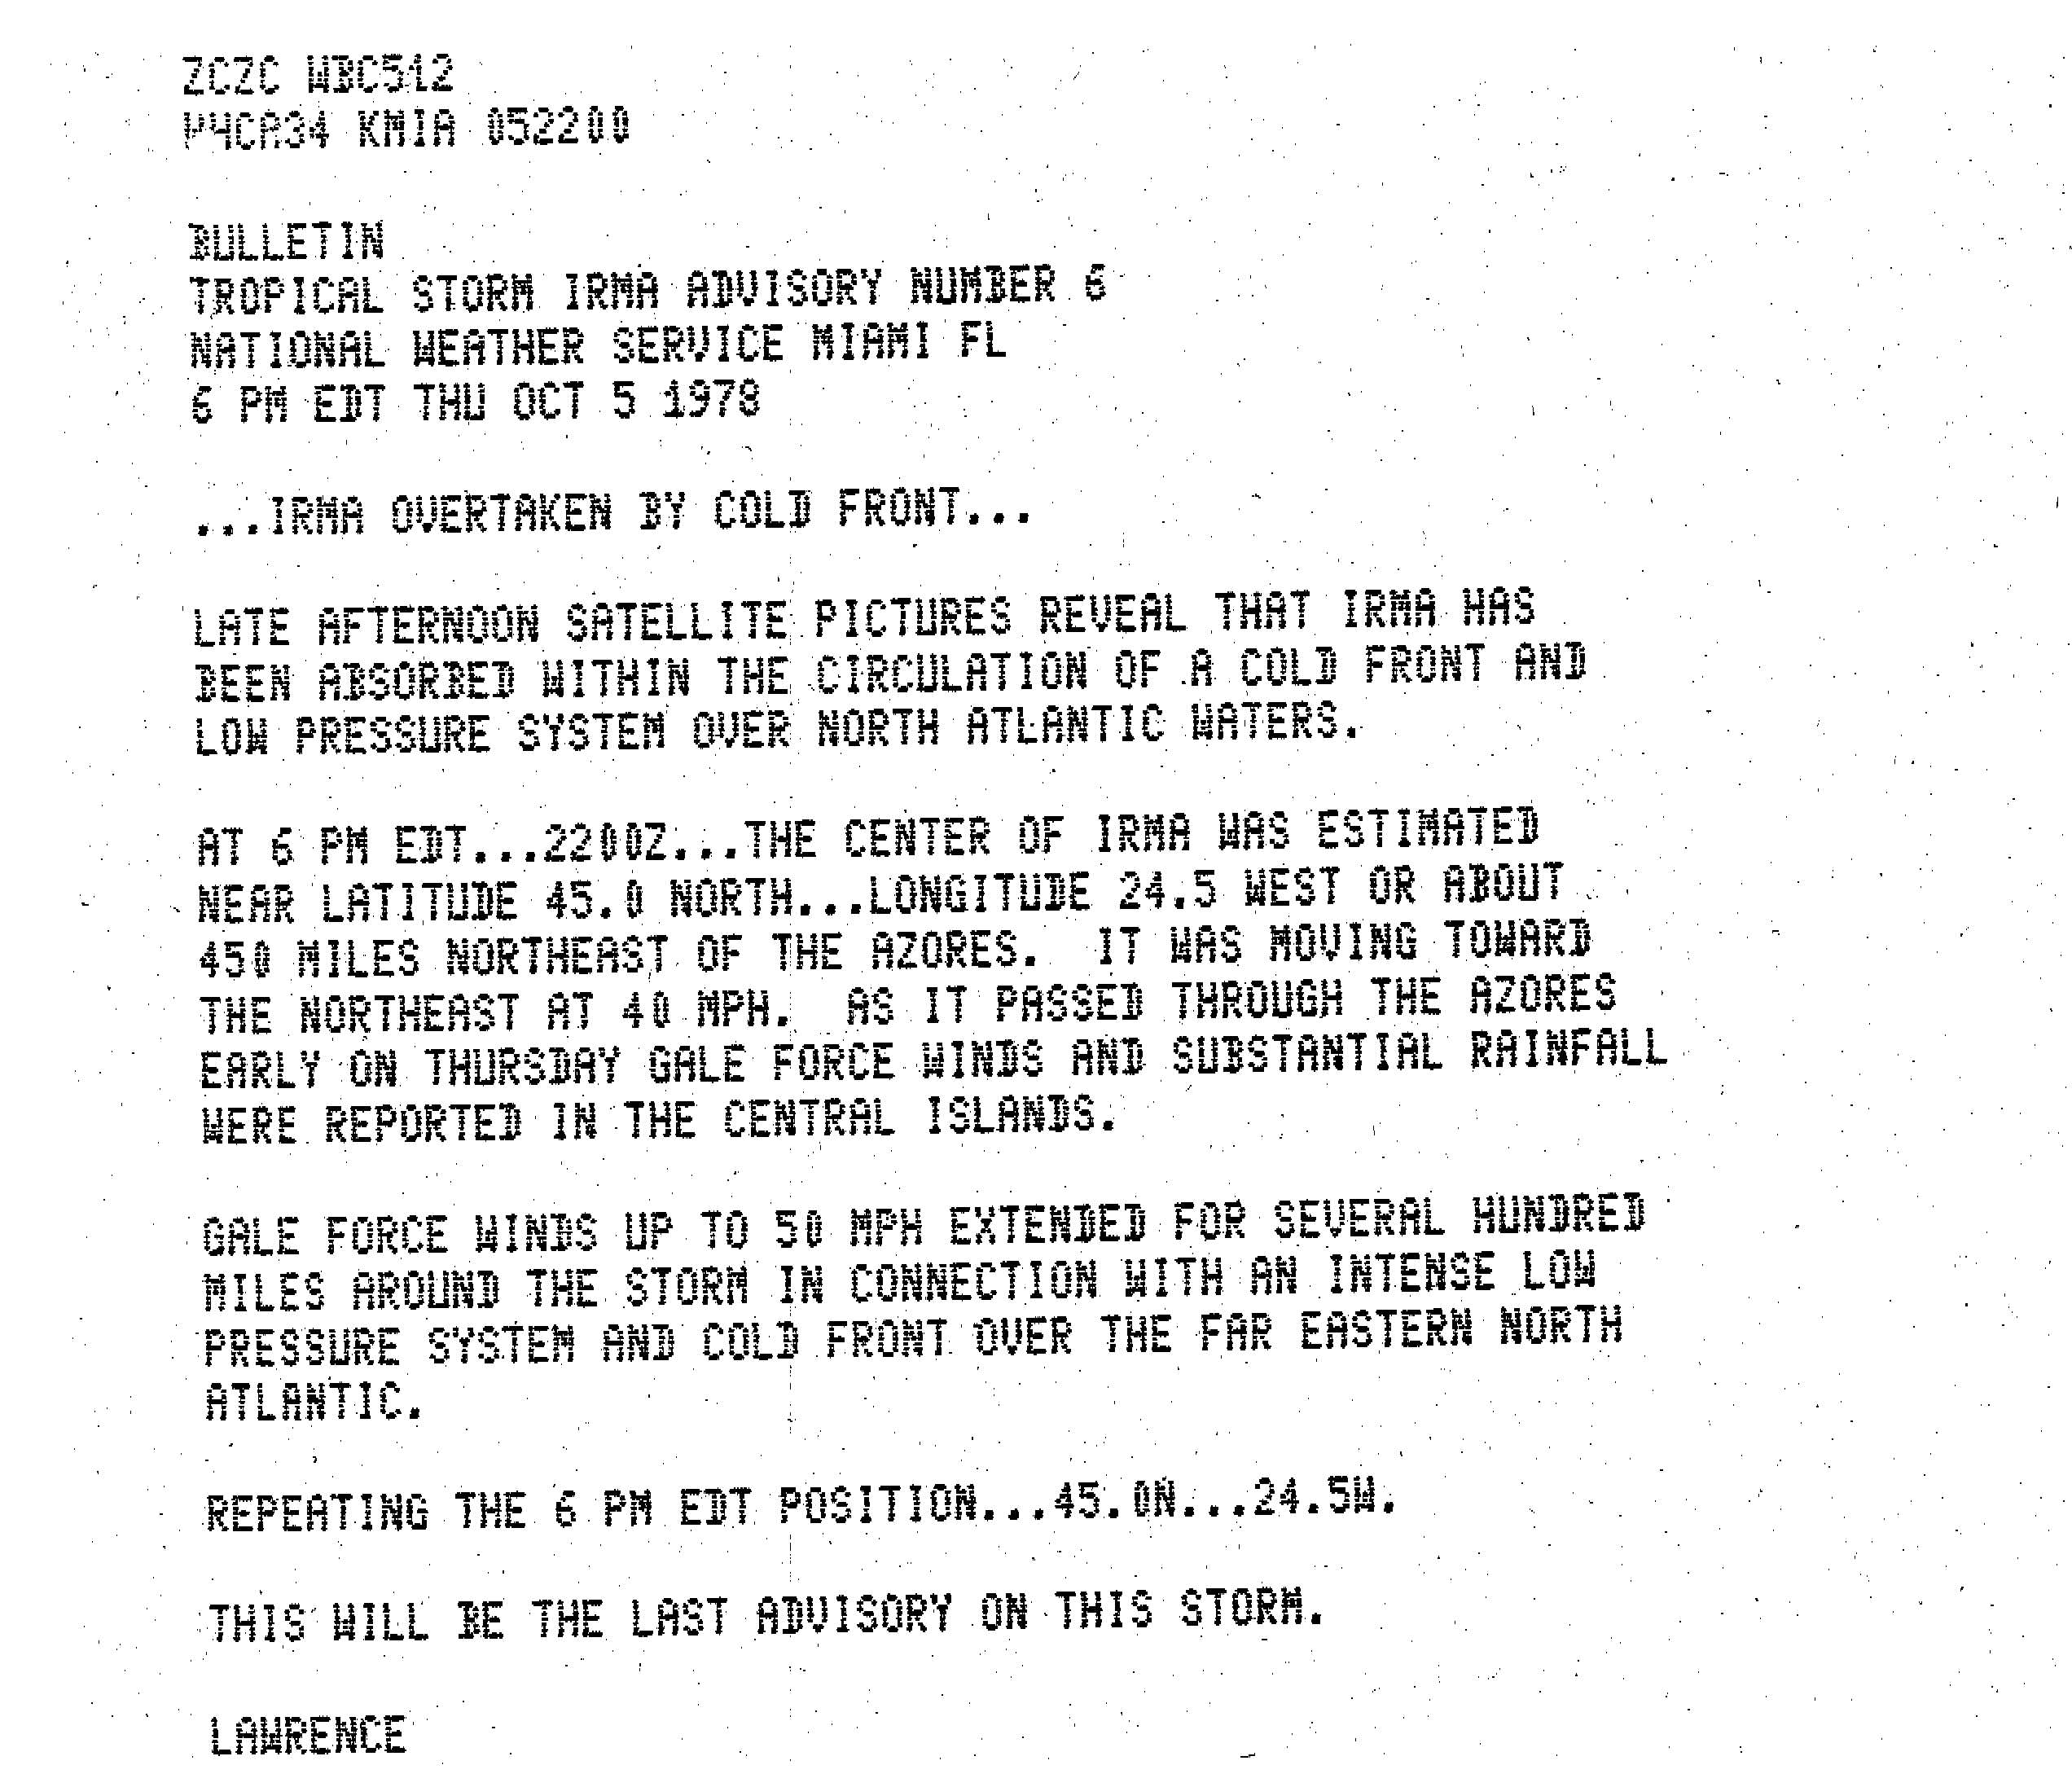
Six hours after being named, Irma reached its peak intensity of 50 mph (80 km/h).[63] On October 5, Irma turned towards the north-northeast and passed about midway between the central and western Azores.[61] Shortly thereafter, Irma became less organized,[64] and that evening was absorbed into an approaching cold front, about 450 mi (720 km) northeast of the Azores.[65] Although Irma passed near parts of the western and central Azores with gale-force winds in some areas, no reports of damage or casualties caused by Irma were received. Several nearby ships reported winds around 46 mph (74 km/h). It was noted that heavy rains may have occurred on some of the mountainous islands as Irma passed.[61]
Tropical Storm Juliet
| Tropical storm (SSHWS) | |||
|---|---|---|---|
| |||
| Duration | October 7 – October 11 | ||
| Peak intensity | 50 mph (85 km/h) (1-min) 1006 mbar (hPa) | ||


A weak tropical wave emerged into the Atlantic Ocean from the west coast of Africa on September 30. The wave moved west-northwestward and was centered well east of the Leeward Islands on October 6, when satellite imagery indicated that deep convection became much more concentrated. The following day, ship reports noted that a closed circulation was developing. The system was classified as a tropical depression beginning at 1800 UTC on October 7, while located about 600 mi (970 km) east of Puerto Rico. Around midday on October 8, the depression strengthened into Tropical Storm Juliet.[66]
After peaking with maximum sustained winds of 50 mph (80 km/h) and a minimum barometric pressure of 1,006 mbar (29.7 inHg) early on October 9, Juliet passed north of Puerto Rico.[66] The storm brought light rainfall to the island, peaking at 4.51 in (115 mm) at Toro Negro Plant.[19] The storm then accelerated and curved northwestward, northward, and then northeastward. On October 11, Juliet merged with a frontal zone, while located west-southwest of Bermuda. Later that day, the remnants moved across the island and produced up to 3 in (76 mm) of rainfall.[66]
Hurricane Kendra
| Category 1 hurricane (SSHWS) | |||
|---|---|---|---|
| |||
| Duration | October 28 – November 1 | ||
| Peak intensity | 80 mph (130 km/h) (1-min) 990 mbar (hPa) | ||

In late October, a tropical wave and an area of disturbed weather combined in the northwestern Caribbean, before crossing Puerto Rico. The system moved northwest and by late on October 28, it became a tropical depression while located about 80 miles (130 km) north of Mayaguana in The Bahamas. Early on the following day, it strengthened into Tropical Storm Kendra. The storm quickly intensified while moving either north or north-northwestward and became a hurricane late on October 29. After peaking with winds of 80 mph (130 km/h) on October 30, Kendra weakened significantly to a 50 mph (80 km/h) tropical storm in only 12 hours. Kendra continued north-northeastward or northeastward, before being absorbed by an extratropical cyclone while located west-northwest of Bermuda early on November 1.[33]
The precursor system dropped rainfall across much of southern Puerto Rico was at least 7 in (180 mm), with a peak at 20.43 in (519 mm) in Pico del Este.[19] Mudslides and flooding from the heavy precipitation left many roads impassable, washed out or collapsed several bridges, and caused considerable damage to agriculture, especially livestock. Additionally, one fatality occurred and 1,710 families fled their homes for shelters.[67] Damage in Puerto Rico reached $6 million. A high-pressure area and Kendra combined produced strong winds and abnormally high tides along the East Coast of the United States, though no damage was reported.[33]
Other storms
In addition to the 12 other tropical cyclones, there were several tropical depressions that developed during the season. The first of which formed over the central Gulf of Mexico on June 21. The depression moved northeastward toward Florida and strengthened slightly. It dissipated by late on June 22. Another tropical depression developed about 175 mi (282 km) southwest of Porto Novo, Cape Verde on July 10. The system moved generally westward and intensified into a strong tropical depression, before dissipating two days later. Tropical Depression Four formed about 465 mi (748 km) east of Barbados on August 7. It tracked westward without significantly intensifying, and passed through the Windward Islands over Bequia on the following day. The depression continued westward and passed near Aruba on August 9. It eventually traversed the Caribbean Sea, and made landfall to the south of Bluefields, Nicaragua on August 11. The depression dissipated shortly thereafter.[2]
A tropical depression formed in the central Gulf of Mexico on August 9. The storm moved northward and struck southeastern Plaquemines Parish, Louisiana before dissipating the next day. By August 30, another depression developed in the north-central Gulf of Mexico. The system tracked generally eastward and avoided landfall. It dissipated around midday on September 1. Tropical Depression Eight developed over western Senegal around 1200 UTC on September 3. The depression initially headed west-southwestward and soon entered the Atlantic Ocean. Between late on September 4 and early on September 5, the system passed south of Cape Verde. Later that day, the storm began curving west-northwestward. By early on September 7, it was heading northwestward and then turned to the north-northwest the next day. The depression moved northward between September 9 and September 10, before re-curving to the northeast. It dissipated about 440 mi (710 km) of Flores Island in the Azores around midday on September 11.[2]
At 1200 UTC on September 8, Tropical Depression Nine developed over the west-central Gulf of Mexico. Moving generally westward, the depression made landfall south of La Pesca, Tamaulipas, around midday on September 10. The system rapidly weakened inland and dissipated later that day. Another tropical depression formed over western Senegal on September 18. It moved westward across the Atlantic Ocean before curving west-northwestward about three days later. On September 25, the depression moved northwestward and then northward by September 28. It dissipated about 550 mi (890 km) east-northeast of Bermuda at 1200 UTC the following day. The next tropical depression developed in the Gulf of Mexico just offshore Campeche on September 21. Moving west-northwestward, the depression made landfall near Tampico on September 23, shortly before dissipating.[2]
A tropical depression formed at 1200 UTC on October 13, while located about 55 mi (89 km) north of Corvo Island in the Azores. The depression initially moved south-southwestward, before curving southwestward by the following day. It then turned west-northwestward on October 15. Late the next day, the depression turned abruptly northward. The system dissipated about 500 mi (800 km) west-northwest of Flores Island.[2] The next tropical depression developed at 1200 UTC on October 26, while located about 490 mi (790 km) south-southwest of the southernmost islands of Cape Verde. It moved generally westward and dissipated about halfway between the Lesser Antilles and the west coast of Africa on October 29. The final tropical depression of the season formed about 265 mi (426 km) northeast of North Abaco in the Bahamas on November 3. Moving north-northeastward, the depression turned northeastward by the next day. It dissipated about 275 mi (443 km) east of Virginia Beach, Virginia on November 5.[2]
Storm names
The following names were used for named storms that formed in the north Atlantic basin in 1978. Storms were named Amelia, Bess, Cora, Flossie, Hope, Irma and Juliet for the first time in 1978. This was the last year that only female names were used for Atlantic hurricanes.[68] The name Greta was retired after the 1978 season. Names that were not assigned are marked in gray.
|
|
Season effects
This is a table of the storms in 1978 and their landfall(s), if any. Deaths in parentheses are additional and indirect (an example of an indirect death would be a traffic accident), but are still storm-related. Damage and deaths include totals while the storm was extratropical or a wave or low.
| Saffir–Simpson hurricane wind scale | ||||||
| TD | TS | C1 | C2 | C3 | C4 | C5 |
| Storm name |
Dates active | Storm category
at peak intensity |
Max 1-min wind mph (km/h) |
Min. press. (mbar) |
Areas affected | Damage (millions USD) |
Deaths | |||
|---|---|---|---|---|---|---|---|---|---|---|
| Unnamed | January 18 – January 23 | Subtropical storm | 45 (75) | 1002 | None | None | None | |||
| Unnumbered | June 21 – June 23 | Tropical depression | 30 (45) | 1014 | None | None | None | |||
| Unnumbered | July 10 - July 12 | Tropical depression | 35 (55) | 1011 | None | None | None | |||
| Amelia | July 30 - August 1 | Tropical storm | 50 (85) | 1005 | Texas | 110 | 33 | |||
| Bess | August 5 - August 8 | Tropical storm | 50 (85) | 1005 | Mexico (Veracruz) | None | None | |||
| Cora | August 7 - August 12 | Category 1 hurricane | 90 (150) | 980 | Windward Islands (Grenada), Maine | None | 1 | |||
| Four | August 7 - August 11 | Tropical depression | 35 (55) | 1008 | Windward Islands (Bequia), Central America (Nicaragua) | None | None | |||
| Unnumbered | August 9 - August 10 | Tropical depression | 30 (45) | 1015 | Louisiana | None | None | |||
| Debra | August 26 - August 29 | Tropical storm | 60 (95) | 1000 | Southern United States (Louisiana), Midwestern United States, Mid-Atlantic states, New England | Minor | 2 | |||
| Ella | August 30 - September 5 | Category 4 hurricane | 140 (220) | 956 | East Coast of the United States, Atlantic Canada | None | None | |||
| Unnumbered | August 30 - September 1 | Tropical depression | 35 (55) | 1013 | None | None | None | |||
| Eight | September 3 - September 11 | Tropical depression | 35 (55) | 1009 | None | None | None | |||
| Flossie | September 4 - September 15 | Category 2 hurricane | 100 (155) | 976 | None | None | None | |||
| Nine | September 8 September 10 | Tropical depression | 35 (55) | 1003 | Mexico (Tamaulipas) | None | None | |||
| Greta | September 13 - September 20 | Category 4 hurricane | 135 (215) | 947 | Netherlands Antilles, Central America (Belize), Mexico | 25 | 5 | |||
| Hope | September 11 - September 21 | Tropical storm | 65 (100) | 987 | None | None | None | |||
| Twelve | September 18 - September 29 | Tropical depression | 35 (55) | 1008 | None | None | None | |||
| Unnumbered | September 21 - September 23 | Tropical depression | 35 (55) | 1001 | Mexico (Veracruz) | None | None | |||
| Irma | October 2 - October 5 | Tropical storm | 50 (85) | 998 | Azores | None | None | |||
| Juliet | October 7 - October 11 | Tropical storm | 50 (85) | 1006 | Puerto Rico, Bermuda | None | None | |||
| Unnumbered | October 13 - October 17 | Tropical depression | 35 (55) | 992 | None | None | None | |||
| Unnumbered | October 26 - October 29 | Tropical depression | 30 (45) | 1008 | None | None | None | |||
| Kendra | October 28 - November 1 | Category 1 hurricane | 80 (130) | 990 | Puerto Rico, East Coast of the United States | 6 | 1 | |||
| Unnumbered | November 3 - November 5 | Tropical depression | 35 (55) | 1006 | None | None | None | |||
| Season Aggregates | ||||||||||
| 24 cyclones | January 18 – November 5 | 140 (220) | 947 | 135 | 41 | |||||
See also
- List of Atlantic hurricanes
- List of Atlantic hurricane seasons
- 1978 Pacific hurricane season
- 1978 Pacific typhoon season
- 1978 North Indian Ocean cyclone season
- Southern Hemisphere tropical cyclone seasons: 1977–78, 1978–79
References
- 1 2 "Hurricane Bob?". Star-News. Washington, D.C. May 13, 1978. Retrieved June 6, 2014.
- 1 2 3 4 5 6 7 8 9 10 11 National Hurricane Center; Hurricane Research Division (July 6, 2016). "Atlantic hurricane best track (HURDAT version 2)". United States National Oceanic and Atmospheric Administration. Retrieved December 5, 2016.
- 1 2 Tropical Cyclone Climatology. National Hurricane Center (Report). Miami, Florida: National Oceanic and Atmospheric Administration. March 19, 2014. Retrieved May 30, 2014.
- ↑ Saffir-Simpson Hurricane Wind Scale. National Hurricane Center (Report). Miami, Florida: National Oceanic and Atmospheric Administration. May 23, 2013. Retrieved May 25, 2014.
- ↑ David M. Roth (January 17, 2010). Texas Hurricane History (PDF). Weather Prediction Center (Report). Camp Springs, Maryland: National Oceanic and Atmospheric Administration. Retrieved June 3, 2014.
- "U.S. Escaped Direct Hit in 'Average' Season This Year, But That Could Change". The Evening Independent. Miami, Florida. Associated Press. December 2, 1978. Retrieved June 3, 2014.
- "St. Lucia Youth Electrocuted During Storm". The Virgin Islands Daily News. Castries, Saint Lucia. Associated Press. August 22, 1978. Retrieved June 3, 2014.
- Preliminary Report Hurricane Greta (& Hurricane Olivia). National Hurricane Center (Report). Miami, Florida: National Oceanic and Atmospheric Administration. 1978. p. 3. Retrieved June 6, 2014.
- 1 2 3 4 Miles B. Lawrence (April 1979). Atlantic Hurricane Season of 1978 (PDF). Atlantic Oceanographic and Meteorological Laboratory; National Hurricane Center (Report). Miami, Florida: National Oceanic and Atmospheric Administration. Archived (PDF) from the original on September 23, 2008. Retrieved June 3, 2014.
- ↑ Atlantic basin Comparison of Original and Revised HURDAT. Hurricane Research Division (Report). Miami, Florida: National Oceanic and Atmospheric Administration; National Hurricane Center. March 2011. Retrieved June 6, 2014.
- ↑ David Levinson (August 20, 2008). 2005 Atlantic Ocean Tropical Cyclones. National Climatic Data Center (Report). Asheville, North Carolina: National Oceanic and Atmospheric Administration; National Hurricane Center. Retrieved June 6, 2014.
- ↑ JBL (January 19, 1978). Tropical and Subtropical Cyclone Classification on Subtropical Storm One (1). National Hurricane Center (Report). Miami, Florida: National Oceanic and Atmospheric Administration. Retrieved June 3, 2014.
- ↑ MM (January 20, 1978). Tropical and Subtropical Cyclone Classification on Subtropical Storm One. National Hurricane Center (Report). Miami, Florida: National Oceanic and Atmospheric Administration. Retrieved June 3, 2014.
- ↑ SCT (January 20, 1978). Tropical and Subtropical Cyclone Classification on Subtropical Storm One. National Hurricane Center (Report). Miami, Florida: National Oceanic and Atmospheric Administration. Retrieved June 3, 2014.
- ↑ MM (January 21, 1978). Tropical and Subtropical Cyclone Classification on Subtropical Storm One. National Hurricane Center (Report). Miami, Florida: National Oceanic and Atmospheric Administration. Retrieved June 3, 2014.
- ↑ SANBAR Model Forecast for Subtropical Storm One. National Hurricane Center (Report). Miami, Florida: National Oceanic and Atmospheric Administration. January 21, 1978. Retrieved June 3, 2014.
- ↑ JBL (January 21, 1978). Tropical and Subtropical Cyclone Classification on Subtropical Storm One. National Hurricane Center (Report). Miami, Florida: National Oceanic and Atmospheric Administration. Retrieved June 3, 2014.
- ↑ Christopher W. Landsea; et al. (December 2012). Documentation of Atlantic Tropical Cyclones Changes in HURDAT (1938). Hurricane Research Division (Report). National Oceanic and Atmospheric Administration; Atlantic Oceanographic and Meteorological Laboratory. Retrieved June 3, 2014.
- ↑ John R. Hope (1978). Tropical Storm Amelia July 30–31, 1978. National Hurricane Center (Report). Miami, Florida: National Oceanic and Atmospheric Administration. p. 1. Retrieved June 3, 2014.
- 1 2 John R. Hope (1978). Tropical Storm Amelia July 30–31, 1978. National Hurricane Center (Report). Miami, Florida: National Oceanic and Atmospheric Administration. p. 2. Retrieved June 3, 2014.
- ↑ "Tropical Storm Sinks Three Boats". Brownsville, Texas: Toledo Blade. Associated Press. July 31, 1978. Retrieved June 3, 2014.
- 1 2 3 4 5 Roth, David M. (April 29, 2015). "Tropical Cyclone Point Maxima". Tropical Cyclone Rainfall Data. United States Weather Prediction Center. Retrieved May 8, 2016.
- ↑ George W. Bomar (1983). Texas Weather. University of Texas Press. p. 52. ISBN 0-292-78053-2.
- ↑ "Floods in Aftermath of Tropical Storm Sweep Away Texas Homes, Cars". Times-Union. San Antonio, Texas. Associated Press. August 2, 1978. Retrieved June 3, 2014.
- ↑ "Texans Keep Eyes on Sky and Gulf Storm". Beaver County Times. Graham, Texas. United Press International. August 7, 1978. Retrieved June 3, 2014.
- ↑ David M. Roth (January 17, 2010). Texas Hurricane History (PDF). Weather Prediction Center (Report). Camp Springs, Maryland: National Oceanic and Atmospheric Administration. Retrieved June 3, 2014.
- ↑ "U.S. Escaped Direct Hit in 'Average' Season This Year, But That Could Change". The Evening Independent. Miami, Florida. Associated Press. December 2, 1978. Retrieved June 3, 2014.
- 1 2 Paul J. Hebert (1978). Preliminary Report Tropical Storm Bess. National Hurricane Center (Report). Miami, Florida: National Oceanic and Atmospheric Administration. p. 1. Retrieved January 1, 2013.
- 1 2 Paul J. Hebert (1978). Preliminary Report Tropical Storm Bess. National Hurricane Center (Report). Miami, Florida: National Oceanic and Atmospheric Administration. p. 2. Retrieved January 1, 2013.
- ↑ David M. Roth (April 27, 2010). Tropical Storm Bess - August 7–8, 1978. Weather Prediction Center (Report). Camp Springs, Maryland: National Oceanic and Atmospheric Administration. Retrieved January 1, 2013.
- 1 2 Gilbert B. Clark (1978). Hurricane Cora August 7–12, 1978. National Hurricane Center (Report). Miami, Florida: National Oceanic and Atmospheric Administration. p. 1. Retrieved June 3, 2014.
- ↑ Gilbert B. Clark (1978). Hurricane Cora August 7–12, 1978. National Hurricane Center (Report). Miami, Florida: National Oceanic and Atmospheric Administration. p. 4. Retrieved June 3, 2014.
- ↑ Neil L. Frank and Gilbert B. Clark (August 1979). Atlantic Tropical Systems of 1978. National Hurricane Center (Report). Miami, Florida: National Oceanic and Atmospheric Administration. Retrieved June 3, 2014.
- ↑ "St. Lucia Youth Electrocuted During Storm". The Virgin Islands Daily News. Castries, Saint Lucia. Associated Press. August 22, 1978. Retrieved June 3, 2014.
- ↑ "Balloon Launch Awaited". New Mexican. Associated Press. 1978.
- 1 2 3 4 5 6 Miles B. Lawrence (April 1979). Atlantic Hurricane Season of 1978 (PDF) (Report). Miami: National Oceanic and Atmospheric Administration; Atlantic Oceanographic and Meteorological Laboratory. Retrieved June 5, 2014.
- 1 2 3 Joseph M. Plessier (1978). Preliminary Report Tropical Storm Debra August 26–29, 1978. National Hurricane Center (Report). Miami, Florida: National Oceanic and Atmospheric Administration. Retrieved June 5, 2014.
- ↑ "Storm Hits Louisiana". Spokane Daily Chronicle. New Orleans, Louisiana. August 29, 1978. Retrieved June 5, 2014.
- ↑ Tornado History Project: 19780829.5.35. Storm Prediction Center (Report). Tornado History Project. Retrieved June 5, 2014.
- ↑ Tornado History Project: 19780829.47.7. Storm Prediction Center (Report). Tornado History Project. Retrieved June 5, 2014.
- ↑ "Debra lumbers inland, causes minor flooding". Deseret News. August 29, 1978. Retrieved June 5, 2014.
- ↑ Miles B. Lawrence (1978). Preliminary Report Hurricane Ella 30 August – 5 September 1978. National Hurricane Center (Report). Miami, Florida: National Oceanic and Atmospheric Administration. p. 1. Retrieved June 5, 2014.
- ↑ Paul J. Hebert (September 3, 1978). Tropical Cyclone Discussion Hurricane Ella. National Hurricane Center (Report). Miami, Florida: National Oceanic and Atmospheric Administration. Retrieved June 5, 2014.
- 1 2 3 4 Miles B. Lawrence (1978). Preliminary Report Hurricane Ella. National Hurricane Center (Report). Miami, Florida: National Oceanic and Atmospheric Administration. p. 2. Retrieved June 5, 2014.
- ↑ Miles B. Lawrence (August 31, 1978). Hurricane Ella Discussion. National Hurricane Center (Report). Miami, Florida: National Oceanic and Atmospheric Administration. Retrieved June 5, 2014.
- ↑ Hurricane Ella Local Statement Number 12. National Weather Service Office Cape Hatteras, North Carolina (Report). Cape Hatteras, North Carolina: National Oceanic and Atmospheric Administration; National Hurricane Center. September 2, 1978. Retrieved June 5, 2014.
- ↑ Albert R. Hinn (September 7, 1978). Information for Hurricane Ella Survey Report. National Weather Service Office Wilmington, North Carolina (Report). Wilmington, North Carolina: National Oceanic and Atmospheric Administration; National Hurricane Center. Retrieved June 14, 2014.
- ↑ 1978-Ella (Report). Moncton, New Brunswick: Environment Canada. September 14, 2010. Retrieved June 5, 2014.
- 1 2 Paul J. Hebert (1978). Preliminary Report Hurricane Flossie. National Hurricane Center (Report). National Oceanic and Atmospheric Administration. p. 1. Retrieved June 5, 2014.
- ↑ Paul J. Hebert (1978). Preliminary Report Hurricane Flossie. National Hurricane Center (Report). National Oceanic and Atmospheric Administration. p. 2. Retrieved June 5, 2014.
- ↑ Trevor A. Harley (2012). The British weather in September (Report). Dundee, Scotland: University of Dundee. Retrieved June 5, 2014.
- 1 2 "Preliminary Report Hurricane Greta (& Hurricane Olivia) September 13–23, 1978". National Hurricane Center. Miami, Florida: National Oceanic and Atmospheric Administration. 1978. p. 1. Retrieved June 19, 2014.
- ↑ "Preliminary Report Hurricane Greta (& Hurricane Olivia) September 13–23, 1978". National Hurricane Center. Miami, Florida: National Oceanic and Atmospheric Administration. 1978. p. 2. Retrieved June 19, 2014.
- 1 2 3 4 5 "Preliminary Report Hurricane Greta (& Hurricane Olivia) September 13–23, 1978". National Hurricane Center. Miami, Florida: National Oceanic and Atmospheric Administration. 1978. p. 3. Retrieved June 19, 2014.
- ↑ "Hurricane Greta Pounds Honduras Coast". Kingman Daily Miner. Tegucigalpa, Honduras. Associated Press. September 18, 1978. Retrieved June 5, 2014.
- ↑ "Bundles for Bolivia" (PDF). The Patriot. 439th Tactical Airlift Wing. 5 (12). December 1978. Archived from the original (PDF) on December 27, 2013. Retrieved June 5, 2014.
- ↑ George Singer (September 18, 1978). HWDamage7 (JPG) (Report). Miami, Florida: National Hurricane Center; National Oceanic and Atmospheric Administration. Retrieved June 5, 2014.
- ↑ B. Kjerfve; S. P. Dinnel (May 1983). "Hindcast hurricane characteristics on the Belize barrier reef". Coral Reefs. 1 (4): 203. Bibcode:1983CorRe...1..203K. doi:10.1007/bf00304416. Retrieved June 5, 2014.
- ↑ George Singer (September 19, 1978). HWDamage6 (JPG) (Report). Miami, Florida: National Hurricane Center; National Oceanic and Atmospheric Administration. Retrieved June 5, 2014.
- ↑ George Singer (September 19, 1978). HWDamage7 (JPG) (Report). Miami, Florida: National Hurricane Center; National Oceanic and Atmospheric Administration. Retrieved June 5, 2014.
- ↑ George Singer (September 18, 1978). HWDamage2 (JPG) (Report). Miami, Florida: National Hurricane Center; National Oceanic and Atmospheric Administration. Retrieved June 5, 2014.
- 1 2 3 4 Gilbert B. Clark (1978). Preliminary Report Tropical Storm Hope September 11–21, 1978. National Hurricane Center (Report). Miami, Florida: National Oceanic and Atmospheric Administration. Retrieved June 5, 2014.
- 1 2 Miles B. Lawrence (September 20, 1978). Tropical Cyclone Discussion Tropical Storm Hope. National Hurricane Center (Report). Miami, Florida: National Oceanic and Atmospheric Administration. Retrieved June 5, 2014.
- 1 2 3 Preliminary Report Tropical Storm Irma October 2–5, 1978. National Hurricane Center (Report). Miami, Florida: National Oceanic and Atmospheric Administration. Retrieved June 5, 2014.
- ↑ Joseph M. Pelissier (October 4, 1978). Tropical Storm Irma Advisory 1. National Hurricane Center (Report). Miami, Florida: National Oceanic and Atmospheric Administration. Retrieved June 5, 2014.
- ↑ Preliminary Best Track Tropical Storm Irma October 2–5, 1978. National Hurricane Center (Report). Miami, Florida: National Oceanic and Atmospheric Administration. Retrieved June 5, 2014.
- ↑ Joseph M. Pelissier (5 October 1978). Tropical Storm Irma Advisory 5. National Hurricane Center (Report). Miami, Florida: National Oceanic and Atmospheric Administration. Retrieved June 5, 2014.
- ↑ Miles B. Lawrence (October 5, 1978). Tropical Storm Irma Advisory 6. National Hurricane Center (Report). Miami, Florida: National Oceanic and Atmospheric Administration. Retrieved June 5, 2014.
- 1 2 3 Miles B. Lawrence (1978). Preliminary Report Tropical Storm Juliet 7 – 11 1978. National Hurricane Center (Report). Miami, Florida: National Oceanic and Atmospheric Administration. p. 1. Retrieved June 5, 2014.
- ↑ Storm Data and Unusual Weather Phenomena (PDF). National Climatic Data Center (Report). Asheville, North Carolina: National Oceanic and Atmospheric Administration. p. 4. Archived (PDF) from the original on June 6, 2014. Retrieved June 6, 2014.
- ↑ Don McLeod (May 15, 1978). "Males to share the billing in names for hurricanes". The Day. Washington, D.C. Associated Press. Retrieved June 19, 2014.
External links
| Wikimedia Commons has media related to 1978 Atlantic hurricane season. |
Tropical cyclones of the 1978 Atlantic hurricane season | ||
|---|---|---|
| ||
| ||