Wigan Metropolitan Borough Council election, 1975
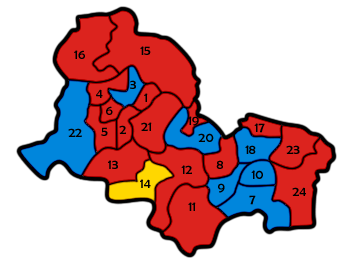
Map of the results for the 1975 Wigan council election. Labour in red, Conservatives in blue and Liberal in yellow.
Elections to Wigan Council were held on 1 May 1975, with one third of the council up for the election - although only 21 seats were contested, as Labour were unopposed in Ward 12, 21 and 24. Labour suffered six losses on the night - five to the Conservatives and one to the Liberals - with a gain from the sole Independent in Ward 23 as consolation. Overall turnout fell by nearly a quarter, to 27%. [1]
Election result
| Wigan Council Election Result 1975 | ||||||||||
|---|---|---|---|---|---|---|---|---|---|---|
| Party | Seats | Gains | Losses | Net gain/loss | Seats % | Votes % | Votes | +/− | ||
| Labour | 16 | 1 | 6 | -5 | 66.7 | 49.2 | 25,697 | -11.3% | ||
| Conservative | 7 | 5 | 0 | +5 | 29.2 | 40.8 | 21,270 | +12.4% | ||
| Liberal | 1 | 1 | 0 | +1 | 4.2 | 6.8 | 3,550 | +6.8% | ||
| Independent | 0 | 0 | 1 | -1 | 0.0 | 2.5 | 1,302 | -5.6% | ||
| Communist | 0 | 0 | 0 | 0 | 0.0 | 0.7 | 345 | +0.5% | ||
This result had the following consequences for the total number of seats on the Council after the elections:
| Party | Previous council | New council | |||
|---|---|---|---|---|---|
| Labour | 66 | 61 | |||
| Conservatives | 5 | 10 | |||
| Liberals | 0 | 1 | |||
| Independent | 1 | 0 | |||
| Total | 72 | 72 | |||
| Working majority | 60 | 50 | |||
Ward results
| Party | Candidate | Votes | % | ± | |
|---|---|---|---|---|---|
| Labour | M. Pratt | 1,728 | 64.1 | -9.5 | |
| Conservative | C. Giles | 966 | 35.9 | +9.5 | |
| Majority | 762 | 28.3 | -18.9 | ||
| Turnout | 2,694 | 29.0 | -9.6 | ||
| Labour hold | Swing | -9.5 | |||
| Party | Candidate | Votes | % | ± | |
|---|---|---|---|---|---|
| Labour | S. Townley | 1,049 | 65.6 | -16.0 | |
| Conservative | J. Atherton | 550 | 34.4 | +16.0 | |
| Majority | 499 | 31.2 | -32.0 | ||
| Turnout | 1,599 | 17.1 | -10.4 | ||
| Labour hold | Swing | -16.0 | |||
| Party | Candidate | Votes | % | ± | |
|---|---|---|---|---|---|
| Conservative | W. France | 2,417 | 64.5 | +4.8 | |
| Labour | M. Pendleton | 862 | 23.0 | -17.3 | |
| Liberal | K. Mason | 467 | 12.5 | +12.5 | |
| Majority | 1,555 | 41.5 | +22.1 | ||
| Turnout | 3,746 | 32.3 | -7.1 | ||
| Conservative hold | Swing | +11.0 | |||
| Party | Candidate | Votes | % | ± | |
|---|---|---|---|---|---|
| Labour | N. Turner | 1,478 | 71.6 | -8.9 | |
| Conservative | ?. Gormally | 586 | 28.4 | +8.9 | |
| Majority | 892 | 43.2 | -17.8 | ||
| Turnout | 2,064 | 22.1 | -9.4 | ||
| Labour hold | Swing | -8.9 | |||
| Party | Candidate | Votes | % | ± | |
|---|---|---|---|---|---|
| Labour | J. Smith | 1,189 | 51.1 | -17.0 | |
| Conservative | T. Peet | 982 | 42.2 | +10.3 | |
| Communist | ?. Dowd | 157 | 6.7 | +6.7 | |
| Majority | 207 | 8.9 | -27.2 | ||
| Turnout | 2,328 | 21.5 | -9.1 | ||
| Labour hold | Swing | -13.6 | |||
| Party | Candidate | Votes | % | ± | |
|---|---|---|---|---|---|
| Labour | M. Mulligan | 1,116 | 68.5 | -13.1 | |
| Conservative | C. Boyle | 513 | 31.5 | +13.1 | |
| Majority | 603 | 37.0 | -26.2 | ||
| Turnout | 1,629 | 18.6 | -6.7 | ||
| Labour hold | Swing | -13.1 | |||
| Party | Candidate | Votes | % | ± | |
|---|---|---|---|---|---|
| Conservative | ?. Hurst | 1,535 | 59.4 | +16.0 | |
| Labour | J. Jones | 1,048 | 40.6 | -16.0 | |
| Majority | 487 | 18.9 | +5.7 | ||
| Turnout | 2,583 | 37.5 | +0.9 | ||
| Conservative gain from Labour | Swing | +16.0 | |||
| Party | Candidate | Votes | % | ± | |
|---|---|---|---|---|---|
| Labour | G. Bridge | 817 | 55.4 | -19.1 | |
| Conservative | J. Davies | 566 | 38.4 | +20.5 | |
| Communist | J. Blackburn | 91 | 6.2 | -1.4 | |
| Majority | 251 | 17.0 | -39.6 | ||
| Turnout | 1,474 | 16.8 | -5.0 | ||
| Labour hold | Swing | -19.8 | |||
| Party | Candidate | Votes | % | ± | |
|---|---|---|---|---|---|
| Conservative | H. Yates | 1,310 | 54.6 | +15.3 | |
| Labour | ?. Tonks | 991 | 41.3 | -19.4 | |
| Communist | H. Kedward | 97 | 4.0 | +4.0 | |
| Majority | 319 | 13.3 | -8.2 | ||
| Turnout | 2,398 | 25.7 | -1.3 | ||
| Conservative gain from Labour | Swing | +17.3 | |||
| Party | Candidate | Votes | % | ± | |
|---|---|---|---|---|---|
| Conservative | M. Wood | 1,853 | 65.0 | +18.2 | |
| Labour | J. Prytharch | 997 | 35.0 | -18.2 | |
| Majority | 856 | 30.0 | +23.6 | ||
| Turnout | 2,850 | 31.3 | -4.5 | ||
| Conservative gain from Labour | Swing | +18.2 | |||
| Party | Candidate | Votes | % | ± | |
|---|---|---|---|---|---|
| Labour | E. Roberts | 2,095 | 58.8 | -14.9 | |
| Conservative | T. Thompson | 1,469 | 41.2 | +14.9 | |
| Majority | 626 | 17.6 | -29.8 | ||
| Turnout | 3,564 | 34.5 | -4.9 | ||
| Labour hold | Swing | -14.9 | |||
| Party | Candidate | Votes | % | ± | |
|---|---|---|---|---|---|
| Labour | A. Miller | Unopposed | N/A | N/A | |
| Labour hold | Swing | N/A | |||
| Party | Candidate | Votes | % | ± | |
|---|---|---|---|---|---|
| Labour | R. Lyons | 1,186 | 72.4 | N/A | |
| Liberal | P. Scully | 453 | 27.6 | N/A | |
| Majority | 733 | 44.7 | N/A | ||
| Turnout | 1,639 | 21.7 | N/A | ||
| Labour hold | Swing | N/A | |||
| Party | Candidate | Votes | % | ± | |
|---|---|---|---|---|---|
| Liberal | ?. Worsley | 1,103 | 51.4 | +51.4 | |
| Labour | G. Fairhurst | 1,043 | 48.6 | -21.7 | |
| Majority | 60 | 2.8 | -37.9 | ||
| Turnout | 2,146 | 26.6 | -1.2 | ||
| Liberal gain from Labour | Swing | +36.5 | |||
| Party | Candidate | Votes | % | ± | |
|---|---|---|---|---|---|
| Labour | J. Hardy | 1,346 | 35.7 | +2.4 | |
| Independent | G. Dewhurst | 1,302 | 34.5 | +5.4 | |
| Conservative | J. Lawson | 754 | 20.0 | +0.0 | |
| Liberal | ?. Young | 369 | 9.8 | +9.8 | |
| Majority | 44 | 1.2 | -3.0 | ||
| Turnout | 3,771 | 35.2 | -15.7 | ||
| Labour gain from Independent | Swing | -1.5 | |||
| Party | Candidate | Votes | % | ± | |
|---|---|---|---|---|---|
| Labour | H. Lowe | 1,302 | 59.2 | -5.4 | |
| Liberal | ?. Lammas | 897 | 40.8 | +40.8 | |
| Majority | 405 | 18.4 | -10.7 | ||
| Turnout | 2,199 | 22.2 | -16.9 | ||
| Labour hold | Swing | -23.1 | |||
| Party | Candidate | Votes | % | ± | |
|---|---|---|---|---|---|
| Labour | D. Skitt | 1,517 | 54.1 | N/A | |
| Conservative | M. Williams | 1,025 | 36.6 | N/A | |
| Liberal | ?. Hicks | 261 | 9.3 | N/A | |
| Majority | 492 | 17.6 | N/A | ||
| Turnout | 2,803 | 29.8 | N/A | ||
| Labour hold | Swing | N/A | |||
| Party | Candidate | Votes | % | ± | |
|---|---|---|---|---|---|
| Conservative | J. Grundy | 1,258 | 64.5 | +26.5 | |
| Labour | G. Horrabin | 693 | 35.5 | -11.3 | |
| Majority | 565 | 29.0 | +20.3 | ||
| Turnout | 1,951 | 30.1 | -9.7 | ||
| Conservative gain from Labour | Swing | +18.9 | |||
| Party | Candidate | Votes | % | ± | |
|---|---|---|---|---|---|
| Labour | A. Robinson | 1,087 | 64.6 | -11.4 | |
| Conservative | ?. Haseldene | 596 | 35.4 | +11.4 | |
| Majority | 491 | 29.2 | -22.9 | ||
| Turnout | 1,683 | 22.2 | -11.3 | ||
| Labour hold | Swing | -11.8 | |||
| Party | Candidate | Votes | % | ± | |
|---|---|---|---|---|---|
| Conservative | J. Culshaw | 1,346 | 51.7 | +15.2 | |
| Labour | S. Hardy | 1,256 | 48.3 | -15.2 | |
| Majority | 90 | 3.5 | -23.6 | ||
| Turnout | 2,602 | 25.5 | -3.7 | ||
| Conservative gain from Labour | Swing | +15.2 | |||
| Party | Candidate | Votes | % | ± | |
|---|---|---|---|---|---|
| Labour | A. Banks | Unopposed | N/A | N/A | |
| Labour hold | Swing | N/A | |||
| Party | Candidate | Votes | % | ± | |
|---|---|---|---|---|---|
| Conservative | F. Fairbairn | 2,554 | 63.3 | +29.5 | |
| Labour | J. Fitzpatrick | 1,482 | 36.7 | -1.4 | |
| Majority | 1,072 | 26.6 | +22.3 | ||
| Turnout | 4,036 | 34.8 | -9.8 | ||
| Conservative hold | Swing | +15.4 | |||
| Party | Candidate | Votes | % | ± | |
|---|---|---|---|---|---|
| Labour | A. Wright | 1,415 | 58.8 | -12.0 | |
| Conservative | ?. Hodkinson | 990 | 41.2 | +41.2 | |
| Majority | 425 | 17.7 | -23.9 | ||
| Turnout | 2,405 | 29.4 | +0.8 | ||
| Labour hold | Swing | -26.6 | |||
| Party | Candidate | Votes | % | ± | |
|---|---|---|---|---|---|
| Labour | F. Hampson | Unopposed | N/A | N/A | |
| Labour hold | Swing | N/A | |||
References
| Metropolitan boroughs |
|
|---|---|
| District councils (England) |
|
| Referendum | |
| Ad-hoc election | |
| Mayor | |
|---|---|
| Bolton | |
| Bury | |
| Manchester | |
| Oldham | |
| Rochdale | |
| Salford | |
| Stockport | |
| Tameside | |
| Trafford | |
| Wigan | |
| County Council |
|
| |
This article is issued from Wikipedia - version of the 10/20/2016. The text is available under the Creative Commons Attribution/Share Alike but additional terms may apply for the media files.