Wigan Metropolitan Borough Council election, 1987
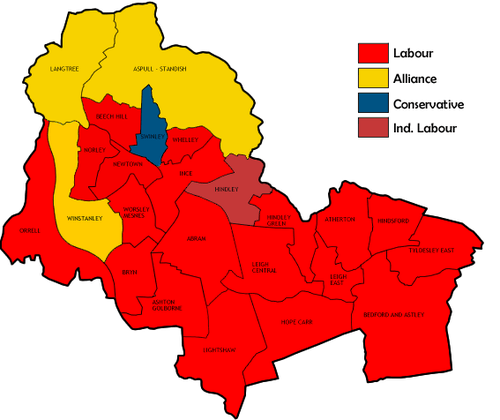
Elections to the Wigan council were held on Thursday, 7 May 1987, with one third of the council up for election. Previous to the election there had been two by-elections held, resulting in a Labour gain of the seat being fought in Swinley from the Conservatives and Labour retaining one of their Hindley Green seats. Participation for this election increased substantially from the previous year's lows. Only one ward went unopposed (Leigh Central) as Labour reliably provided a full-slate of candidates, the Alliance all but Atherton and the Conservatives up from 16 to 18, by way of fielding candidates in the Labour strongholds of Abram and Worsley Mesnes this time around. An Independent Labour candidate also fought and won Hindley, with an Independent victory last seen in 1976, and Independent representation in 1980, when that same victor failed to survive the re-warding.
The results seen an end to four years of consecutive increases in Labour's share, peaking with last year's all-time high, as they slipped back into a respectable high-fifties and their loss dispersing to each of the opposition parties. Labour lost four seats in total, with the aforementioned Independent Labour loss in Hindley, an Alliance casualty from last year's elections re-elected in Winstanley, another loss to Alliance in Aspull-Standish and the Conservatives comfortable retaking the seat in Swinley they'd lost in the earlier mentioned by-election. These losses were offset somewhat by a gain from Alliance in Tyldesley East, returning the ward to entire Labour representation. Overall turnout rose to an above-average 37.1%.[1]
Election result
| Wigan Local Election Result 1987 | ||||||||||
|---|---|---|---|---|---|---|---|---|---|---|
| Party | Seats | Gains | Losses | Net gain/loss | Seats % | Votes % | Votes | +/− | ||
| Labour | 19 | 1 | 4 | -3 | 79.2 | 59.3 | 49,800 | -5.7% | ||
| SDP–Liberal Alliance | 3 | 2 | 1 | +1 | 12.5 | 23.1 | 19,406 | +1.3% | ||
| Conservative | 1 | 1 | 0 | +1 | 4.2 | 15.3 | 12,820 | +2.2% | ||
| Independent Labour | 1 | 1 | 0 | +1 | 4.2 | 2.2 | 1,894 | +2.2% | ||
This result had the following consequences for the total number of seats on the Council after the elections:
| Party | Previous council | New council | |||
|---|---|---|---|---|---|
| Labour | 65 | 62 | |||
| SDP-Liberal Alliance | 5 | 6 | |||
| Conservatives | 2 | 3 | |||
| Independent Labour | 0 | 1 | |||
| Total | 72 | 72 | |||
| Working majority | 58 | 52 | |||
Ward results
| Party | Candidate | Votes | % | ± | |
|---|---|---|---|---|---|
| Labour | N. Cumberbach | 2,687 | 80.0 | N/A | |
| Conservative | J. Wright | 377 | 11.2 | N/A | |
| SDP–Liberal Alliance | R. Murphy | 296 | 8.8 | N/A | |
| Majority | 2,310 | 68.7 | N/A | ||
| Turnout | 3,360 | 34.8 | N/A | ||
| Labour hold | Swing | N/A | |||
| Party | Candidate | Votes | % | ± | |
|---|---|---|---|---|---|
| Labour | J. Hilton | 2,206 | 65.3 | -7.3 | |
| Conservative | S. Edwards | 718 | 21.2 | +6.2 | |
| SDP–Liberal Alliance | B. Miners | 453 | 13.4 | +1.2 | |
| Majority | 1,488 | 44.0 | -13.5 | ||
| Turnout | 3,377 | 34.6 | +4.3 | ||
| Labour hold | Swing | -6.7 | |||
| Party | Candidate | Votes | % | ± | |
|---|---|---|---|---|---|
| SDP–Liberal Alliance | G. Davies | 2,153 | 42.0 | +0.5 | |
| Labour | A. Durkin | 2,117 | 41.3 | -4.6 | |
| Conservative | K. Hart | 860 | 16.7 | +4.0 | |
| Majority | 36 | 0.7 | -3.7 | ||
| Turnout | 5,130 | 49.4 | +4.8 | ||
| SDP–Liberal Alliance gain from Labour | Swing | +2.5 | |||
| Party | Candidate | Votes | % | ± | |
|---|---|---|---|---|---|
| Labour | J. Sumner | 2,507 | 76.1 | -6.6 | |
| Conservative | M. Sharland | 1,418 | 23.8 | +6.6 | |
| Majority | 1,722 | 52.3 | -13.1 | ||
| Turnout | 3,292 | 35.0 | +5.4 | ||
| Labour hold | Swing | -6.6 | |||
| Party | Candidate | Votes | % | ± | |
|---|---|---|---|---|---|
| Labour | H. Hayes | 1,999 | 58.5 | -9.1 | |
| SDP–Liberal Alliance | D. Wilkinson | 1,418 | 41.5 | +9.1 | |
| Majority | 581 | 17.0 | -18.2 | ||
| Turnout | 3,417 | 34.2 | +3.5 | ||
| Labour hold | Swing | -9.1 | |||
| Party | Candidate | Votes | % | ± | |
|---|---|---|---|---|---|
| Labour | H. Antill | 1,834 | 57.2 | -17.0 | |
| SDP–Liberal Alliance | J. McGarty | 929 | 29.0 | +13.7 | |
| Conservative | R. Gibson | 44.2 | 13.8 | +3.2 | |
| Majority | 905 | 28.2 | -30.7 | ||
| Turnout | 3,205 | 36.1 | +4.2 | ||
| Labour hold | Swing | -15.3 | |||
| Party | Candidate | Votes | % | ± | |
|---|---|---|---|---|---|
| Labour | J. Foster | 2,709 | 72.9 | -5.9 | |
| Conservative | R. Clayton | 560 | 15.1 | +3.8 | |
| SDP–Liberal Alliance | W. Claypole | 448 | 12.0 | +2.0 | |
| Majority | 2,149 | 57.8 | -9.7 | ||
| Turnout | 3,717 | 37.5 | +3.7 | ||
| Labour hold | Swing | -4.8 | |||
| Party | Candidate | Votes | % | ± | |
|---|---|---|---|---|---|
| Independent Labour | E. Edwardson | 1,894 | 54.2 | N/A | |
| Labour | M. O'Halloran | 1,140 | 32.6 | N/A | |
| SDP–Liberal Alliance | S. Galeazzi | 459 | 13.1 | N/A | |
| Majority | 754 | 21.6 | N/A | ||
| Turnout | 3,493 | 36.4 | N/A | ||
| Independent Labour gain from Labour | Swing | N/A | |||
| Party | Candidate | Votes | % | ± | |
|---|---|---|---|---|---|
| Labour | R. McAllister | 2,275 | 72.1 | N/A | |
| SDP–Liberal Alliance | J. Cranfield | 880 | 27.9 | N/A | |
| Majority | 1,395 | 44.2 | N/A | ||
| Turnout | 3,155 | 28.2 | N/A | ||
| Labour hold | Swing | N/A | |||
| Party | Candidate | Votes | % | ± | |
|---|---|---|---|---|---|
| Labour | S. Little | 2,189 | 64.0 | -9.3 | |
| SDP–Liberal Alliance | S. Jones | 1,232 | 36.0 | +9.3 | |
| Majority | 957 | 28.0 | -18.7 | ||
| Turnout | 3,421 | 32.0 | +3.6 | ||
| Labour hold | Swing | -9.3 | |||
| Party | Candidate | Votes | % | ± | |
|---|---|---|---|---|---|
| Labour | L. Birtles | 1,976 | 55.8 | -10.2 | |
| Conservative | E. Manson | 1,103 | 31.2 | -2.7 | |
| SDP–Liberal Alliance | G. Pullin | 460 | 13.0 | +13.0 | |
| Majority | 873 | 24.7 | -7.5 | ||
| Turnout | 3,539 | 36.2 | +1.8 | ||
| Labour hold | Swing | -3.7 | |||
| Party | Candidate | Votes | % | ± | |
|---|---|---|---|---|---|
| Labour | D. Molyneaux | 2,385 | 87.7 | -1.2 | |
| SDP–Liberal Alliance | A. Robinson | 172 | 6.3 | +0.5 | |
| Conservative | D. Edwards | 161 | 5.9 | +0.7 | |
| Majority | 2,213 | 81.4 | -1.7 | ||
| Turnout | 2,718 | 34.0 | +0.6 | ||
| Labour hold | Swing | -0.8 | |||
| Party | Candidate | Votes | % | ± | |
|---|---|---|---|---|---|
| SDP–Liberal Alliance | S. Jeffers | 2,220 | 44.4 | -2.6 | |
| Labour | S. Turner | 1,945 | 38.9 | -4.6 | |
| Conservative | J. Wolstenholme | 839 | 16.8 | +7.2 | |
| Majority | 275 | 5.5 | +2.0 | ||
| Turnout | 5,004 | 46.3 | -0.9 | ||
| SDP–Liberal Alliance hold | Swing | +1.0 | |||
| Party | Candidate | Votes | % | ± | |
|---|---|---|---|---|---|
| Labour | Unopposed | N/A | N/A | ||
| Labour hold | Swing | N/A | |||
| Party | Candidate | Votes | % | ± | |
|---|---|---|---|---|---|
| Labour | D. Caley | 1,857 | 61.6 | -12.4 | |
| Conservative | M. Turner | 722 | 24.0 | -1.9 | |
| SDP–Liberal Alliance | P. Claypole | 433 | 14.4 | +14.4 | |
| Majority | 1,135 | 37.7 | -10.5 | ||
| Turnout | 3,012 | 29.3 | +1.6 | ||
| Labour hold | Swing | -5.2 | |||
| Party | Candidate | Votes | % | ± | |
|---|---|---|---|---|---|
| Labour | B. Strett | 2,406 | 58.6 | -8.9 | |
| Conservative | G. Jackson | 1,071 | 26.1 | +7.6 | |
| SDP–Liberal Alliance | J. Wilson | 628 | 15.3 | +1.2 | |
| Majority | 1,335 | 32.5 | -16.5 | ||
| Turnout | 4,105 | 38.9 | -2.9 | ||
| Labour hold | Swing | -8.2 | |||
| Party | Candidate | Votes | % | ± | |
|---|---|---|---|---|---|
| Labour | M. Milligan | 2,406 | 77.0 | -7.0 | |
| Conservative | I. Nicholson | 419 | 13.4 | +4.8 | |
| SDP–Liberal Alliance | W. Hewer | 300 | 9.6 | +2.2 | |
| Majority | 1,987 | 63.6 | -11.8 | ||
| Turnout | 3,125 | 34.5 | +3.0 | ||
| Labour hold | Swing | -5.9 | |||
| Party | Candidate | Votes | % | ± | |
|---|---|---|---|---|---|
| Labour | J. Smith | 2,544 | 85.5 | -2.7 | |
| SDP–Liberal Alliance | R. Richardson | 231 | 7.8 | +1.0 | |
| Conservative | J. Carrington | 200 | 6.7 | +1.7 | |
| Majority | 2,313 | 77.7 | -3.7 | ||
| Turnout | 2,975 | 37.5 | +2.1 | ||
| Labour hold | Swing | -1.8 | |||
| Party | Candidate | Votes | % | ± | |
|---|---|---|---|---|---|
| Labour | R. Capstick | 1,946 | 46.4 | -0.3 | |
| Conservative | D. Patmore | 1,346 | 32.1 | +10.2 | |
| SDP–Liberal Alliance | N. Somers | 903 | 21.5 | -9.9 | |
| Majority | 600 | 14.3 | -0.8 | ||
| Turnout | 4,195 | 40.8 | +1.2 | ||
| Labour hold | Swing | -5.2 | |||
| Party | Candidate | Votes | % | ± | |
|---|---|---|---|---|---|
| Conservative | M. Dowling | 1,908 | 40.0 | +1.8 | |
| Labour | M. Gallagher | 1,767 | 37.0 | +0.4 | |
| SDP–Liberal Alliance | C. Rhys | 1,096 | 23.0 | -2.2 | |
| Majority | 141 | 2.9 | +1.3 | ||
| Turnout | 4,771 | 53.0 | +5.5 | ||
| Conservative gain from Labour | Swing | +0.7 | |||
| Party | Candidate | Votes | % | ± | |
|---|---|---|---|---|---|
| Labour | C. Hopkinson | 2,104 | 56.0 | -5.6 | |
| SDP–Liberal Alliance | A. Shaw | 1,653 | 44.0 | +5.6 | |
| Majority | 451 | 12.0 | -11.1 | ||
| Turnout | 3,757 | 35.7 | -3.6 | ||
| Labour gain from SDP–Liberal Alliance | Swing | -5.6 | |||
| Party | Candidate | Votes | % | ± | |
|---|---|---|---|---|---|
| Labour | M. Pendleton | 2,448 | 77.0 | -2.9 | |
| Conservative | F. Sidebotham | 387 | 12.2 | +3.8 | |
| SDP–Liberal Alliance | D. Armstrong | 342 | 10.7 | -0.9 | |
| Majority | 2,061 | 64.9 | -3.4 | ||
| Turnout | 3,177 | 36.0 | +0.5 | ||
| Labour hold | Swing | -3.3 | |||
| Party | Candidate | Votes | % | ± | |
|---|---|---|---|---|---|
| SDP–Liberal Alliance | J. Fitzpatrick | 2,171 | 44.8 | +1.1 | |
| Labour | G. Taberner | 2,049 | 42.2 | -4.0 | |
| Conservative | N. Edmond | 630 | 13.0 | +2.9 | |
| Majority | 122 | 2.5 | -0.0 | ||
| Turnout | 4,850 | 42.2 | +2.1 | ||
| SDP–Liberal Alliance gain from Labour | Swing | +2.5 | |||
| Party | Candidate | Votes | % | ± | |
|---|---|---|---|---|---|
| Labour | B. Baldwin | 2,304 | 73.7 | -10.5 | |
| SDP–Liberal Alliance | B. Pryle | 529 | 16.9 | +1.2 | |
| Conservative | C. Michaels | 292 | 9.3 | +9.3 | |
| Majority | 1,775 | 56.8 | -11.7 | ||
| Turnout | 3,125 | 31.5 | +3.8 | ||
| Labour hold | Swing | -5.8 | |||
References
| Metropolitan boroughs |
|
|---|---|
| District councils (England) |
|
| District councils (Wales) |
|
| |
| Mayor | |
|---|---|
| Bolton | |
| Bury | |
| Manchester | |
| Oldham | |
| Rochdale | |
| Salford | |
| Stockport | |
| Tameside | |
| Trafford | |
| Wigan | |
| County Council |
|
| |