Wigan Metropolitan Borough Council election, 1984
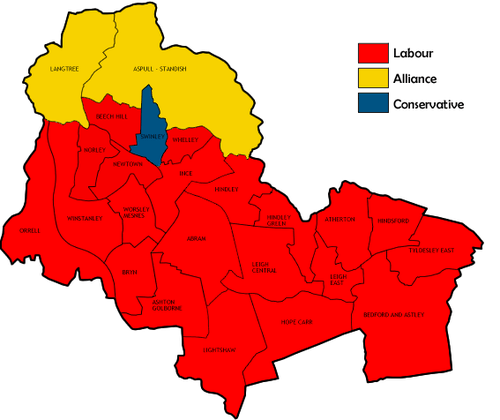
Elections to the Wigan council were held on Thursday, 3 May 1984, with one third of the seats up for vote. Three wards – Abram, Hindley and Lightshaw – were unopposed, leaving only twenty one of the twenty four wards going to vote – a number not seen since 1975. Also of note was the re-emergence of a fourth party, in the way of persistent Communist candidate H. Kedward contesting Leigh Central after a three-year absence. The election itself seen a Labour gain in Orrell from the Conservatives, which cancelled out the simultaneous Alliance gain from Labour in Aspell-Standish, leaving their majority unchanged. Overall turnout slumped to 29.2%, the lowest level since the aforementioned 1975 election.[1]
Election result
| Wigan Local Election Result 1984 | ||||||||||
|---|---|---|---|---|---|---|---|---|---|---|
| Party | Seats | Gains | Losses | Net gain/loss | Seats % | Votes % | Votes | +/− | ||
| Labour | 21 | 1 | 1 | 0 | 87.5 | 62.2 | 43,977 | +5.2% | ||
| SDP–Liberal Alliance | 2 | 1 | 0 | +1 | 8.3 | 19.6 | 13,856 | -6.3% | ||
| Conservative | 1 | 0 | 1 | -1 | 4.2 | 18.0 | 12,762 | +0.9% | ||
| Communist | 0 | 0 | 0 | 0 | 0.0 | 0.1 | 59 | +0.1% | ||
This result had the following consequences for the total number of seats on the Council after the elections:
| Party | Previous council | New council | |||
|---|---|---|---|---|---|
| Labour | 60 | 60 | |||
| SDP-Liberal Alliance | 7 | 8 | |||
| Conservatives | 5 | 4 | |||
| Total | 72 | 72 | |||
| Working majority | 48 | 48 | |||
Ward results
| Party | Candidate | Votes | % | ± | |
|---|---|---|---|---|---|
| Labour | A. Bennett | Unopposed | N/A | N/A | |
| Labour hold | Swing | N/A | |||
| Party | Candidate | Votes | % | ± | |
|---|---|---|---|---|---|
| Labour | T. Jones | 1,857 | 66.2 | +2.4 | |
| Conservative | M. Fox | 488 | 17.4 | +17.4 | |
| SDP–Liberal Alliance | A. Howarth | 460 | 16.4 | -19.8 | |
| Majority | 1,369 | 48.8 | 21.2 | ||
| Turnout | 2,805 | 29.4 | -1.3 | ||
| Labour hold | Swing | -7.5 | |||
| Party | Candidate | Votes | % | ± | |
|---|---|---|---|---|---|
| SDP–Liberal Alliance | P. Wilson | 2,274 | 44.1 | +3.5 | |
| Labour | J. Hilton | 2,149 | 41.7 | +0.8 | |
| Conservative | P. Walker | 728 | 14.1 | -4.3 | |
| Majority | 125 | 2.4 | +2.2 | ||
| Turnout | 5,151 | 50.9 | -1.8 | ||
| SDP–Liberal Alliance gain from Labour | Swing | +1.3 | |||
| Party | Candidate | Votes | % | ± | |
|---|---|---|---|---|---|
| Labour | J. Clarke | 2,921 | 79.1 | +6.2 | |
| Conservative | M. Hatton | 770 | 20.9 | +4.3 | |
| Majority | 2,151 | 58.3 | +1.9 | ||
| Turnout | 3,691 | 38.8 | +0.5 | ||
| Labour hold | Swing | +0.9 | |||
| Party | Candidate | Votes | % | ± | |
|---|---|---|---|---|---|
| Labour | J. Jones | 2,039 | 54.5 | +7.4 | |
| Conservative | F. Hawley | 1,036 | 27.7 | +0.9 | |
| SDP–Liberal Alliance | R. Mateer | 668 | 17.8 | -8.3 | |
| Majority | 1,003 | 26.8 | +6.5 | ||
| Turnout | 3,743 | 38.4 | -2.1 | ||
| Labour hold | Swing | +3.2 | |||
| Party | Candidate | Votes | % | ± | |
|---|---|---|---|---|---|
| Labour | T. Bishop | 1,963 | 69.0 | +11.4 | |
| SDP–Liberal Alliance | G. Pullin | 483 | 17.0 | -1.0 | |
| Conservative | J. Wolstenholme | 397 | 14.0 | -10.3 | |
| Majority | 1,480 | 52.1 | +21.7 | ||
| Turnout | 2,843 | 32.1 | -6.6 | ||
| Labour hold | Swing | +6.2 | |||
| Party | Candidate | Votes | % | ± | |
|---|---|---|---|---|---|
| Labour | G. Lockett | 2,355 | 72.6 | +6.5 | |
| SDP–Liberal Alliance | D. Seary | 480 | 14.8 | -19.1 | |
| Conservative | C. Michaels | 408 | 12.6 | +12.6 | |
| Majority | 1,875 | 57.8 | +25.6 | ||
| Turnout | 3,243 | 32.9 | -6.9 | ||
| Labour hold | Swing | +12.8 | |||
| Party | Candidate | Votes | % | ± | |
|---|---|---|---|---|---|
| Labour | A. Robinson | Unopposed | N/A | N/A | |
| Labour hold | Swing | N/A | |||
| Party | Candidate | Votes | % | ± | |
|---|---|---|---|---|---|
| Labour | S. Murphy | 2,387 | 77.8 | +30.7 | |
| SDP–Liberal Alliance | M. O'Halloran | 681 | 22.2 | -3.9 | |
| Majority | 1,706 | 55.6 | +35.3 | ||
| Turnout | 3,068 | 28.4 | -12.1 | ||
| Labour hold | Swing | +17.3 | |||
| Party | Candidate | Votes | % | ± | |
|---|---|---|---|---|---|
| Labour | W. Smith | 2,545 | 81.9 | +15.7 | |
| Conservative | C. Rigby | 561 | 18.1 | +18.1 | |
| Majority | 1,984 | 63.9 | +31.5 | ||
| Turnout | 3,106 | 29.3 | -3.3 | ||
| Labour hold | Swing | -1.2 | |||
| Party | Candidate | Votes | % | ± | |
|---|---|---|---|---|---|
| Labour | A. Roberts | 2,179 | 60.8 | +6.1 | |
| Conservative | E. Manson | 1,122 | 31.3 | -1.5 | |
| SDP–Liberal Alliance | L. Seal | 284 | 7.9 | -4.5 | |
| Majority | 1,057 | 29.5 | +7.6 | ||
| Turnout | 3,585 | 37.4 | -5.2 | ||
| Labour hold | Swing | +3.8 | |||
| Party | Candidate | Votes | % | ± | |
|---|---|---|---|---|---|
| Labour | A. Banks | 2,017 | 89.2 | +7.0 | |
| SDP–Liberal Alliance | A. Robinson | 244 | 10.8 | -7.0 | |
| Majority | 1,773 | 78.4 | +14.0 | ||
| Turnout | 2,261 | 28.2 | -9.8 | ||
| Labour hold | Swing | +7.0 | |||
| Party | Candidate | Votes | % | ± | |
|---|---|---|---|---|---|
| SDP–Liberal Alliance | J. Pigott | 2,053 | 45.2 | -3.6 | |
| Labour | T. O'Hagan | 1,762 | 38.8 | +6.7 | |
| Conservative | R. Gibson | 723 | 15.9 | -3.1 | |
| Majority | 291 | 6.4 | -10.2 | ||
| Turnout | 4,538 | 43.7 | +2.1 | ||
| SDP–Liberal Alliance hold | Swing | -5.1 | |||
| Party | Candidate | Votes | % | ± | |
|---|---|---|---|---|---|
| Labour | G. Macdonald | 2,164 | 81.1 | +7.1 | |
| Conservative | S. Emerton | 445 | 16.7 | +1.0 | |
| Communist | H. Kedward | 59 | 2.2 | +2.2 | |
| Majority | 1,719 | 64.4 | +6.1 | ||
| Turnout | 2,668 | 29.5 | -3.0 | ||
| Labour hold | Swing | +3.0 | |||
| Party | Candidate | Votes | % | ± | |
|---|---|---|---|---|---|
| Labour | J. Riley | 1,914 | 64.0 | +11.3 | |
| Conservative | M. Stewart | 830 | 27.7 | -0.2 | |
| SDP–Liberal Alliance | I. Smith | 248 | 8.3 | -11.1 | |
| Majority | 1,084 | 36.2 | +11.5 | ||
| Turnout | 2,992 | 29.8 | -5.4 | ||
| Labour hold | Swing | +5.7 | |||
| Party | Candidate | Votes | % | ± | |
|---|---|---|---|---|---|
| Labour | N. Holt | Unopposed | N/A | N/A | |
| Labour hold | Swing | N/A | |||
| Party | Candidate | Votes | % | ± | |
|---|---|---|---|---|---|
| Labour | A. Peet | 2,195 | 80.1 | +7.8 | |
| Conservative | J. Lawson | 357 | 13.0 | -1.8 | |
| SDP–Liberal Alliance | W. Hewer | 189 | 6.9 | -6.0 | |
| Majority | 1,838 | 67.1 | +9.5 | ||
| Turnout | 2,741 | 29.9 | -3.8 | ||
| Labour hold | Swing | +4.8 | |||
| Party | Candidate | Votes | % | ± | |
|---|---|---|---|---|---|
| Labour | E. Maddocks | 2,444 | 88.2 | +9.6 | |
| Conservative | J. Davies | 168 | 6.1 | +0.4 | |
| SDP–Liberal Alliance | R. Richardson | 158 | 5.7 | -10.0 | |
| Majority | 2,276 | 82.2 | +19.3 | ||
| Turnout | 2,770 | 33.1 | -3.7 | ||
| Labour hold | Swing | +5.0 | |||
| Party | Candidate | Votes | % | ± | |
|---|---|---|---|---|---|
| Labour | E. Swift | 1,576 | 43.6 | +2.3 | |
| Conservative | F. Fairbairn | 1,414 | 39.1 | +0.1 | |
| SDP–Liberal Alliance | C. Hughes | 627 | 17.3 | -2.4 | |
| Majority | 162 | 4.5 | +2.2 | ||
| Turnout | 3,617 | 35.5 | -6.6 | ||
| Labour gain from Conservative | Swing | +1.1 | |||
| Party | Candidate | Votes | % | ± | |
|---|---|---|---|---|---|
| Conservative | C. Bond | 1,637 | 43.9 | -2.1 | |
| Labour | P. Lees | 1,395 | 37.4 | +3.7 | |
| SDP–Liberal Alliance | E. Parkin | 697 | 18.7 | -1.5 | |
| Majority | 242 | 6.5 | -5.8 | ||
| Turnout | 3,729 | 41.0 | -3.6 | ||
| Conservative hold | Swing | -2.9 | |||
| Party | Candidate | Votes | % | ± | |
|---|---|---|---|---|---|
| Labour | J. Teece | 1,986 | 47.0 | +1.8 | |
| SDP–Liberal Alliance | B. Aitken | 1,783 | 42.2 | -12.6 | |
| Conservative | E. Griffiths | 457 | 10.8 | +10.8 | |
| Majority | 203 | 4.8 | -4.9 | ||
| Turnout | 4,226 | 42.6 | -1.0 | ||
| Labour hold | Swing | +7.2 | |||
| Party | Candidate | Votes | % | ± | |
|---|---|---|---|---|---|
| Labour | A. Coyle | 2,224 | 76.5 | +12.4 | |
| Conservative | F. Sidebotham | 362 | 12.4 | -0.8 | |
| SDP–Liberal Alliance | K. Latham | 322 | 11.1 | -11.6 | |
| Majority | 1,862 | 64.0 | +22.7 | ||
| Turnout | 2,908 | 32.8 | -5.5 | ||
| Labour hold | Swing | +6.6 | |||
| Party | Candidate | Votes | % | ± | |
|---|---|---|---|---|---|
| Labour | J. Whittle | 1,798 | 43.6 | +4.0 | |
| SDP–Liberal Alliance | H. Evans | 1,757 | 42.6 | +5.9 | |
| Conservative | C. Mugan | 570 | 13.8 | -9.9 | |
| Majority | 41 | 1.0 | -1.9 | ||
| Turnout | 4,125 | 37.9 | -3.3 | ||
| Labour hold | Swing | -0.9 | |||
| Party | Candidate | Votes | % | ± | |
|---|---|---|---|---|---|
| Labour | W. Brogan | 2,107 | 74.1 | +7.3 | |
| SDP–Liberal Alliance | A. Meal | 448 | 15.8 | -5.6 | |
| Conservative | F. Hesketh | 289 | 10.2 | -1.7 | |
| Majority | 1,659 | 58.3 | +13.0 | ||
| Turnout | 2,844 | 29.2 | -6.9 | ||
| Labour hold | Swing | +6.4 | |||
References
| Metropolitan boroughs |
|
|---|---|
| District councils (England) |
|
| District councils (Scotland) |
|
| |
| Mayor | |
|---|---|
| Bolton | |
| Bury | |
| Manchester | |
| Oldham | |
| Rochdale | |
| Salford | |
| Stockport | |
| Tameside | |
| Trafford | |
| Wigan | |
| County Council |
|
| |