Wigan Metropolitan Borough Council election, 1990
Elections to the Wigan council were held on Thursday, 3 May 1990, with one third of the seats up for election with an additional vacancy in Bryn. Previous to the election there had also been a by-election in Abram, which the Labour Party successfully defended. Despite a wider array of parties - mainly a product from the fractious SLD merger - contesting the election, in several ways it beat 1986's lows in participation. A record of six seats went uncontested as one quarter of the council's wards held no elections, with the Conservatives contesting one half of the wards (an all-time low) and the SLD one quarter (the lowest since 1979). The Greens repeated their last year's total of four candidates, but with only two in the same wards as previous. Elsewhere, Independent John Vickers fought his first of many elections in Hindley Green and the respective Social Democrat and Liberal sides opposed to Alliance merging into the SLD fielded a sole candidate each - the latter of which having previously came within a straw of winning Langtree for the SLD.
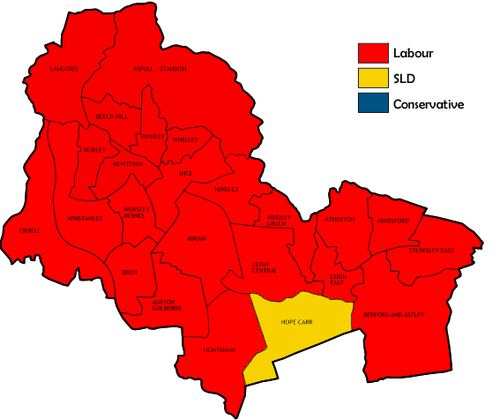
The night seen numerous surprising gains, with Labour gaining another seat in the SLD bastion of Langtree, and for the first time, in the Conservative's bastion of Swinley, whilst the SLD managed its own breakthrough in the Labour territory of Hope Carr. With dwindling hopes of ever regaining Orrell, Swinley had become the Conservative's bulwark in recent years, and the Labour gain here raised the prospects of Conservative representation being removed altogether from the council. The loss of Hope Carr denied Labour a clean-sweep, but they managed an all-time high of winning all-but-one of the wards, and bettering their last year's record in voter share. Overall turnout in those wards contesting rose to a local elections high (with the 1979 election omitted for coinciding with the general election) of 39.4%.[1]
Election result
| Wigan Local Election Result 1990 | ||||||||||
|---|---|---|---|---|---|---|---|---|---|---|
| Party | Seats | Gains | Losses | Net gain/loss | Seats % | Votes % | Votes | +/− | ||
| Labour | 24 | 2 | 1 | +1 | 96.0 | 69.2 | 48,633 | +0.6% | ||
| Social and Liberal Democrats | 1 | 1 | 1 | 0 | 4.0 | 11.2 | 7,852 | -1.4% | ||
| Conservative | 0 | 0 | 1 | -1 | 0.0 | 13.2 | 9,288 | -3.9% | ||
| Green | 0 | 0 | 0 | 0 | 0.0 | 3.3 | 2,320 | +1.8% | ||
| Liberal | 0 | 0 | 0 | 0 | 0.0 | 1.6 | 1,153 | +1.6% | ||
| Independent | 0 | 0 | 0 | 0 | 0.0 | 0.9 | 663 | +0.9% | ||
| Social Democratic | 0 | 0 | 0 | 0 | 0.0 | 0.5 | 391 | +0.5% | ||
This result had the following consequences for the total number of seats on the Council after the elections:
| Party | Previous council | New council | |||
|---|---|---|---|---|---|
| Labour | 63 | 64 | |||
| Social and Liberal Democrats | 5 | 5 | |||
| Conservatives | 3 | 2 | |||
| Independent Labour | 1 | 1 | |||
| Green | 0 | 0 | |||
| Liberal | 0 | 0 | |||
| Independent | 0 | 0 | |||
| Social Democrat | 0 | 0 | |||
| Total | 72 | 72 | |||
| Working majority | 54 | 56 | |||
Ward results
| Party | Candidate | Votes | % | ± | |
|---|---|---|---|---|---|
| Labour | J. Tiernan | Unopposed | N/A | N/A | |
| Labour hold | Swing | N/A | |||
| Party | Candidate | Votes | % | ± | |
|---|---|---|---|---|---|
| Labour | S. Lea | 2,844 | 79.0 | +0.8 | |
| Conservative | I. Cunliffe | 756 | 21.0 | -0.8 | |
| Majority | 2,088 | 58.0 | +1.7 | ||
| Turnout | 3,600 | 36.7 | +8.7 | ||
| Labour hold | Swing | +0.8 | |||
| Party | Candidate | Votes | % | ± | |
|---|---|---|---|---|---|
| Labour | J. Hilton | 2,681 | 53.3 | +5.4 | |
| Social and Liberal Democrats | D. Brown | 1,518 | 30.2 | -5.6 | |
| Conservative | J. Carrington | 831 | 16.5 | +0.2 | |
| Majority | 1,163 | 23.1 | +11.0 | ||
| Turnout | 5,030 | 46.1 | +2.6 | ||
| Labour hold | Swing | +5.5 | |||
| Party | Candidate | Votes | % | ± | |
|---|---|---|---|---|---|
| Labour | L. Sumner | 2,594 | 80.3 | -1.5 | |
| Green | S. Bickerton | 636 | 19.7 | +19.7 | |
| Majority | 1,958 | 60.6 | -3.0 | ||
| Turnout | 3,230 | 35.3 | -0.6 | ||
| Labour hold | Swing | -10.6 | |||
| Party | Candidate | Votes | % | ± | |
|---|---|---|---|---|---|
| Labour | F. Walker | 2,380 | 70.4 | +7.9 | |
| Green | I. Graham | 998 | 29.5 | +19.6 | |
| Majority | 1,382 | 40.9 | +5.9 | ||
| Turnout | 3,378 | 33.9 | +2.4 | ||
| Labour hold | Swing | -5.8 | |||
| Party | Candidate | Votes | % | ± | |
|---|---|---|---|---|---|
| Labour | T. Bishop | 2,095 | 51.1 | +6.3 | |
| Social and Liberal Democrats | V. Milton | 2,001 | 48.8 | +1.1 | |
| Majority | 94 | 2.3 | -0.6 | ||
| Turnout | 4,096 | 46.5 | +5.6 | ||
| Labour hold | Swing | +2.6 | |||
| Party | Candidate | Votes | % | ± | |
|---|---|---|---|---|---|
| Labour | A. Melling | 2,783 | 80.7 | -1.2 | |
| Labour | M. Millington | 2,411 | |||
| Conservative | B. Smith | 663 | 19.2 | +1.2 | |
| Majority | 2,120 | 61.5 | -2.4 | ||
| Turnout | 3,446 | 34.8 | +3.6 | ||
| Labour hold | Swing | ||||
| Labour hold | Swing | -1.2 | |||
| Party | Candidate | Votes | % | ± | |
|---|---|---|---|---|---|
| Labour | G. Green | 2,656 | 74.7 | -12.5 | |
| Social and Liberal Democrats | C. Barton | 558 | 15.7 | +15.7 | |
| Green | A. Wood | 342 | 9.6 | -3.2 | |
| Majority | 2,098 | 59.0 | -15.3 | ||
| Turnout | 3,556 | 36.9 | +8.4 | ||
| Labour hold | Swing | -14.1 | |||
| Party | Candidate | Votes | % | ± | |
|---|---|---|---|---|---|
| Labour | W. Simmons | 2,741 | 72.2 | -8.3 | |
| Independent | J. Vickers | 663 | 17.5 | +17.5 | |
| Social Democratic | V. Norris | 391 | 10.3 | +10.3 | |
| Majority | 2,078 | 54.7 | -6.4 | ||
| Turnout | 3,795 | 32.6 | +8.5 | ||
| Labour hold | Swing | -12.9 | |||
| Party | Candidate | Votes | % | ± | |
|---|---|---|---|---|---|
| Labour | A. Wright | Unopposed | N/A | N/A | |
| Labour hold | Swing | N/A | |||
| Party | Candidate | Votes | % | ± | |
|---|---|---|---|---|---|
| Social and Liberal Democrats | E. Herdman | 1,956 | 51.1 | +51.1 | |
| Labour | P. Culshaw | 1,870 | 48.9 | -14.1 | |
| Majority | 86 | 2.2 | -23.7 | ||
| Turnout | 3,826 | 37.8 | +4.6 | ||
| Social and Liberal Democrats gain from Labour | Swing | +32.6 | |||
| Party | Candidate | Votes | % | ± | |
|---|---|---|---|---|---|
| Labour | T. Davies | Unopposed | N/A | N/A | |
| Labour hold | Swing | N/A | |||
| Party | Candidate | Votes | % | ± | |
|---|---|---|---|---|---|
| Labour | J. O'Neill | 2,606 | 49.4 | +7.6 | |
| Liberal | K. White | 1,153 | 21.8 | +21.8 | |
| Social and Liberal Democrats | A. Robinson | 899 | 17.0 | -24.8 | |
| Conservative | J. Wolstenholme | 618 | 11.7 | -4.6 | |
| Majority | 1,453 | 27.5 | +27.5 | ||
| Turnout | 5,276 | 47.0 | +4.9 | ||
| Labour gain from Social and Liberal Democrats | Swing | -7.1 | |||
| Party | Candidate | Votes | % | ± | |
|---|---|---|---|---|---|
| Labour | P. Smith | Unopposed | N/A | N/A | |
| Labour hold | Swing | N/A | |||
| Party | Candidate | Votes | % | ± | |
|---|---|---|---|---|---|
| Labour | T. Harper | Unopposed | N/A | N/A | |
| Labour hold | Swing | N/A | |||
| Party | Candidate | Votes | % | ± | |
|---|---|---|---|---|---|
| Labour | T. Sherratt | 3,538 | 75.9 | +2.6 | |
| Conservative | S. Hide | 1,122 | 24.1 | +5.6 | |
| Majority | 2,416 | 51.8 | -3.0 | ||
| Turnout | 4,660 | 43.8 | +7.0 | ||
| Labour hold | Swing | -1.5 | |||
| Party | Candidate | Votes | % | ± | |
|---|---|---|---|---|---|
| Labour | K. Pye | 3,254 | 89.6 | +3.1 | |
| Conservative | J. Whitehead | 378 | 10.4 | -3.1 | |
| Majority | 2,876 | 79.2 | +6.2 | ||
| Turnout | 3,632 | 39.2 | +9.3 | ||
| Labour hold | Swing | +3.1 | |||
| Party | Candidate | Votes | % | ± | |
|---|---|---|---|---|---|
| Labour | N. Turner | 3,102 | 93.2 | +4.6 | |
| Conservative | G. Peach | 227 | 6.8 | +0.5 | |
| Majority | 2,875 | 86.3 | +4.2 | ||
| Turnout | 3,329 | 43.0 | +9.5 | ||
| Labour hold | Swing | +2.0 | |||
| Party | Candidate | Votes | % | ± | |
|---|---|---|---|---|---|
| Labour | G. Seaward | 2,719 | 68.0 | +8.2 | |
| Conservative | C. Michaels | 1,276 | 31.9 | -8.2 | |
| Majority | 1,443 | 36.1 | +16.3 | ||
| Turnout | 3,995 | 39.0 | +2.0 | ||
| Labour hold | Swing | +8.2 | |||
| Party | Candidate | Votes | % | ± | |
|---|---|---|---|---|---|
| Labour | S. Turner | 2,282 | 52.1 | +13.2 | |
| Conservative | C. Giles | 2,095 | 47.8 | -0.4 | |
| Majority | 187 | 4.3 | -5.1 | ||
| Turnout | 4,377 | 49.1 | +2.4 | ||
| Labour gain from Conservative | Swing | +6.8 | |||
| Party | Candidate | Votes | % | ± | |
|---|---|---|---|---|---|
| Labour | B. Wilson | Unopposed | N/A | N/A | |
| Labour hold | Swing | N/A | |||
| Party | Candidate | Votes | % | ± | |
|---|---|---|---|---|---|
| Labour | W. Pendleton | 2,686 | 78.9 | -2.5 | |
| Conservative | F. Sidebotham | 373 | 10.9 | -0.6 | |
| Green | J. Ford | 344 | 10.1 | +10.1 | |
| Majority | 2,313 | 68.0 | -1.9 | ||
| Turnout | 3,403 | 38.1 | +7.7 | ||
| Labour hold | Swing | -0.9 | |||
| Party | Candidate | Votes | % | ± | |
|---|---|---|---|---|---|
| Labour | W. Evans | 2,799 | 63.3 | +9.2 | |
| Social and Liberal Democrats | P. Mayston | 920 | 20.8 | -25.1 | |
| Conservative | J. Horswell | 701 | 15.8 | +15.8 | |
| Majority | 1,879 | 42.5 | +34.3 | ||
| Turnout | 4,420 | 37.5 | +5.4 | ||
| Labour hold | Swing | +17.1 | |||
| Party | Candidate | Votes | % | ± | |
|---|---|---|---|---|---|
| Labour | H. Milligan | 3,003 | 92.4 | +6.5 | |
| Conservative | J. Grimshaw | 248 | 7.6 | -6.5 | |
| Majority | 2,755 | 84.7 | +13.1 | ||
| Turnout | 3,251 | 33.1 | +7.8 | ||
| Labour hold | Swing | +6.5 | |||
References
| London boroughs |
|
|---|---|
| Metropolitan boroughs |
|
| District councils (England) |
|
| Regional councils (Scotland) |
|
| Mayor | |
|---|---|
| Bolton | |
| Bury | |
| Manchester | |
| Oldham | |
| Rochdale | |
| Salford | |
| Stockport | |
| Tameside | |
| Trafford | |
| Wigan | |
| County Council |
|
| |