Wigan Metropolitan Borough Council election, 1976
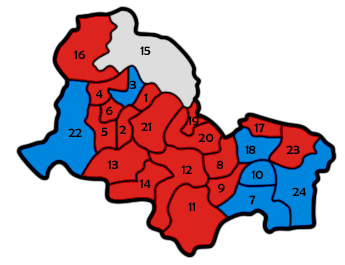
Map of the results for the 1976 Wigan council election. Labour in red, Conservatives in blue and Independent in grey.
Elections to Wigan Council were held on 6 May 1976, with one third of the seats up for election. Four Conservative gains and an Independent in Ward 23 regaining a seat reduced Labour's working majority to 40 seats. Two seats (Ward 4 and Ward 21) went uncontested, and turnout rose to 34.0% - a return to 1973 levels after a sizeable fall the previous year.[1]
Election result
| Wigan Local Election Result 1976 | ||||||||||
|---|---|---|---|---|---|---|---|---|---|---|
| Party | Seats | Gains | Losses | Net gain/loss | Seats % | Votes % | Votes | +/− | ||
| Labour | 17 | 0 | 5 | -5 | 70.8 | 51.3 | 35,499 | +2.1% | ||
| Conservative | 6 | 4 | 0 | +4 | 25.0 | 40.8 | 28,260 | +0.0% | ||
| Independent | 1 | 1 | 0 | +1 | 4.2 | 2.9 | 2,038 | +0.4% | ||
| Liberal | 0 | 0 | 0 | 0 | 0.0 | 3.9 | 2,732 | -2.9% | ||
| ER | 0 | 0 | 0 | 0 | 0.0 | 0.6 | 392 | +0.6% | ||
| Communist | 0 | 0 | 0 | 0 | 0.0 | 0.4 | 309 | -0.3% | ||
This result had the following consequences for the total number of seats on the Council after the elections:
| Party | Previous council | New council | |||
|---|---|---|---|---|---|
| Labour | 61 | 56 | |||
| Conservatives | 10 | 14 | |||
| Liberals | 1 | 1 | |||
| Independent | 0 | 1 | |||
| Total | 72 | 72 | |||
| Working majority | 50 | 40 | |||
Ward results
| Party | Candidate | Votes | % | ± | |
|---|---|---|---|---|---|
| Labour | A. Coyle | 1,927 | 63.1 | -1.0 | |
| Conservative | C. Giles | 1,126 | 36.9 | +1.0 | |
| Majority | 801 | 26.2 | -2.0 | ||
| Turnout | 3,053 | 33.1 | +4.1 | ||
| Labour hold | Swing | -1.0 | |||
| Party | Candidate | Votes | % | ± | |
|---|---|---|---|---|---|
| Labour | H. Milligan | 1,419 | 62.5 | -3.0 | |
| Conservative | J. Atherton | 536 | 23.6 | -10.8 | |
| Liberal | J. Forster | 314 | 13.8 | +13.8 | |
| Majority | 883 | 38.9 | +7.7 | ||
| Turnout | 2,269 | 24.7 | +7.6 | ||
| Labour hold | Swing | +3.9 | |||
| Party | Candidate | Votes | % | ± | |
|---|---|---|---|---|---|
| Conservative | G. Lewthwaite | 2,655 | 69.2 | +4.7 | |
| Labour | M. Pendleton | 1,187 | 30.8 | +7.8 | |
| Majority | 1,478 | 38.4 | -3.1 | ||
| Turnout | 3,852 | 33.4 | +1.1 | ||
| Conservative hold | Swing | -1.5 | |||
| Party | Candidate | Votes | % | ± | |
|---|---|---|---|---|---|
| Labour | A. Eckersley | Unopposed | N/A | N/A | |
| Labour hold | Swing | N/A | |||
| Party | Candidate | Votes | % | ± | |
|---|---|---|---|---|---|
| Labour | E. Maddocks | 1,544 | 53.4 | +2.3 | |
| Conservative | T. Peet | 1,348 | 46.6 | +4.4 | |
| Majority | 196 | 6.8 | -2.1 | ||
| Turnout | 2,892 | 26.4 | +4.9 | ||
| Labour hold | Swing | -1.0 | |||
| Party | Candidate | Votes | % | ± | |
|---|---|---|---|---|---|
| Labour | J. Bridge | 1,483 | 62.0 | -6.5 | |
| Conservative | M. Wright | 670 | 28.0 | -3.5 | |
| Liberal | J. Fitzpatrick | 240 | 10.0 | +10.0 | |
| Majority | 813 | 34.0 | -3.0 | ||
| Turnout | 2,393 | 27.4 | +8.8 | ||
| Labour hold | Swing | -1.5 | |||
| Party | Candidate | Votes | % | ± | |
|---|---|---|---|---|---|
| Conservative | B. Powell | 1,770 | 56.2 | -3.1 | |
| Labour | J. Jones | 1,377 | 43.8 | +3.1 | |
| Majority | 393 | 12.5 | -6.4 | ||
| Turnout | 3,147 | 44.9 | +7.4 | ||
| Conservative gain from Labour | Swing | -3.1 | |||
| Party | Candidate | Votes | % | ± | |
|---|---|---|---|---|---|
| Labour | P. Hull | 1,336 | 58.9 | +3.4 | |
| Conservative | J. Davies | 842 | 37.1 | -1.3 | |
| Communist | H. Kedward | 92 | 4.1 | -2.1 | |
| Majority | 494 | 21.8 | +4.7 | ||
| Turnout | 2,270 | 25.8 | +9.0 | ||
| Labour hold | Swing | +2.3 | |||
| Party | Candidate | Votes | % | ± | |
|---|---|---|---|---|---|
| Labour | J. Riley | 1,674 | 51.6 | +10.2 | |
| Conservative | H. Davies | 1,477 | 45.5 | -9.1 | |
| Communist | J. Blackburn | 96 | 3.0 | -1.0 | |
| Majority | 197 | 6.1 | -7.2 | ||
| Turnout | 3,247 | 35.3 | +9.6 | ||
| Labour hold | Swing | +9.6 | |||
| Party | Candidate | Votes | % | ± | |
|---|---|---|---|---|---|
| Conservative | S. Johnson | 1,905 | 52.6 | -12.4 | |
| Labour | P. Smith | 1,595 | 44.0 | +9.0 | |
| Communist | M. Fitzpatrick | 121 | 3.3 | +3.3 | |
| Majority | 310 | 8.6 | -21.4 | ||
| Turnout | 3,621 | 40.1 | +8.8 | ||
| Conservative gain from Labour | Swing | -10.7 | |||
| Party | Candidate | Votes | % | ± | |
|---|---|---|---|---|---|
| Labour | T. Morgan | 2,409 | 58.7 | -0.1 | |
| Conservative | T. Thompson | 1,696 | 41.3 | +0.1 | |
| Majority | 713 | 17.4 | -0.2 | ||
| Turnout | 4,105 | 39.7 | +5.2 | ||
| Labour hold | Swing | -0.1 | |||
| Party | Candidate | Votes | % | ± | |
|---|---|---|---|---|---|
| Labour | M. Taylor | 2,395 | 70.2 | N/A | |
| Conservative | J. Harrison | 1,015 | 29.8 | N/A | |
| Majority | 1,380 | 40.5 | N/A | ||
| Turnout | 3,410 | 37.9 | N/A | ||
| Labour hold | Swing | N/A | |||
| Party | Candidate | Votes | % | ± | |
|---|---|---|---|---|---|
| Labour | G. Lockett | 1,648 | 67.6 | -4.8 | |
| Liberal | P. Scully | 789 | 32.4 | +4.8 | |
| Majority | 859 | 35.2 | -9.4 | ||
| Turnout | 2,437 | 32.0 | +10.3 | ||
| Labour hold | Swing | -4.8 | |||
| Party | Candidate | Votes | % | ± | |
|---|---|---|---|---|---|
| Labour | T. Jones | 1,655 | 52.4 | +3.8 | |
| Conservative | M. Ball | 915 | 29.0 | +29.0 | |
| Liberal | D. Gauld | 586 | 18.6 | -32.8 | |
| Majority | 740 | 23.4 | +20.6 | ||
| Turnout | 3,156 | 37.9 | +11.3 | ||
| Labour hold | Swing | -12.6 | |||
| Party | Candidate | Votes | % | ± | |
|---|---|---|---|---|---|
| Independent | G. Dewhurst | 1,534 | 36.0 | +1.5 | |
| Labour | J. Healen | 1,509 | 35.4 | -0.3 | |
| Conservative | M. Wardle | 1,222 | 28.7 | +8.6 | |
| Majority | 25 | 0.6 | -0.6 | ||
| Turnout | 4,265 | 38.8 | +3.6 | ||
| Independent gain from Labour | Swing | +0.9 | |||
| Party | Candidate | Votes | % | ± | |
|---|---|---|---|---|---|
| Labour | W. Mason | 1,540 | 45.1 | -14.0 | |
| Conservative | E. Slevin | 1,424 | 41.7 | +41.7 | |
| Liberal | P. Gibbons | 448 | 13.1 | -27.7 | |
| Majority | 116 | 3.4 | -15.0 | ||
| Turnout | 3,412 | 34.2 | +12.0 | ||
| Labour hold | Swing | -27.8 | |||
| Party | Candidate | Votes | % | ± | |
|---|---|---|---|---|---|
| Labour | L. Sumner | 2,121 | 66.5 | +12.4 | |
| Conservative | E. Sweeney | 1,068 | 33.5 | -3.1 | |
| Majority | 1,053 | 33.0 | +15.4 | ||
| Turnout | 3,189 | 33.5 | +3.7 | ||
| Labour hold | Swing | +7.7 | |||
| Party | Candidate | Votes | % | ± | |
|---|---|---|---|---|---|
| Conservative | M. Williams | 1,431 | 59.3 | -5.2 | |
| Labour | P. Needham | 981 | 40.7 | +5.2 | |
| Majority | 450 | 18.7 | -10.3 | ||
| Turnout | 2,412 | 37.7 | +7.6 | ||
| Conservative hold | Swing | -5.2 | |||
| Party | Candidate | Votes | % | ± | |
|---|---|---|---|---|---|
| Labour | T. Isherwood | 1,410 | 66.7 | +2.1 | |
| Conservative | R. Park | 704 | 33.3 | -2.1 | |
| Majority | 706 | 33.4 | +4.2 | ||
| Turnout | 2,114 | 28.1 | +5.9 | ||
| Labour hold | Swing | +2.1 | |||
| Party | Candidate | Votes | % | ± | |
|---|---|---|---|---|---|
| Labour | R. MacAllister | 1,573 | 49.8 | +1.5 | |
| Conservative | T. Whitfield | 1,231 | 39.0 | -12.7 | |
| Liberal | B. Slinger | 355 | 11.2 | +11.2 | |
| Majority | 342 | 10.8 | +7.3 | ||
| Turnout | 3,159 | 30.0 | +4.5 | ||
| Labour hold | Swing | +7.1 | |||
| Party | Candidate | Votes | % | ± | |
|---|---|---|---|---|---|
| Labour | A. Rowlandson | Unopposed | N/A | N/A | |
| Labour hold | Swing | N/A | |||
| Party | Candidate | Votes | % | ± | |
|---|---|---|---|---|---|
| Conservative | F. Garner | 1,897 | 44.1 | -19.2 | |
| Labour | S. Waring | 1,507 | 35.0 | -1.6 | |
| Independent | N. Somers | 504 | 11.7 | +11.7 | |
| ER | A. Atherton | 392 | 9.1 | +9.1 | |
| Majority | 390 | 9.1 | -17.5 | ||
| Turnout | 4,300 | 32.5 | -2.3 | ||
| Conservative gain from Labour | Swing | -8.8 | |||
| Party | Candidate | Votes | % | ± | |
|---|---|---|---|---|---|
| Labour | M. Devlin | 1,761 | 53.7 | -5.0 | |
| Conservative | F. Mellor | 1,516 | 46.3 | +5.0 | |
| Majority | 245 | 7.5 | -10.2 | ||
| Turnout | 3,277 | 38.5 | +9.1 | ||
| Labour hold | Swing | -5.0 | |||
| Party | Candidate | Votes | % | ± | |
|---|---|---|---|---|---|
| Conservative | C. Hampson | 1,802 | 55.4 | N/A | |
| Labour | F. Walker | 1,448 | 44.6 | N/A | |
| Majority | 354 | 10.9 | N/A | ||
| Turnout | 3,250 | 42.6 | N/A | ||
| Conservative gain from Labour | Swing | N/A | |||
References
| Metropolitan boroughs |
|
|---|---|
| District councils (England) |
|
| District councils (Wales) |
|
| Mayor | |
|---|---|
| Bolton | |
| Bury | |
| Manchester | |
| Oldham | |
| Rochdale | |
| Salford | |
| Stockport | |
| Tameside | |
| Trafford | |
| Wigan | |
| County Council |
|
| |
This article is issued from Wikipedia - version of the 10/19/2016. The text is available under the Creative Commons Attribution/Share Alike but additional terms may apply for the media files.