Belgian local elections, 2000
Belgian local elections, 2000
.svg.png)
|
| 8 October 2000 (2000-10-08) |
|
|
|

|
|
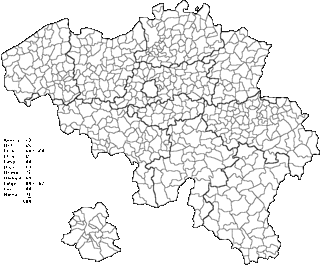
The Belgian provincial, municipal and district elections of 2000 took place on Sunday October 8, 2000. The electors elected the municipal councillors of 589 cities and towns (308 in the Flemish Region, 262 in the Walloon Region and 19 in the Brussels-Capital Region) as well as the ten provincial councils. Additionally, the newly established district councils in the city of Antwerp were elected for the first time.
Newly elected councillors took office in January 2001, with a six-year term ending in 2007. The next local elections took place on October 8, 2006.
Soon after this election, the federal government under Verhofstadt transferred the responsibility over local government to the three regional governments, including the responsibility of organising local elections.
Flanders
Provinces
Antwerp
Municipalities
| Antwerp |
| Party |
Votes |
% |
+/– |
Seats |
+/– |
|
Flemish Block | 89,213 | 32.95 | 4.92  | 20 | 2  |
|
SP | 52,760 | 19.49 | 0.97  | 12 | 1  |
|
VLD | 45,903 | 16.95 | 4.96  | 10 | 3  |
|
CVP | 30,096 | 11.12 | — | 6 | — |
|
Agalev | 29,966 | 11.07 | 1.97  | 6 | 1  |
|
VU–ID | 8,422 | 3.11 | — | 1 | — |
| Valid votes | 270,750 | 96.93 | |
| Blanco and invalid votes | 8,579 | 3.07 | |
| Total | 279,329 | 100.00 | 55 | |
| Electorate and voter turnout | 316,926 | 88.14 | |
| Ghent |
| Party |
Votes |
% |
+/– |
Seats |
+/– |
|
SP | 36,829 | 25.07 | 3.26  | 14 | 1  |
|
VLD | 30,895 | 21.03 | 0.69  | 11 | 2  |
|
Flemish Block | 28,699 | 19.54 | 6.88  | 11 | 4  |
|
CVP | 26,344 | 17.93 | 3.63  | 10 | 2  |
|
Agalev | 13,385 | 9.11 | 0.68  | 4 | 1  |
|
VU–ID | 5,828 | 3.97 | 3.97  | 1 | 0  |
|
Other parties | 4,910 | 3.34 | — | |
| Valid votes | 146,890 | 95.89 | |
| Blanco and invalid votes | 6,289 | 4.11 | |
| Total | 153,179 | 100.00 | | 51 | |
| Electorate and voter turnout | 168,441 | 90.94 | |
Wallonia
Provinces
- The Parti Réformateur Libéral participated in the election in an electoral coalition with the Front Démocratique des Francophones in Walloon Brabant and with the Mouvement des Citoyens pour le Changement in the four other provinces.
- The Christlich-Soziale Partei, the Partei für Freiheit und Fortschritt and the Sozialistische Partei are German-speaking parties. They are only active in the German-speaking Community of Belgium.

