Belgian regional elections, 2014
Regional elections were held in Belgium on 25 May 2014 to choose representatives for the Flemish Parliament, Walloon Parliament, Brussels Parliament and the Parliament of the German-speaking Community. These elections were held on the same day as the 2014 European elections as well as the 2014 Belgian federal election.
The Parliament of the French Community is composed of all elected members of the Walloon Parliament (except German-speaking members) and 19 of the French-speaking members of the Brussels Parliament.
Flemish Parliament
| | |||||||||||||||||||||||||||||||||||||||||||||||||||||||||||||||||||||||||||||||||||||||||||||||||||
| |||||||||||||||||||||||||||||||||||||||||||||||||||||||||||||||||||||||||||||||||||||||||||||||||||
| |||||||||||||||||||||||||||||||||||||||||||||||||||||||||||||||||||||||||||||||||||||||||||||||||||
| |||||||||||||||||||||||||||||||||||||||||||||||||||||||||||||||||||||||||||||||||||||||||||||||||||


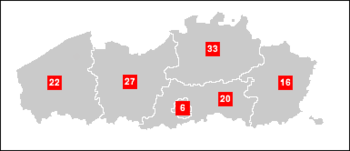

All 124 members of the Flemish Parliament were elected. The five Flemish provinces (West Flanders, East Flanders, Antwerp, Flemish Brabant and Limburg) each are a constituency, plus the Brussels-Capital Region where those voting for a Dutch-language party can also vote in the Flemish election.
The incumbent Peeters II Government was made up of a coalition of CD&V, N-VA and sp.a. Minister-President Kris Peeters (CD&V) consistently polled as one of the most popular politicians in Flanders. He is a candidate to succeed himself as Minister-President. Other parties did not put forward an explicit candidate to be Minister-President.
Since the elections coincide with the federal elections, a lot of the campaigning and debates have been about federal matters. Nonetheless, the sixth state reform has transferred a lot of powers from the federal state to the regional level, such as child benefits.
Other major election topics include the reform of the secondary education, and mobility around Antwerp, in particular the Oosterweel Link.
Opinion polls
| Date | Polling Firm | CD&V | VB | sp.a | VLD | N-VA | Groen | PVDA | Others | Lead |
|---|---|---|---|---|---|---|---|---|---|---|
| 25 May 2014 | Flemish Elections | 20.5 | 5.9 | 14.0 | 14.2 | 31.9 | 8.7 | 2.5 | 2.3 | 11.4 |
| 16 May | De Standaard | 20.0 | 8.4 | 14.4 | 13.1 | 31.8 | 9.5 | 2.6 | 0.2 | 11.8 |
| 25 Apr | De Standaard | 20.0 | 6.7 | 14.5 | 12.7 | 33.2 | 9.1 | 1.7 | 2.1 | 13.2 |
| 23 Apr | Le Soir | 17.6 | 10.3 | 13.5 | 13.5 | 32.8 | 8.7 | 3.4 | 0.2 | 15.2 |
| 15 Apr | La Libre Belgique | 16.9 | 9.9 | 13.6 | 13.5 | 32.9 | 7.6 | 4.1 | 1.5 | 16.0 |
| 21 Feb | La Libre Belgique | 17.6 | 9.8 | 14.6 | 12.8 | 32.3 | 7.3 | 3.7 | 1.9 | 14.7 |
| 13 Feb | Le Soir | 18.5 | 7.6 | 13.3 | 13.3 | 32.3 | 8.4 | 2.7 | 3.9 | 13.8 |
| 2014 | ||||||||||
| 24 Nov | La Libre Belgique | 17.9 | 9.9 | 14.1 | 12.4 | 30.8 | 8.0 | 2.0 | 4.9 | 12.9 |
| 21 Nov | Le Soir | 17.4 | 9.6 | 13.1 | 14.4 | 31.2 | 8.9 | 3.0 | 2.4 | 13.8 |
| 2 Sep | La Libre Belgique | 17.3 | 11.3 | 12.0 | 11.8 | 35.5 | 6.9 | 1.5 | 3.7 | 18.2 |
| 16 Jun | Le Soir | 15.7 | 9.4 | 13.9 | 13.2 | 35.0 | 7.7 | - | 5.1 | 19.3 |
| 25 May | La Libre Belgique | 15.9 | 12.9 | 14.1 | 12.9 | 32.8 | 6.5 | 2.5 | 2.4 | 16.9 |
| 25 May | De Standaard | 17.4 | 10.6 | 14.7 | 10.1 | 32.1 | 9.5 | 2.5 | 3.1 | 14.7 |
| 24 Mar | Le Soir | 16.7 | 10.5 | 13.6 | 12.3 | 33.6 | 7.7 | 2.8 | 2.8 | 16.9 |
| 16 Mar | Het Laatste Nieuws | 15.1 | 11.3 | 14.7 | 12.1 | 33.8 | 8.4 | - | 4.6 | 18.7 |
| 22 Feb | La Libre Belgique | 14.1 | 6.8 | 14.9 | 10.0 | 39.0 | 8.7 | 2.4 | 4.1 | 24.1 |
| 2013 | ||||||||||
| 30 Nov | La Libre Belgique | 16.5 | 10.7 | 14.4 | 9.6 | 35.4 | 8.0 | 3.6 | 1.8 | 18.9 |
| 14 Oct 2012 | Provincial elections | 21.4 | 8.9 | 13.6 | 14.6 | 28.5 | 8.3 | 2.1 | 2.5 | 7.1 |
| 14 Sep | De Standaard | 18.5 | 9.5 | 14.5 | 10.7 | 36.3 | 7.9 | - | 2.6 | 17.8 |
| 5 Sep | La Libre Belgique | 13.4 | 10.0 | 13.5 | 11.6 | 40.1 | 7.5 | 2.7 | 1.2 | 26.6 |
| 2012 | ||||||||||
| 2 Dec | La Libre Belgique | 12.6 | 8.4 | 13.9 | 12.6 | 39.8 | 7.5 | - | 5.2 | 25.9 |
| 2011 | ||||||||||
| 10 Jun 2010 | Federal Elections | 17.6 | 12.6 | 15.0 | 14.0 | 28.2 | 7.1 | 1.3 | 4.1 | 10.6 |
| 2 Apr | De Standaard | 22.2 | 14.0 | 15.9 | 17.6 | 14.8 | 8.1 | - | 7.4 | 4.6 |
| 2010 | ||||||||||
| 9 Oct | De Standaard | 24.4 | 12.8 | 15.0 | 16.7 | 13.5 | 8.5 | - | 9.1 | 7.7 |
| 7 Jun 2009 | Flemish Elections | 22.9 | 15.3 | 15.3 | 15.0 | 13.1 | 6.8 | 1.0 | 10.7 | 7.6 |
Main candidates
| National party | | | | | | | |
|---|---|---|---|---|---|---|---|
| Major parties | |||||||
| Christian Democratic and Flemish (CD&V) | Kris Peeters | Joke Schauvliege | Peter Van Rompuy | Jo Vandeurzen | Hilde Crevits | Bianca Debaets | |
| Green (Groen) | Wouter Van Besien | Elisabeth Meuleman | Hermes Sanctorum | Johan Danen | Bart Caron | Elke Van den Brandt | |
| New Flemish Alliance (N-VA) | Liesbeth Homans | Matthias Diependaele | Ben Weyts | Jan Peumans | Geert Bourgeois | Karl Vanlouwe | |
| Open Flemish Liberals and Democrats (Open Vld) | Bart Somers | Mathias De Clercq | Gwendolyn Rutten | Marino Keulen | Bart Tommelein | Ann Brusseel | |
| Socialist Party–Differently (sp.a) | Caroline Gennez | Freya Van den Bossche | Bruno Tobback | Ingrid Lieten | John Crombez | Yamila Idrissi | |
| Flemish Interest (Vlaams Belang) | Anke Van dermeersch | Guy D'haeseleer | Joris Van Hauthem | Chris Janssens | Stefaan Sintobin | Frédéric Erens | |
| Minor parties | |||||||
| Workers' Party (PVDA+) | Jos D'Haese | Dirk Goemaere | Line De Witte | Gaby Colebunders | Bart Desmedt | — | |
| Pirate Party | Kjell Segers | Sarah Van Liefferinge | David Knapen | — | Jonas Degrave | — | |
Results

The winner is by far the N-VA, especially compared to the 2009 regional elections but also to the 2010 federal elections. Groen also gained votes, whereas CD&V, sp.a, Open Vld and especially Vlaams Belang lost votes. LDD did not compete and is no longer in parliament.
The Union of Francophones (UF) narrowly reached the 5% election threshold in Flemish Brabant, thereby keeping their only seat.
The incumbent government parties N-VA, CD&V and sp.a would have a large majority; it was however not expected that sp.a and N-VA will be together in a coalition.
Initially, N-VA and CD&V were negotiating to form a Flemish Government. However, since Open Vld was needed for a federal coalition and they wanted to be in both or neither governments, they joined the Flemish negotiations. On 25 July 2014, the new Bourgeois Government was sworn in, led by Minister-President Geert Bourgeois (N-VA). Outgoing Minister-President Kris Peeters (CD&V) became minister in the federal Michel Government.
| ← 2009 • 2014 • 2019 → | ||||||||||
| Party | Main ideology | Leader(s) | Votes | % | +/– | Seats | +/– | |||
|---|---|---|---|---|---|---|---|---|---|---|
| FLA | BRU | TOT | ||||||||
| New Flemish Alliance (N-VA) | centre-right Flemish nationalism | Bart De Wever | 1,339,946 | 31.88 | 18.83 |
42 | 1 | 43 / 124 |
27 | |
| Christian Democratic & Flemish (CD&V) | Christian democracy | Wouter Beke | 860,694 | 20.48 | 2.37 |
26 | 1 | 27 / 124 |
4 | |
| Open Flemish Liberals and Democrats (Open Vld) | Liberalism | Gwendolyn Rutten | 594,469 | 14.15 | 0.85 |
17 | 2 | 19 / 124 |
2 | |
| Socialist Party – Differently (sp.a) | Social democracy | Bruno Tobback | 587,903 | 13.99 | 1.28 |
17 | 1 | 18 / 124 |
1 | |
| Green (Groen) | Green politics | Wouter Van Besien | 365,781 | 8.70 | 1.94 |
9 | 1 | 10 / 124 |
3 | |
| Flemish Interest (Vlaams Belang) | far-right Flemish nationalism | Gerolf Annemans | 248,840 | 5.92 | 9.36 |
6 | 0 | 6 / 124 |
15 | |
| Union of Francophones (UF) | Francophone minority politics | Four co-chairmen | 34,741 | 0.83 | 0.32 |
1 | 0 | 1 / 124 |
0 | |
| Workers' Party+ (PVDA+) | Socialism/Communism | Peter Mertens | 106,114 | 2.53 | 1.04 |
0 | 0 | 0 / 124 |
0 | |
| Libertarian, Direct, Democratic (LDD) | Libertarianism | Jean-Marie Dedecker | N/A | N/A | N/A | 0 | 0 | 0 / 124 |
8 | |
| Others (parties and candidates that received less than 1% of the vote and no seats) | 63,974 | 0 | 0 | 0 / 124 |
||||||
| Valid votes | 4,202,462 | 95.03 | ||||||||
| Blank and invalid votes | 219,574 | 4.97 | ||||||||
| Totals | 4,422,036 | 100.00 | — | 118 | 6 | 124 / 124 |
0 | |||
| Electorate (eligible voters) and voter turnout | 4,771,657 | 92.67 | ||||||||
| Source:
Notes: | ||||||||||
In detail
The candidate receiving the most preference votes was Liesbeth Homans (N-VA) in Antwerp, with 159,965 votes, ahead of Kris Peeters (CD&V).
The highest percentage of votes in a municipality (apart from the French-speaking list in the Brussels Periphery) was achieved by N-VA in Schilde (near Antwerp city) with 51,27% of the votes.
| Party | Total | Antwerp | Brussels | East Flanders | Flemish Brabant | Limburg | West Flanders | ||||||||||||||
|---|---|---|---|---|---|---|---|---|---|---|---|---|---|---|---|---|---|---|---|---|---|
| Votes | Perc. | Seats | Votes | Perc. | Seats | Votes | Perc. | Seats | Votes | Perc. | Seats | Votes | Perc. | Seats | Votes | Perc. | Seats | Votes | Perc. | Seats | |
| N-VA | 1,339,943 | 31.88 | 43 | 411,001 | 36.46 | 14 | 9,508 | 18.31 | 1 | 300,638 | 30.65 | 9 | 204,139 | 29.43 | 7 | 176,512 | 32.15 | 5 | 238,148 | 29.78 | 7 |
| CD&V | 860,685 | 20.48 | 27 | 225,891 | 20.04 | 7 | 6,284 | 12.10 | 1 | 179,572 | 18.31 | 5 | 118,669 | 17.11 | 4 | 127,656 | 23.25 | 4 | 202,622 | 25.34 | 6 |
| Open Vld | 594,464 | 14.15 | 19 | 108,209 | 9.60 | 3 | 12,461 | 24.00 | 2 | 169,726 | 17.30 | 5 | 133,362 | 19.23 | 4 | 66,269 | 12.07 | 2 | 104,442 | 13.06 | 3 |
| sp.a | 587,901 | 13.99 | 18 | 128,760 | 11.42 | 4 | 9,558 | 18.41 | 1 | 139,640 | 14.24 | 4 | 85,105 | 12.27 | 2 | 94,721 | 17.25 | 3 | 130,119 | 16.27 | 4 |
| Groen | 365,779 | 8.70 | 10 | 111,234 | 9.87 | 3 | 10,660 | 20.53 | 1 | 88,977 | 9.07 | 2 | 64,836 | 9.35 | 2 | 32,713 | 5.96 | 1 | 57,361 | 7.17 | 1 |
| Vlaams Belang | 248,840 | 5.92 | 6 | 79,588 | 7.06 | 2 | 2,960 | 5.70 | 0 | 62,881 | 6.41 | 2 | 30,531 | 4.40 | 0 | 32,392 | 5.90 | 1 | 40,488 | 5.06 | 1 |
| PVDA+ | 106,114 | 2.53 | 0 | 43,694 | 3.88 | 0 | N/A | 23,029 | 2.35 | 0 | 12,212 | 1.76 | 0 | 14,257 | 2.60 | 0 | 12,922 | 1.62 | 0 | ||
| UF | 34,741 | 0.83 | 1 | N/A | N/A | N/A | 34,471 | 5.01 | 1 | N/A | N/A | ||||||||||
| Piratenpartij | 25,986 | 0.62 | 0 | 7,514 | 0.67 | 0 | N/A | 7,142 | 0.73 | 0 | 5,572 | 0.80 | 0 | N/A | 5,758 | 0.72 | 0 | ||||
| GENOEG | 10,612 | 0.25 | 0 | 3,521 | 0.31 | 0 | N/A | 2,177 | 0.22 | 0 | 1,398 | 0.20 | 0 | 1,475 | 0.27 | 0 | 1,449 | 0.18 | 0 | ||
| R.O.S.S.E.M. | 9,937 | 0.24 | 0 | 2,733 | 0.24 | 0 | N/A | 2,236 | 0.23 | 0 | 1,302 | 0.19 | 0 | 1,259 | 0.23 | 0 | 2,407 | 0.30 | 0 | ||
| ROEL | 5,228 | 0.12 | 0 | 1,306 | 0.12 | 0 | N/A | 1,017 | 0.10 | 0 | 674 | 0.10 | 0 | 872 | 0.16 | 0 | 1,359 | 0.17 | 0 | ||
| VCP | 5,026 | 0.12 | 0 | 682 | 0.06 | 0 | N/A | 909 | 0.09 | 0 | 1,007 | 0.15 | 0 | 979 | 0.18 | 0 | 1,449 | 0,18 | 0 | ||
| MAMA | 3,227 | 0.08 | 0 | 3,227 | 0.29 | 0 | N/A | N/A | N/A | N/A | N/A | ||||||||||
| SD&P | 2,853 | 0.07 | 0 | N/A | N/A | 2,853 | 0.29 | 0 | N/A | N/A | N/A | ||||||||||
| V.I.T.A.L. | 617 | 0.01 | 0 | N/A | N/A | N/A | N/A | N/A | 617 | 0.08 | 0 | ||||||||||
| PENSIO(E)N PLUS | 482 | 0.01 | 0 | N/A | 482 | 0.93 | 0 | N/A | N/A | N/A | N/A | ||||||||||
| Total | 4,202,435 | 100.00 | 124 | 1,127,360 | 100.00 | 33 | 51,919 | 100.00 | 6 | 980,797 | 100.00 | 27 | 693,548 | 100.00 | 20 | 549,105 | 100.00 | 16 | 799,733 | 100.00 | 22 |
Walloon Parliament
| | |||||||||||||||||||||||||||||||||||||||||||||||||||||||||||||||||||||||||||||||||||||||||||||||||||
| |||||||||||||||||||||||||||||||||||||||||||||||||||||||||||||||||||||||||||||||||||||||||||||||||||
| |||||||||||||||||||||||||||||||||||||||||||||||||||||||||||||||||||||||||||||||||||||||||||||||||||
| |||||||||||||||||||||||||||||||||||||||||||||||||||||||||||||||||||||||||||||||||||||||||||||||||||

All 75 members of the Walloon Regional Parliament were elected. The elections took place in 13 electoral districts.
The incumbent Demotte II Government, led by Rudy Demotte, is a coalition of the Socialist Party (PS), the Humanist Democratic Centre (cdH) and Ecolo. The Reformist Movement (MR) was the only opposition party.
Opinion polls
| Date | Polling Firm | PS | MR | Ecolo | cdH | PTB | PP | FDF | Others | Lead |
|---|---|---|---|---|---|---|---|---|---|---|
| 25 May 2014 | Walloon Elections | 30.9 | 26.7 | 8.6 | 15.2 | 5.8 | 4.9 | 2.5 | 5.5 | 4.2 |
| 15 May | La Libre Belgique | 28.7 | 21.8 | 9.4 | 11.6 | 8.5 | 5.8 | 3.1 | 11.1 | 6.9 |
| 23 Apr | Le Soir | 28.9 | 23.3 | 10.9 | 13.7 | 9.2 | 7.0 | 2.5 | 4.5 | 5.6 |
| 15 Apr | La Libre Belgique | 29.3 | 22.6 | 11.0 | 9.4 | 8.1 | 5.4 | 2.7 | 11.5 | 6.7 |
| 21 Feb | La Libre Belgique | 28.0 | 24.1 | 10.6 | 10.2 | 7.6 | 5.9 | 2.3 | 11.3 | 3.9 |
| 13 Feb | Le Soir | 28.4 | 23.3 | 11.4 | 12.5 | 6.7 | 5.6 | 2.0 | 10.1 | 5.1 |
| 2014 | ||||||||||
| 24 Nov | La Libre Belgique | 30.3 | 22.1 | 11.2 | 12.7 | 4.1 | 4.0 | 3.3 | 12.3 | 8.1 |
| 21 Nov | Le Soir | 29.3 | 21.7 | 11.2 | 14.0 | 4.1 | 2.8 | 2.2 | 14.7 | 7.6 |
| 2 Sep | La Libre Belgique | 30.3 | 23.5 | 12.7 | 12.8 | 3.7 | 2.1 | 3.1 | 11.8 | 6.8 |
| 16 Jun | Le Soir | 28.7 | 22.2 | 13.0 | 12.6 | 4.5 | - | 2.2 | 16.8 | 6.5 |
| 25 May | La Libre Belgique | 28.6 | 24.0 | 14.7 | 12.9 | 4.6 | 1.4 | 2.8 | 11.0 | 4.6 |
| 22 Feb | La Libre Belgique | 30.2 | 24.2 | 12.9 | 12.3 | 4.2 | 2.5 | 3.5 | 10.2 | 6.0 |
| 2013 | ||||||||||
| 30 Nov | La Libre Belgique | 30.6 | 23.5 | 11.3 | 12.7 | 5.4 | 2.4 | 2.1 | 12.0 | 7.1 |
| 14 Oct 2012 | Provincial elections | 32.0 | 27.7 | 13.2 | 17.0 | 2.8 | - | 2.4 | 5.0 | 4.3 |
| 2012 | ||||||||||
| 2011 | ||||||||||
| 10 Jun 2010 | Federal Elections | 37.6 | 22.2 | 12.3 | 14.6 | 1.9 | 3.1 | – | 8.2 | 15.4 |
| 2010 | ||||||||||
| 7 Jun 2009 | Walloon Elections | 32.8 | 23.4 | 18.5 | 16.1 | 1.2 | – | - | 7.9 | 9.4 |
Results
PS, cdH, Ecolo lost votes, whereas MR gained votes and PTB-GO! as well as Parti Populaire are new parties in parliament.
Within two weeks following the elections, the Socialist Party and the Humanist Democratic Centre started negotiations for a new government.
| ← 2009 • 2014 • 2019 → | ||||||||
| National party | Main ideology | Leader(s) | Votes | % | +/– | Seats | +/– | |
|---|---|---|---|---|---|---|---|---|
| Socialist Party (PS) | Social democracy | Paul Magnette | 626,473 | 30.96 | 1.81 |
30 / 75 |
1 | |
| Reformist Movement (MR) | Liberalism | Louis Michel | 540,438 | 26.71 | 3.30 |
25 / 75 |
6 | |
| Humanist Democratic Centre (CDH) | Christian democracy | Benoît Lutgen | 305,281 | 15.09 | 1.05 |
13 / 75 |
0 | |
| Ecolo (ECOLO) | Green politics | Olivier Deleuze & Emily Hoyos | 172,682 | 8.53 | 10.00 |
4 / 75 |
10 | |
| Workers' Party (PTB–GO!) | Socialism | Peter Mertens | 117.228 | 5.79 | 4.55 |
2 / 75 |
2 | |
| People's Party (PP) | Conservative liberalism | Mischaël Modrikamen | 98,840 | 4.89 | new | 1 / 75 |
1 | |
| Francophone Democratic Federalists (FDF) | Olivier Maingain | 51,543 | 2.55 | new | 0 / 75 |
0 | ||
| Others (parties and candidates that received less than 1% of the vote and no seats) | — | 0 / 75 |
— | |||||
| Valid votes | ||||||||
| Blank and invalid votes | ||||||||
| Totals | ' | 100.00 | — | 75 | 0 | |||
| Electorate (eligible voters) and voter turnout | ||||||||
In detail
| Party | Hainaut | Liège | Luxemburg | Namur | Walloon Brabant | ||||||||||
|---|---|---|---|---|---|---|---|---|---|---|---|---|---|---|---|
| Votes | Perc. | Seats | Votes | Perc. | Seats | Votes | Perc. | Seats | Votes | Perc. | Seats | Votes | Perc. | Seats | |
| PS | 279,647 | 38.19 | 15 | 184,469 | 30.11 | 8 | 38,295 | 23.23 | 1 | 83,082 | 27.87 | 4 | 45,723 | 19.47 | 2 |
| MR | 162,608 | 22.21 | 8 | 157,274 | 25.67 | 7 | 46,547 | 28.23 | 2 | 81,334 | 27.29 | 4 | 97,349 | 41.46 | 4 |
| CDH | 93,321 | 12.75 | 5 | 80,881 | 13.20 | 3 | 49,460 | 30.00 | 2 | 58,036 | 19.47 | 2 | 28,314 | 12.06 | 1 |
| ECOLO | 48,790 | 6.66 | 0 | 57,193 | 9.33 | 2 | 14,034 | 8.51 | 0 | 28,454 | 9.55 | 1 | 27,555 | 11.74 | 1 |
| PTB/PVDA–GO! | 42,629 | 5.82 | 0 | 50,682 | 8.27 | 2 | 2,848 | 1.73 | 0 | 14,749 | 4.95 | 0 | 6,592 | 2.81 | 0 |
| PP | 35,229 | 4.81 | 0 | 33,649 | 5.49 | 1 | 7,771 | 4.71 | 0 | 13,025 | 4.37 | 0 | 9,563 | 4.07 | 0 |
| FDF | 16,843 | 2.30 | 0 | 13,281 | 2.17 | 0 | 3,270 | 1.98 | 0 | 7,389 | 2.48 | 0 | 10,945 | 4.66 | 0 |
| Total | 28 | 23 | 5 | 11 | 8 | ||||||||||
Brussels Parliament
| | |||||||||||||||||||||||||||||||||||||||||||||||||||||||||||||||||||||||||||||||||||||||||||||||||||
| |||||||||||||||||||||||||||||||||||||||||||||||||||||||||||||||||||||||||||||||||||||||||||||||||||
| |||||||||||||||||||||||||||||||||||||||||||||||||||||||||||||||||||||||||||||||||||||||||||||||||||
| |||||||||||||||||||||||||||||||||||||||||||||||||||||||||||||||||||||||||||||||||||||||||||||||||||


All 89 members of the Parliament of the Brussels-Capital Region were elected. There are separate Dutch-language party lists and French-language party lists. Those voting for a Dutch-language party can also cast a vote for the Flemish Parliament election.
Opinion polls
| Date | Polling Firm | MR | PS | Ecolo | cdH | VLD | sp.a | VB | CD&V | Groen | PTB/PVDA | N-VA | FDF | PP | Others | Lead |
|---|---|---|---|---|---|---|---|---|---|---|---|---|---|---|---|---|
| 15 May | La Libre Belgique | 21.0 | 19.2 | 8.5 | 10.9 | 3.5 | 2.5 | - | - | - | 7.5 | 2.0 | 11.5 | 3.8 | 9.6 | 1.8 |
| 23 Apr | Le Soir | 20.3 | 22.5 | 9.6 | 9.8 | 4.4 | 0.8 | - | 1.4 | - | 6.0 | - | 9.3 | 3.9 | 12.0 | 2.2 |
| 15 Apr | La Libre Belgique | 20.2 | 17.6 | 8.0 | 11.6 | 3.8 | 1.1 | 3.0 | 2.1 | 1.9 | 7.2 | 2.1 | 8.3 | 4.1 | 9.0 | 2.6 |
| 21 Feb | La Libre Belgique | 21.8 | 18.1 | 10.1 | 12.5 | 3.6 | 1.0 | 1.0 | 1.6 | 2.9 | 6.5 | 2.7 | 10.4 | 3.0 | 4.8 | 3.7 |
| 13 Feb | Le Soir | 20.0 | 21.2 | 9.6 | 10.4 | 4.3 | 2.9 | 0.7 | 0.8 | 2.5 | 6.8 | 2.6 | 9.6 | 2.3 | 6.3 | 1.2 |
| 2014 | ||||||||||||||||
| 22 Nov | La Libre Belgique | 22.6 | 20.8 | 10.6 | 12.2 | 2.4 | 2.3 | 2.0 | 1.6 | 2.1 | 2.3 | 1.7 | 11.8 | 2.2 | 5.4 | 1.8 |
| 21 Nov | Le Soir | 18.7 | 24.1 | 11.3 | 9.7 | - | - | - | - | - | - | - | - | - | 36.2 | 5.4 |
| 6 Sep | La Libre Belgique | 22.6 | 21.1 | 11.7 | 10.5 | 1.8 | 1.6 | 2.0 | 1.7 | 1.8 | 3.2 | 2.9 | 11.2 | 2.4 | 5.5 | 1.5 |
| 1 Sep | Le Soir | 22.6 | 23.8 | 10.3 | 9.8 | 2.3 | 1.3 | 1.5 | 1.5 | 2.0 | - | 2.8 | - | - | 22.1 | 1.2 |
| 16 Jun | Le Soir | 20.9 | 24.5 | 10.5 | 10.2 | - | - | - | - | - | - | - | - | - | 33.9 | 3.6 |
| 25 May | La Libre Belgique | 21.9 | 19.9 | 12.4 | 9.8 | 2.1 | 2.4 | 3.0 | 1.7 | 1.4 | 2.4 | 3.2 | 11.4 | 1.8 | 6.6 | 2.0 |
| 22 Feb | La Libre Belgique | 22.8 | 21.3 | 10.6 | 11.4 | 2.5 | 1.2 | 1.4 | 2.5 | 1.6 | 3.8 | 2.9 | 11.0 | 1.9 | 5.1 | 1.5 |
| 2013 | ||||||||||||||||
| 2012 | ||||||||||||||||
| 2011 | ||||||||||||||||
| 10 Jun 2010 | Federal Elections | 27.1 | 26.6 | 12.0 | 12.2 | 2.3 | 2.0 | 1.7 | 1.6 | 1.6 | 1.6 | 1.8 | - | 3.5 | 6.1 | 0.5 |
| 2010 | ||||||||||||||||
| 7 Jun 2009 | Brussels Elections | 26.5 | 23.3 | 17.9 | 13.1 | 2.6 | 2.2 | 2.0 | 1.7 | 1.3 | 0.9 | 0.6 | - | - | 8.0 | 3.2 |
Results
The winner is FDF, which became the third largest French-speaking party. MR, PS, Ecolo and cdH lost votes.
| Party | Main candidate | 2014 | +/– | |||
|---|---|---|---|---|---|---|
| % | votes | seats | seats | |||
| Socialist Party (PS) | Rudi Vervoort | 26.58 | 108,763 | 21 | | |
| Reformist Movement (MR) | Vincent De Wolf | 23.03 | 94,243 | 18 | | |
| Francophone Democratic Federalists (FDF) | Didier Gosuin | 14.81 | 60,611 | 12 | | |
| Humanist Democratic Centre (cdH) | Joëlle Milquet | 11.73 | 48,021 | 9 | | |
| Ecolo | Christos Doulkeridis | 10.11 | 41,368 | 8 | | |
| Workers' Party of Belgium (PTB) | Michaël Verbauwhede | 3.86 | 15,782 | 4 | | |
| Others | 0 | | ||||
| Total | 100.0 | 72 | - | |||
The candidates receiving the most preference votes were Didier Gosuin (FDF, 22,906), Vincent De Wolf (MR, 19,919), Joëlle Milquet (cdH, 19,416), Charles Picqué (PS, 16,859) and Rudi Vervoort (PS, 16,742).
| Party | Main candidate | 2014 | +/– | |||
|---|---|---|---|---|---|---|
| % | votes | seats | seats | |||
| Open Flemish Liberals and Democrats (Open Vld) | Guy Vanhengel | 26.73 | 14,296 | 5 | | |
| Socialist Party Differently (sp.a) | Pascal Smet | 19.54 | 10,450 | 3 | | |
| Green (Groen) | Bruno De Lille | 17.89 | 9,566 | 3 | | |
| New Flemish Alliance (N-VA) | Johan Van den Driessche | 16.99 | 9,085 | 3 | | |
| Christian Democratic & Flemish (CD&V) | Brigitte Grouwels | 11.42 | 6,105 | 2 | | |
| Flemish Interest (Vlaams Belang) | Dominiek Lootens | 5.62 | 3,006 | 1 | | |
| Others | 0 | | ||||
| Total | 100.0 | 17 | - | |||
The candidate receiving the most preference votes was Guy Vanhengel (Open Vld, 7,375), significantly above the second one, Els Ampe (Open Vld, 2,883).
German-speaking Community Parliament
| | |||||||||||||||||||||||||||||||||||||||||||||||
| |||||||||||||||||||||||||||||||||||||||||||||||
| |||||||||||||||||||||||||||||||||||||||||||||||
All 25 members of the Parliament of the German-speaking Community were elected.
The incumbent government, led by Karl-Heinz Lambertz (SP), is a coalition of the Socialist Party (SP), the liberal Party for Freedom and Progress (PFF) and the regionalist ProDG. Only a few days after the elections, these parties agreed to continue their coalition government, but with Oliver Paasch (ProDG) as Minister-President since his party became bigger than SP.
| Party | 2014 | +/– | |||
|---|---|---|---|---|---|
| % | votes | seats | seats | ||
| Christian Social Party (CSP) | 24.9 | 9,358 | 7 | | |
| ProDG | 22.2 | 8,355 | 6 | | |
| Socialist Party (SP) | 16.1 | 6,050 | 4 | | |
| Party for Freedom and Progress (PFF) | 15.5 | 5,847 | 4 | | |
| Vivant | 10.6 | 3,997 | 2 | | |
| Ecolo | 9.5 | 3,591 | 2 | | |
| Libertarian Party (Parti Libertarien) | 1.2 | 435 | - | - | |
| Total | 100.0 | 37,633 | 25 | - | |
References
External links
- Elections 2014 - Federal Public Service Home Affairs
- 2014 Flemish Parliament elections - Flemish Internal Administration Agency