El Dorado County, California
| El Dorado County, California | ||||||
|---|---|---|---|---|---|---|
| County | ||||||
| County of El Dorado | ||||||
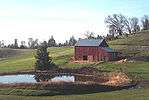
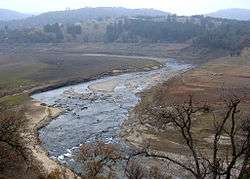
Images, from top down, left to right: A barn in El Dorado County, the shore of Lake Tahoe in Ed Z'berg Sugar Pine Point State Park, the South Fork American River running through the El Dorado hills, Marshall Gold Discovery State Historic Park | ||||||
| ||||||
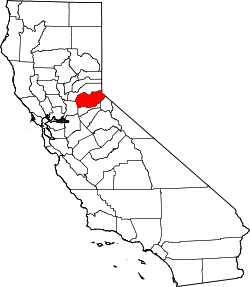 Location in the state of California | ||||||
 California's location in the United States | ||||||
| Country |
| |||||
| State |
| |||||
| Regions | Sierra Nevada, Gold Country | |||||
| Metropolitan area | Greater Sacramento | |||||
| Incorporated | February 18, 1850[1] | |||||
| County seat | Placerville | |||||
| Largest city | South Lake Tahoe | |||||
| Area | ||||||
| • Total | 1,786 sq mi (4,630 km2) | |||||
| • Land | 1,708 sq mi (4,420 km2) | |||||
| • Water | 78 sq mi (200 km2) | |||||
| Highest elevation[2] | 10,886 ft (3,318 m) | |||||
| Population (April 1, 2010)[3] | ||||||
| • Total | 181,058 | |||||
| • Estimate (2015)[3] | 184,452 | |||||
| • Density | 100/sq mi (39/km2) | |||||
| Time zone | Pacific Time Zone (UTC−8) | |||||
| • Summer (DST) | Pacific Daylight Time (UTC−7) | |||||
| Area code | 530 | |||||
| FIPS code | 06-017 | |||||
| GNIS feature ID | 277273 | |||||
| Website | www.edcgov.us | |||||


El Dorado County, officially the County of El Dorado, is a county in the U.S. state of California. As of the 2010 census, the population was 181,058.[3] The county seat is Placerville.[4]
El Dorado County is part of the Sacramento-Roseville-Arden-Arcade, CA Metropolitan Statistical Area. It is in the historic Gold Country in the Sierra Nevada.
El Dorado County's population has grown as Greater Sacramento has expanded into the region. In the county's unique Lake Tahoe area, environmental awareness and environmental protection initiatives have grown along with the population since the 1960 Winter Olympics, hosted at Squaw Valley Ski Resort in neighboring Placer County.
History
The present-day site of El Dorado County was once home to the Maidu, Washoe, and Miwok Native American tribes, and is notable for being the site of the 1848 gold discovery that sparked the California Gold Rush.[5] The County of El Dorado was one of California's original 27 counties created effective February 18, 1850 (the number has risen to 58 today). Its name is derived from the Spanish meaning "the gilded/golden".[6]
The final segments of the Pony Express mail route ran through El Dorado County until its replacement with the telegraph service in 1861; U.S. Highway 50 follows the Pony Express route today.
- Local landmarks:
- Marshall Gold Discovery State Historic Park
- Confidence Hall
- Fountain-Tallman Soda Works
- John Pearson Soda Works
- Combellack-Blair House
- Rubicon Point Light
Geography
According to the U.S. Census Bureau, the county has a total area of 1,786 square miles (4,630 km2), of which 1,708 square miles (4,420 km2) is land and 78 square miles (200 km2) (4.4%) is water.[7]
Geographic features
|
Recreation
Parks
Skiing
Racing
Wineries
Demographics
2011
| Population, race, and income | |||||
|---|---|---|---|---|---|
| Total population[9] | 179,878 | ||||
| White[9] | 157,853 | 87.8% | |||
| Black or African American[9] | 1,367 | 0.8% | |||
| American Indian or Alaska Native[9] | 1,802 | 1.0% | |||
| Asian[9] | 6,260 | 3.5% | |||
| Native Hawaiian or other Pacific Islander[9] | 167 | 0.1% | |||
| Some other race[9] | 6,323 | 3.5% | |||
| Two or more races[9] | 6,106 | 3.4% | |||
| Hispanic or Latino (of any race)[10] | 21,222 | 11.8% | |||
| Per capita income[11] | $34,385 | ||||
| Median household income[12] | $68,815 | ||||
| Median family income[13] | $82,930 | ||||
Places by population, race, and income
| Places by population and race | ||||||||
|---|---|---|---|---|---|---|---|---|
| Place | Type[14] | Population[9] | White[9] | Other[9] [note 1] |
Asian[9] | Black or African American[9] |
Native American[9] [note 2] |
Hispanic or Latino (of any race)[10] |
| Auburn Lake Trails | CDP | 3,741 | 97.0% | 1.5% | 0.2% | 1.0% | 0.3% | 2.3% |
| Cameron Park | CDP | 16,697 | 90.8% | 6.1% | 2.2% | 0.6% | 0.4% | 15.4% |
| Camino | CDP | 1,933 | 98.7% | 0.7% | 0.3% | 0.4% | 0.0% | 3.5% |
| Cold Springs | CDP | 569 | 90.9% | 9.1% | 0.0% | 0.0% | 0.0% | 3.3% |
| Coloma | CDP | 353 | 82.4% | 17.3% | 0.3% | 0.0% | 0.0% | 20.1% |
| Diamond Springs | CDP | 11,367 | 93.6% | 2.3% | 1.3% | 0.7% | 2.1% | 9.4% |
| El Dorado Hills | CDP | 43,563 | 84.0% | 5.4% | 8.9% | 1.7% | 0.1% | 7.3% |
| Georgetown | CDP | 2,338 | 89.9% | 8.2% | 0.0% | 0.1% | 1.8% | 10.7% |
| Grizzly Flats | CDP | 923 | 97.4% | 0.0% | 0.9% | 0.0% | 1.7% | 6.7% |
| Placerville | City | 10,394 | 82.5% | 12.0% | 2.0% | 0.7% | 2.9% | 19.4% |
| Pollock Pines | CDP | 6,953 | 95.2% | 3.6% | 0.8% | 0.0% | 0.4% | 9.8% |
| Shingle Springs | CDP | 4,797 | 92.7% | 2.0% | 0.0% | 0.7% | 4.6% | 16.7% |
| South Lake Tahoe | City | 21,814 | 76.8% | 16.8% | 4.5% | 0.6% | 1.3% | 31.3% |
| Tahoma ‡ | CDP | 563 | 82.8% | 17.2% | 0.0% | 0.0% | 0.0% | 8.5% |
| ‡ Data for El Dorado County area of this CDP | ||||||||
| Places by population and income | |||||
|---|---|---|---|---|---|
| Place | Type[14] | Population[15] | Per capita income[11] | Median household income[12] | Median family income[13] |
| Auburn Lake Trails | CDP | 3,741 | $35,522 | $79,573 | $92,308 |
| Cameron Park | CDP | 16,697 | $34,839 | $72,562 | $84,361 |
| Camino | CDP | 1,933 | $26,015 | $51,742 | $63,412 |
| Cold Springs (El Dorado County) | CDP | 569 | $30,925 | $97,576 | $99,286 |
| Coloma | CDP | 353 | $22,462 | $44,844 | $44,844 |
| Diamond Springs | CDP | 11,367 | $28,786 | $52,911 | $62,150 |
| El Dorado Hills | CDP | 43,563 | $44,920 | $115,121 | $123,816 |
| Georgetown | CDP | 2,338 | $24,117 | $52,169 | $62,614 |
| Grizzly Flats | CDP | 923 | $20,902 | $32,365 | $56,813 |
| Placerville | City | 10,394 | $26,109 | $53,385 | $66,890 |
| Pollock Pines | CDP | 6,953 | $30,826 | $54,478 | $62,760 |
| Shingle Springs | CDP | 4,797 | $34,055 | $86,786 | $89,778 |
| South Lake Tahoe | City | 21,814 | $22,958 | $41,685 | $51,538 |
| Tahoma ‡ | CDP | 563 | $32,105 | $54,286 | $63,646 |
| ‡ Data for El Dorado County area of this CDP | |||||
2010
| Historical population | |||
|---|---|---|---|
| Census | Pop. | %± | |
| 1850 | 20,057 | — | |
| 1860 | 20,562 | 2.5% | |
| 1870 | 10,309 | −49.9% | |
| 1880 | 10,683 | 3.6% | |
| 1890 | 9,232 | −13.6% | |
| 1900 | 8,986 | −2.7% | |
| 1910 | 7,492 | −16.6% | |
| 1920 | 6,426 | −14.2% | |
| 1930 | 8,325 | 29.6% | |
| 1940 | 13,229 | 58.9% | |
| 1950 | 16,207 | 22.5% | |
| 1960 | 29,390 | 81.3% | |
| 1970 | 43,833 | 49.1% | |
| 1980 | 85,812 | 95.8% | |
| 1990 | 125,955 | 46.8% | |
| 2000 | 156,299 | 24.1% | |
| 2010 | 181,058 | 15.8% | |
| Est. 2015 | 184,452 | [16] | 1.9% |
| U.S. Decennial Census[17] 1790–1960[18] 1900–1990[19] 1990–2000[20] 2010–2015[3] | |||
The 2010 United States Census reported that El Dorado County had a population of 181,058. The racial makeup of El Dorado County was 156,793 (86.6%) White, 1,409 (0.8%) African American, 2,070 (1.1%) Native American, 6,297 (3.5%) Asian, 294 (0.2%) Pacific Islander, 7,278 (4.0%) from other races, and 6,917 (3.8%) from two or more races. Hispanic or Latino of any race were 21,875 persons (12.1%).[21] The largest growth in the county has come in El Dorado Hills where the population grew by 24,092 residents to a total of 42,108 since 2000.[21]
| Population reported at 2010 United States Census | |||||||||
|---|---|---|---|---|---|---|---|---|---|
Population | American | American | | Islander | races | more races | or Latino (of any race) | ||
| El Dorado County | 181,058 | 156,793 | 1,409 | 2,070 | 6,297 | 294 | 7,278 | 6,917 | 21,875 |
cities | Population | American | American | | Islander | races | more races | or Latino (of any race) | |
| Placerville | 10,389 | 8,716 | 80 | 162 | 98 | 13 | 867 | 453 | 1,863 |
| South Lake Tahoe | 21,403 | 15,733 | 182 | 232 | 1,186 | 39 | 3,230 | 801 | 6,665 |
places | Population | American | American | | Islander | races | more races | or Latino (of any race) | |
| Auburn Lake Trails | 3,426 | 3,190 | 6 | 28 | 36 | 5 | 45 | 116 | 208 |
| Cameron Park | 18,228 | 16,242 | 143 | 194 | 425 | 36 | 461 | 727 | 2,056 |
| Camino | 1,750 | 1,604 | 7 | 14 | 18 | 4 | 55 | 48 | 197 |
| Cold Springs | 446 | 413 | 4 | 5 | 3 | 0 | 15 | 6 | 43 |
| Coloma | 529 | 462 | 4 | 3 | 8 | 0 | 15 | 37 | 63 |
| Diamond Springs | 11,037 | 9,743 | 39 | 176 | 110 | 6 | 518 | 445 | 1,377 |
| El Dorado Hills | 42,108 | 35,089 | 615 | 196 | 3,563 | 71 | 681 | 1,893 | 3,802 |
| Georgetown | 2,367 | 2,128 | 47 | 59 | 18 | 2 | 45 | 68 | 177 |
| Grizzly Flats | 1,066 | 954 | 6 | 14 | 7 | 2 | 19 | 64 | 96 |
| Pollock Pines | 6,871 | 6,195 | 18 | 128 | 56 | 3 | 251 | 220 | 713 |
| Shingle Springs | 4,432 | 3,919 | 14 | 108 | 50 | 3 | 132 | 206 | 469 |
| Tahoma‡ | 780 | 736 | 2 | 7 | 7 | 0 | 11 | 17 | 35 |
communities | Population | American | American | | Islander | races | more races | or Latino (of any race) | |
| All others not CDPs (combined) | 56,226 | 51,669 | 242 | 744 | 712 | 110 | 933 | 1,816 | 4,111 |
| ‡ Note: these numbers reflect only the portion of this CDP in El Dorado County | |||||||||
2000
As of the census[22] of 2000, there were 156,299 people, 58,939 households, and 43,025 families residing in the county. The population density was 91 people per square mile (35/km²). There were 71,278 housing units at an average density of 42 per square mile (16/km²). The racial makeup of the county was 89.7% White, 0.5% Black or African American, 1.0% Native American, 2.1% Asian, 0.1% Pacific Islander, 3.6% from other races, and 3.0% from two or more races. 9.3% of the population were Hispanic or Latino of any race. 14.9% were of German, 13.4% English, 10.3% Irish, 6.6% Italian and 6.6% American ancestry according to Census 2000. 90.5% spoke English and 6.5% Spanish as their first language.
There were 58,939 households out of which 34.2% had youngsters under the age of 18 living with them, 60.1% were married couples living together, 8.9% had a female householder with no husband present, and 27.0% were non-families. 20.1% of all households were made up of individuals and 7.3% had someone living alone who was 65 years of age or older. The average household size was 2.63 and the average family size was 3.04.
In the county the population was spread out with 26.1% under the age of 18, 6.8% from 18 to 24, 27.8% from 25 to 44, 26.9% from 45 to 64, and 12.4% who were 65 years of age or older. The median age was 39 years. For every 100 females there were 99.5 males. For every 100 females age 18 and over, there were 97.3 males.
The 2000 census also states that the median income for a household in the county was $51,484, and the median income for a family was $60,250. Males had a median income of $46,373 versus $31,537 for females. The per capita income for the county was $25,560. About 5.0% of families and 7.1% of the population were below the poverty line, including 7.6% of those under age 18 and 5.0% of those age 65 or over.
Politics
Voter registration statistics
| Population and registered voters | ||
|---|---|---|
| Total population[9] | 179,878 | |
| Registered voters[23][note 3] | 110,206 | 61.3% |
| Democratic[23] | 32,176 | 29.2% |
| Republican[23] | 48,362 | 43.9% |
| Democratic–Republican spread[23] | -16,186 | -14.7% |
| Independent[23] | 4,214 | 3.8% |
| Green[23] | 887 | 0.8% |
| Libertarian[23] | 1,010 | 0.9% |
| Peace and Freedom[23] | 293 | 0.3% |
| Americans Elect[23] | 5 | 0.0% |
| Other[23] | 883 | 0.8% |
| No party preference[23] | 22,376 | 20.3% |
Cities by population and voter registration
| Cities by population and voter registration | |||||||
|---|---|---|---|---|---|---|---|
| City | Population[9] | Registered voters[23] [note 3] |
Democratic[23] | Republican[23] | D–R spread[23] | Other[23] | No party preference[23] |
| Placerville | 10,394 | 52.9% | 34.0% | 37.4% | -3.4% | 11.5% | 21.3% |
| South Lake Tahoe | 21,814 | 42.4% | 38.6% | 22.8% | +15.8% | 14.0% | 29.0% |
Overview
| Year | GOP | DEM | Others |
|---|---|---|---|
| 2016 | 51.8% 48,340 | 38.3% 35,698 | 9.9% 9,249 |
| 2012 | 57.3% 50,973 | 39.5% 35,166 | 3.2% 2,859 |
| 2008 | 53.9% 50,314 | 43.4% 40,529 | 2.6% 2,466 |
| 2004 | 61.2% 52,878 | 37.3% 32,242 | 1.4% 1,244 |
| 2000 | 58.3% 42,045 | 36.3% 26,220 | 5.4% 3,871 |
| 1996 | 51.8% 32,759 | 36.3% 22,957 | 11.8% 7,480 |
| 1992 | 39.9% 25,906 | 32.4% 21,012 | 27.7% 17,969 |
| 1988 | 59.3% 30,021 | 39.1% 19,801 | 1.5% 781 |
| 1984 | 64.9% 27,583 | 33.7% 14,312 | 1.4% 583 |
| 1980 | 58.3% 21,238 | 29.5% 10,765 | 12.2% 4,446 |
| 1976 | 47.7% 12,472 | 48.8% 12,763 | 3.5% 919 |
| 1972 | 54.2% 11,330 | 41.4% 8,654 | 4.4% 921 |
| 1968 | 39.7% 6,054 | 49.0% 7,468 | 11.3% 1,719 |
| 1964 | 39.5% 5,775 | 60.3% 8,810 | 0.2% 25 |
| 1960 | 49.2% 6,065 | 50.1% 6,175 | 0.8% 97 |
| 1956 | 53.6% 4,613 | 46.0% 3,957 | 0.4% 37 |
| 1952 | 60.5% 5,203 | 38.4% 3,297 | 1.1% 98 |
| 1948 | 43.0% 2,894 | 52.0% 3,493 | 5.0% 337 |
| 1944 | 39.6% 1,990 | 60.0% 3,016 | 0.5% 25 |
| 1940 | 32.4% 2,019 | 66.4% 4,144 | 1.2% 74 |
| 1936 | 23.1% 1,228 | 75.7% 4,019 | 1.2% 65 |
| 1932 | 23.1% 956 | 73.4% 3,034 | 3.5% 145 |
| 1928 | 44.3% 1,228 | 54.6% 1,516 | 1.1% 31 |
| 1924 | 28.5% 852 | 12.1% 361 | 59.5% 1,778 |
| 1920 | 64.4% 1,636 | 28.6% 726 | 7.1% 180 |
| Election results from statewide races | ||
|---|---|---|
| Year | Office | Results |
| 2010 | Governor | Whitman 56.2 - 38.6% |
| Lieutenant Governor | Maldonado 55.6 - 32.8% | |
| Secretary of State | Dunn 53.5 - 37.4% | |
| Controller | Chiang 46.1 - 45.7% | |
| Treasurer | Walters 51.3 - 41.0% | |
| Attorney General | Cooley 60.4 - 29.4% | |
| Insurance Commissioner | Villines 53.6 - 33.8% | |
El Dorado is a predominantly Republican county in Presidential and congressional elections. The last Democrat to win a majority in the county was Lyndon Johnson in 1964 election, and the last Democrat to win the county was Jimmy Carter in the 1976 presidential election. The county is noted as a center of political concern with the United Nations non-binding sustainable development plan Agenda 21, which was on the County Board of Supervisors meeting Agenda on May 15, 2012. Concerns included the threat of U.S. Forest Service road closures and traffic roundabouts.[25] On February 19, 2013 14 members of the El Dorado County Grand Jury resigned, forcing Supervising Judge Steven Bailey to dissolve it.[26]
El Dorado County is in California's 4th congressional district, represented by Republican Tom McClintock.[27] In the State Assembly, the county is split between the 5th Assembly District, represented by Republican Frank Bigelow and the 6th Assembly District, represented by Republican Kevin Kiley.[28] In the State Senate, it is in the 1st Senate District, represented by Republican Ted Gaines.[29]
Crime
The following table includes the number of incidents reported and the rate per 1,000 persons for each type of offense.
| Population and crime rates | ||
|---|---|---|
| Population[9] | 179,878 | |
| Violent crime[30] | 520 | 2.89 |
| Homicide[30] | 3 | 0.02 |
| Forcible rape[30] | 50 | 0.28 |
| Robbery[30] | 71 | 0.39 |
| Aggravated assault[30] | 396 | 2.20 |
| Property crime[30] | 1,736 | 9.65 |
| Burglary[30] | 932 | 5.18 |
| Larceny-theft[30][note 4] | 1,540 | 8.56 |
| Motor vehicle theft[30] | 178 | 0.99 |
| Arson[30] | 17 | 0.09 |
Cities by population and crime rates
| Cities by population and crime rates | ||||||||
|---|---|---|---|---|---|---|---|---|
| City | Population[31] | Violent crimes[31] | Violent crime rate per 1,000 persons |
Property crimes[31] | Property crime rate per 1,000 persons | |||
| Placerville | 10,479 | 55 | 5.25 | 194 | 18.51 | |||
| South Lake Tahoe | 21,586 | 148 | 6.86 | 544 | 25.20 | |||
Transportation
Major highways

Public transportation
- El Dorado Transit runs local service in Placerville and surrounding areas (as far east as Pollock Pines). Commuter service into Sacramento and Folsom is also provided.
- BlueGo is the transit operator for the South Lake Tahoe area. Service also runs into the state of Nevada.
Airports
General aviation airports are include: Placerville Airport, Georgetown Airport, Cameron Airpark and Lake Tahoe Airport.
Asbestos
Portions of El Dorado county are known to contain natural asbestos formations near the surface.[32] The USGS studied amphiboles in rock and soil in the area in response to an EPA sampling study and subsequent criticism of the EPA study. The study found that many amphibole particles in the area meet the counting rule criteria used by the EPA for chemical and morphological limits, but do not meet morphological requirements for commercial-grade-asbestos. The executive summary pointed out that even particles that do not meet requirements for commercial-grade-asbestos may be a health threat and suggested a collaborative research effort to assess health risks associated with "Naturally Occurring Asbestos".[33]
In 2003 after construction of the Oak Ridge High School (El Dorado Hills, CA) soccer field, the federal Agency for Toxic Substances and Disease Registry found that some student athletes, coaches and school workers received substantial exposures. The inside of Oak Ridge High School needed to be cleaned of dust.[32]
Communities
Cities
- Placerville (county seat)
- South Lake Tahoe
Unincorporated communities
- Auburn Lake Trails
- Cameron Park
- Camino
- Camp Sacramento
- Cold Springs
- Coloma
- Cool
- Diamond Springs
- Echo Lake
- El Dorado
- El Dorado Hills
- Fair Play
- Garden Valley
- Georgetown
- Greenwood
- Grizzly Flats
- Happy Valley
- Meyers
- Kyburz
- Outingdale
- Phillips
- Pilot Hill
- Pollock Pines
- Rescue
- Shingle Springs
- Somerset
- Strawberry
- Tahoma
- Twin Bridges
Population ranking
The population ranking of the following table is based on the 2010 census of El Dorado County.[34]
† county seat
| Rank | City/Town/etc. | Municipal type | Population (2010 Census)
|
|---|---|---|---|
| 1 | El Dorado Hills | CDP | 42,108 |
| 2 | South Lake Tahoe | City | 21,403 |
| 3 | Cameron Park | CDP | 18,228 |
| 4 | Diamond Springs | CDP | 11,037 |
| 5 | † Placerville | City | 10,389 |
| 6 | Pollock Pines | CDP | 6,871 |
| 7 | Shingle Springs | CDP | 4,432 |
| 8 | Auburn Lake Trails | CDP | 3,426 |
| 9 | Georgetown | CDP | 2,367 |
| 10 | Camino | CDP | 1,750 |
| 11 | Tahoma (partially in Placer County) | CDP | 1,191 |
| 12 | Grizzly Flats | CDP | 1,066 |
| 13 | Coloma | CDP | 529 |
| 14 | Cold Springs | CDP | 446 |
| 15 | Shingle Springs Rancheria[35] | AIAN | 102 |
See also
- National Register of Historic Places listings in El Dorado County, California
- Hiking trails in El Dorado County
Notes
- ↑ Other = Some other race + Two or more races
- ↑ Native American = Native Hawaiian or other Pacific Islander + American Indian or Alaska Native
- 1 2 Percentage of registered voters with respect to total population. Percentages of party members with respect to registered voters follow.
- ↑ Only larceny-theft cases involving property over $400 in value are reported as property crimes.
References
- ↑ "Chronology". California State Association of Counties. Retrieved February 6, 2015.
- ↑ "Freel Peak". Peakbagger.com. Retrieved February 6, 2015.
- 1 2 3 4 "State & County QuickFacts". United States Census Bureau. Retrieved April 3, 2016.
- ↑ "Find a County". National Association of Counties. Retrieved 2011-06-07.
- ↑ Irish, Marc Charles. "Brief History of El Dorado County | El Dorado County, CAGenWeb | Marc Charles Irish". www.cagenweb.com. Retrieved 2016-03-23.
- ↑ Gannett, Henry (1905). The Origin of Certain Place Names in the United States. Govt. Print. Off. p. 116.
- ↑ "2010 Census Gazetteer Files". United States Census Bureau. August 22, 2012. Retrieved September 24, 2015.
- ↑ Freel Peak
- 1 2 3 4 5 6 7 8 9 10 11 12 13 14 15 16 17 U.S. Census Bureau. American Community Survey, 2011 American Community Survey 5-Year Estimates, Table B02001. American FactFinder. Retrieved 2013-10-26.
- 1 2 U.S. Census Bureau. American Community Survey, 2011 American Community Survey 5-Year Estimates, Table B03003. American FactFinder. Retrieved 2013-10-26.
- 1 2 U.S. Census Bureau. American Community Survey, 2011 American Community Survey 5-Year Estimates, Table B19301. American FactFinder. Retrieved 2013-10-21.
- 1 2 U.S. Census Bureau. American Community Survey, 2011 American Community Survey 5-Year Estimates, Table B19013. American FactFinder. Retrieved 2013-10-21.
- 1 2 U.S. Census Bureau. American Community Survey, 2011 American Community Survey 5-Year Estimates, Table B19113. American FactFinder. Retrieved 2013-10-21.
- 1 2 U.S. Census Bureau. American Community Survey, 2011 American Community Survey 5-Year Estimates. American FactFinder. Retrieved 2013-10-21.
- ↑ U.S. Census Bureau. American Community Survey, 2011 American Community Survey 5-Year Estimates, Table B01003. American FactFinder. Retrieved 2013-10-21.
- ↑ "County Totals Dataset: Population, Population Change and Estimated Components of Population Change: April 1, 2010 to July 1, 2015". Retrieved July 2, 2016.
- ↑ "U.S. Decennial Census". United States Census Bureau. Retrieved September 24, 2015.
- ↑ "Historical Census Browser". University of Virginia Library. Retrieved September 24, 2015.
- ↑ Forstall, Richard L., ed. (March 27, 1995). "Population of Counties by Decennial Census: 1900 to 1990". United States Census Bureau. Retrieved September 24, 2015.
- ↑ "Census 2000 PHC-T-4. Ranking Tables for Counties: 1990 and 2000" (PDF). United States Census Bureau. April 2, 2001. Retrieved September 24, 2015.
- 1 2 "2010 Census P.L. 94-171 Summary File Data". United States Census Bureau.
- ↑ "American FactFinder". United States Census Bureau. Retrieved 2011-05-14.
- 1 2 3 4 5 6 7 8 9 10 11 12 13 14 15 16 17 California Secretary of State. February 10, 2013 - Report of Registration. Retrieved 2013-10-31.
- ↑ http://uselectionatlas.org/RESULTS/
- ↑ Carlos Alcalá (May 24, 2012). "El Dorado County folks riled by U.N. agenda for sustainable growth". Sacramento Bee. Retrieved March 10, 2013.
- ↑ Cathy Locke (March 10, 2013). "The Public Eye: El Dorado County grand jury disbands after mass resignation". Sacramento Bee. Retrieved March 10, 2013.
- ↑ "California's 4th Congressional District - Representatives & District Map". Civic Impulse, LLC. Retrieved March 1, 2013.
- ↑ "Members Assembly". State of California. Retrieved April 5, 2013.
- ↑ "Senators". State of California. Retrieved April 5, 2013.
- 1 2 3 4 5 6 7 8 9 10 Office of the Attorney General, Department of Justice, State of California. Table 11: Crimes – 2009. Retrieved 2013-11-14.
- 1 2 3 United States Department of Justice, Federal Bureau of Investigation. Crime in the United States, 2012, Table 8 (California). Retrieved 2013-11-14.
- 1 2 Raloff, Janet (July 8, 2006), "Dirty Little Secret", Science News, archived from the original (– Scholar search) on July 13, 2007
- ↑ Meeker, G.P.; Lowers, H.A.; Swayze, G.A.; Van Gosen, B.S.; Stutley, S.J.; Brownfield, I.K. (December 2006), Mineralogy and Morphology of Amphiboles Observed in Soils and Rocks in El Dorado Hills, California, United States Geological Survey
- ↑ http://www.census.gov/2010census/
- ↑ http://www.census.gov/2010census/popmap/ipmtext.php?fl=3750
External links
| Wikimedia Commons has media related to El Dorado County, California. |
- Official website
- official El Dorado County Historical Museum website
- El Dorado Environmental air quality management - Naturally occurring asbestos information
- El Dorado County Weather
- El Dorado County Visitors Authority
- Sierra Community Access Television
- El Dorado Western Railway Foundation blog The railway is restoring the Diamond & Caldor No. 4 Shay locomotive at the El Dorado County Historical Museum
 |
Placer County | Douglas County, Nevada | | |
| Sacramento County | |
|||
| ||||
| | ||||
| Amador County | Alpine County |
Coordinates: 38°47′N 120°32′W / 38.78°N 120.53°W