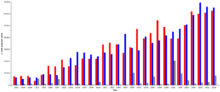
List of United States presidential elections by popular vote margin
In United States presidential elections, the national popular vote is the sum of all votes cast in every state and the District of Columbia.
The Twelfth Amendment to the United States Constitution provides the procedure by which the President and Vice President are elected, which is through the Electoral College, so the national popular vote does not determine the outcome of the United States presidential election.
List
The table below is sorted to display elections by their presidential term / year of election, name, margin by percentage in popular vote, popular vote, margin in popular vote by number, and the runner up in the Electoral College.
| Election | Winner & party | Electoral College | Popular vote | Runner-up & party | Turnout[2] | |||||||
|---|---|---|---|---|---|---|---|---|---|---|---|---|
| Votes | % | % | Margin | Votes | Margin | |||||||
|
Democratic-Republican
Democratic
Republican
Whig
Progressive
Liberal Republican
National Republican
| ||||||||||||
| 10 | 1824 | John Quincy Adams | D.-R. | 84/261 | 32.18% | 30.92% | −10.44% | 113,142 | −38,221 | Andrew Jackson | D.-R. | 26.9% |
| 23 | 1876 | Rutherford Hayes | Rep. | 185/369 | 50.14% | 47.92% | −3.00% | 4,034,142 | −252,666 | Samuel Tilden | Dem. | 82.6% |
| 58 | 2016 | Donald Trump | Rep. | 306/538 | 56.87% | 46.16%[lower-alpha 1] | −1.86%[lower-alpha 1] | 62,673,215[lower-alpha 1] | −2,526,746[lower-alpha 1] | Hillary Clinton | Dem. | 58.6%[lower-alpha 1] |
| 26 | 1888 | Benjamin Harrison | Rep. | 233/401 | 58.10% | 47.80% | −0.83% | 5,443,633 | −94,530 | Grover Cleveland | Dem. | 80.5% |
| 54 | 2000 | George W. Bush | Rep. | 271/538 | 50.37% | 47.87% | −0.51% | 50,460,110 | −543,816 | Al Gore | Dem. | 54.2% |
| 24 | 1880 | James Garfield | Rep. | 214/369 | 57.99% | 48.31% | 0.09% | 4,453,337 | 1,898 | Winfield Scott Hancock | Dem. | 80.5% |
| 44 | 1960 | John Kennedy | Dem. | 303/537 | 56.42% | 49.72% | 0.17% | 34,220,984 | 112,827 | Richard Nixon | Rep. | 63.8% |
| 25 | 1884 | Grover Cleveland | Dem. | 219/401 | 54.61% | 48.85% | 0.57% | 4,914,482 | 57,579 | James Blaine | Rep. | 78.2% |
| 46 | 1968 | Richard Nixon | Rep. | 301/538 | 55.95% | 43.42% | 0.70% | 31,783,783 | 511,944 | Hubert Humphrey | Dem. | 62.5% |
| 15 | 1844 | James Polk | Dem. | 170/275 | 61.82% | 49.54% | 1.45% | 1,339,570 | 39,413 | Henry Clay | Whig | 79.2% |
| 48 | 1976 | Jimmy Carter | Dem. | 297/538 | 55.20% | 50.08% | 2.06% | 40,831,881 | 1,683,247 | Gerald Ford | Rep. | 54.8% |
| 55 | 2004 | George W. Bush | Rep. | 286/538 | 53.16% | 50.73% | 2.46% | 62,040,610 | 3,012,171 | John Kerry | Dem. | 60.1% |
| 27 | 1892 | Grover Cleveland | Dem. | 277/444 | 62.39% | 46.02% | 3.01% | 5,553,898 | 363,099 | Benjamin Harrison | Rep. | 75.8% |
| 33 | 1916 | Woodrow Wilson | Dem. | 277/531 | 52.17% | 49.24% | 3.12% | 9,126,868 | 578,140 | Charles Evans Hughes | Rep. | 61.8% |
| 57 | 2012 | Barack Obama | Dem. | 332/538 | 61.71% | 51.06% | 3.86% | 65,915,796 | 4,982,296 | Mitt Romney | Rep. | 58.6% |
| 28 | 1896 | William McKinley | Rep. | 271/447 | 60.63% | 51.02% | 4.31% | 7,112,138 | 601,331 | William Jennings Bryan | Dem. | 79.6% |
| 41 | 1948 | Harry Truman | Dem. | 303/531 | 57.06% | 49.55% | 4.48% | 24,179,347 | 2,188,055 | Thomas Dewey | Rep. | 52.2% |
| 16 | 1848 | Zachary Taylor | Whig | 163/290 | 56.21% | 47.28% | 4.79% | 1,360,235 | 137,882 | Lewis Cass | Dem. | 72.8% |
| 21 | 1868 | Ulysses Grant | Rep. | 214/294 | 72.79% | 52.66% | 5.32% | 3,013,790 | 304,810 | Horatio Seymour | Dem. | 80.9% |
| 52 | 1992 | Bill Clinton | Dem. | 370/538 | 68.77% | 43.01% | 5.56% | 44,909,806 | 5,805,256 | George H. W. Bush | Rep. | 58.1% |
| 14 | 1840 | William Henry Harrison | Whig | 234/294 | 79.59% | 52.87% | 6.05% | 1,275,583 | 145,938 | Martin Van Buren | Dem. | 80.3% |
| 29 | 1900 | William McKinley | Rep. | 292/447 | 65.23% | 51.64% | 6.12% | 7,228,864 | 857,932 | William Jennings Bryan | Dem. | 73.7% |
| 17 | 1852 | Franklin Pierce | Dem. | 254/296 | 85.81% | 50.83% | 6.95% | 1,605,943 | 219,525 | Winfield Scott | Whig | 69.5% |
| 56 | 2008 | Barack Obama | Dem. | 365/538 | 67.84% | 52.93% | 7.27% | 69,498,516 | 9,550,193 | John McCain | Rep. | 61.6% |
| 40 | 1944 | Franklin Roosevelt | Dem. | 432/531 | 81.36% | 53.39% | 7.50% | 25,612,916 | 3,594,987 | Thomas Dewey | Rep. | 55.9% |
| 51 | 1988 | George H. W. Bush | Rep. | 426/538 | 79.18% | 53.37% | 7.72% | 48,886,597 | 7,077,121 | Michael Dukakis | Dem. | 52.8% |
| 53 | 1996 | Bill Clinton | Dem. | 379/538 | 70.45% | 49.23% | 8.51% | 47,400,125 | 8,201,370 | Bob Dole | Rep. | 51.7% |
| 31 | 1908 | William Taft | Rep. | 321/483 | 66.46% | 51.57% | 8.53% | 7,678,335 | 1,269,356 | William Jennings Bryan | Dem. | 65.7% |
| 49 | 1980 | Ronald Reagan | Rep. | 489/538 | 90.89% | 50.75% | 9.74% | 43,903,230 | 8,423,115 | Jimmy Carter | Dem. | 54.2% |
| 39 | 1940 | Franklin Roosevelt | Dem. | 449/531 | 84.56% | 54.74% | 9.96% | 27,313,945 | 4,966,201 | Wendell Willkie | Rep. | 62.4% |
| 20 | 1864 | Abraham Lincoln | Rep. | 212/233 | 90.99% | 55.03% | 10.08% | 2,211,317 | 405,090 | George McClellan | Dem. | 76.3% |
| 19 | 1860 | Abraham Lincoln | Rep. | 180/303 | 59.41% | 39.65% | 10.13% | 1,855,993 | 474,049 | John Breckinridge | Dem. | 81.8% |
| 42 | 1952 | Dwight Eisenhower | Rep. | 442/531 | 83.24% | 55.18% | 10.85% | 34,075,529 | 6,700,439 | Adlai Stevenson | Dem. | 62.3% |
| 22 | 1872 | Ulysses Grant | Rep. | 286/352 | 81.25% | 55.58% | 11.80% | 3,597,439 | 763,729 | Horace Greeley | L. R. | 72.1% |
| 18 | 1856 | James Buchanan | Dem. | 174/296 | 58.78% | 45.29% | 12.20% | 1,835,140 | 494,472 | John Frémont | Rep. | 79.4% |
| 11 | 1828 | Andrew Jackson | Dem. | 178/261 | 68.20% | 55.93% | 12.25% | 642,806 | 140,839 | John Quincy Adams | N. R. | 57.3% |
| 13 | 1836 | Martin Van Buren | Dem. | 170/294 | 57.82% | 50.79% | 14.20% | 763,291 | 213,384 | William Henry Harrison | Whig | 56.5% |
| 32 | 1912 | Woodrow Wilson | Dem. | 435/531 | 81.92% | 41.84% | 14.44% | 6,296,284 | 2,173,563 | Theodore Roosevelt | Prog. | 59.0% |
| 43 | 1956 | Dwight Eisenhower | Rep. | 457/531 | 86.06% | 57.37% | 15.40% | 35,579,180 | 9,551,152 | Adlai Stevenson | Dem. | 60.2% |
| 36 | 1928 | Herbert Hoover | Rep. | 444/531 | 83.62% | 58.21% | 17.41% | 21,427,123 | 6,411,659 | Al Smith | Dem. | 56.9% |
| 37 | 1932 | Franklin Roosevelt | Dem. | 472/531 | 88.89% | 57.41% | 17.76% | 22,821,277 | 7,060,023 | Herbert Hoover | Rep. | 56.9% |
| 12 | 1832 | Andrew Jackson | Dem. | 219/286 | 76.57% | 54.74% | 17.81% | 702,735 | 228,628 | Henry Clay | N. R. | 57.0% |
| 50 | 1984 | Ronald Reagan | Rep. | 525/538 | 97.58% | 58.77% | 18.21% | 54,455,472 | 16,878,120 | Walter Mondale | Dem. | 55.2% |
| 30 | 1904 | Theodore Roosevelt | Rep. | 336/476 | 70.59% | 56.42% | 18.83% | 7,630,557 | 2,546,677 | Alton Brooks Parker | Dem. | 65.5% |
| 45 | 1964 | Lyndon Johnson | Dem. | 486/538 | 90.33% | 61.05% | 22.58% | 43,127,041 | 15,951,287 | Barry Goldwater | Rep. | 62.8% |
| 47 | 1972 | Richard Nixon | Rep. | 520/538 | 96.65% | 60.67% | 23.15% | 47,168,710 | 17,995,488 | George McGovern | Dem. | 56.2% |
| 38 | 1936 | Franklin Roosevelt | Dem. | 523/531 | 98.49% | 60.80% | 24.26% | 27,752,648 | 11,070,786 | Alf Landon | Rep. | 61.0% |
| 35 | 1924 | Calvin Coolidge | Rep. | 382/531 | 71.94% | 54.04% | 25.22% | 15,723,789 | 7,337,547 | John Davis | Dem. | 48.9% |
| 34 | 1920 | Warren Harding | Rep. | 404/531 | 76.08% | 60.32% | 26.17% | 16,144,093 | 7,004,432 | James Cox | Dem. | 49.2% |
Note: The popular vote was not recorded prior to the 1824 election, so the first nine US presidential elections are not included in this table.
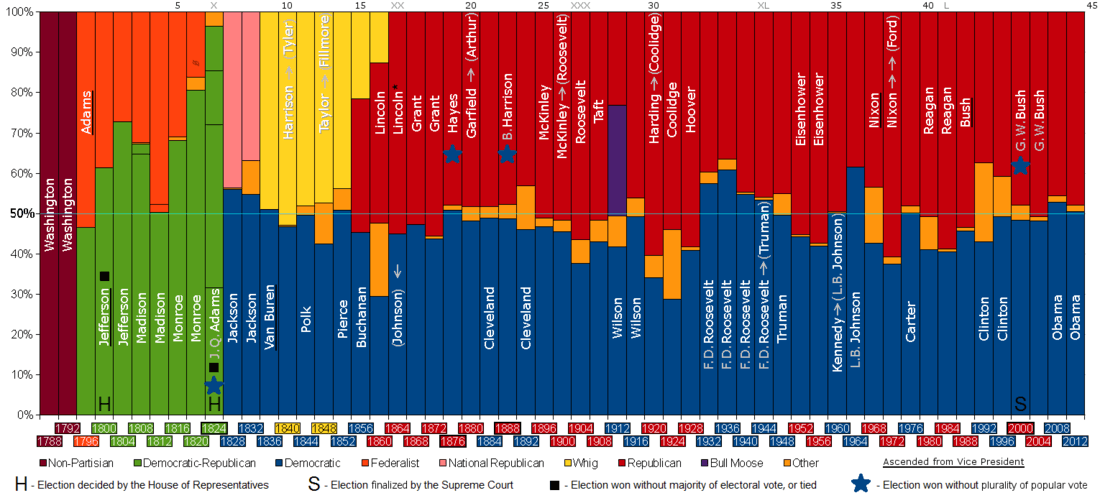
Timeline
See also
- List of United States presidential elections by Electoral College margin
- United States presidential elections in which the winner lost the popular vote
References
- ↑ http://uselectionatlas.org/
- ↑ McDonald, Michael P. (11 June 2014). "National General Election VEP Turnout Rates, 1789-Present". United States Elections Project. Retrieved 16 November 2016.
- Leip, David. Dave Leip's Atlas of U.S. Presidential Elections.
- Peters, Gerhard. Voter Turnout in Presidential Elections.
External links
- How close were U.S. Presidential Elections? - Michael Sheppard, Massachusetts Institute of Technology