Population growth
In biology, population growth is the increase in the number of individuals in a population.
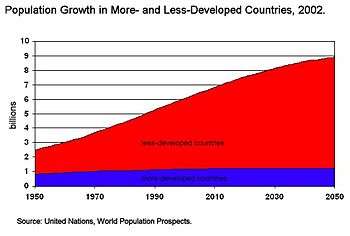
Global human population growth amounts to around 75 million annually, or 1.1% per year. The global population has grown from 1 billion in 1800 to 7 billion in 2012. It is expected to keep growing, and estimates have put the total population at 8.4 billion by mid-2030, and 9.6 billion by mid-2050. Many nations with rapid population growth have low standards of living, whereas many nations with low rates of population growth have high standards of living.[1]
| Population[2] | ||
|---|---|---|
| Years Passed | Year | Billion |
| - | 1800 | 1 |
| 127 | 1927 | 2 |
| 33 | 1960 | 3 |
| 14 | 1974 | 4 |
| 13 | 1987 | 5 |
| 12 | 1999 | 6 |
| 12 | 2011 | 7 |
| 14 | 2025* | 8 |
| 18 | 2043* | 9 |
| 40 | 2083* | 10 |
| * UNFPA United Nations Population Fund estimate 31.10.2011 | ||
Population growth rate
The "population growth rate" is the rate at which the number of individuals in a population increases in a given time period, expressed as a fraction of the initial population. Specifically, population growth rate refers to the change in population over a unit time period, often expressed as a percentage of the number of individuals in the population at the beginning of that period. This can be written as the formula, valid for a sufficiently small time interval:

A positive growth rate indicates that the population is increasing, while a negative growth rate indicates that the population is decreasing. A growth ratio of zero indicates that there were the same number of individuals at the beginning and end of the period—a growth rate may be zero even when there are significant changes in the birth rates, death rates, immigration rates, and age distribution between the two times.[3]
A related measure is the net reproduction rate. In the absence of migration, a net reproduction rate of more than 1 indicates that the population of females is increasing, while a net reproduction rate less than one (sub-replacement fertility) indicates that the population of females is decreasing.
Human population growth rate

|
7–8 children
6–7 children
|
5–6 children
4–5 children
|
3–4 children
2–3 children
|
1–2 children
0–1 children
|
.svg.png)
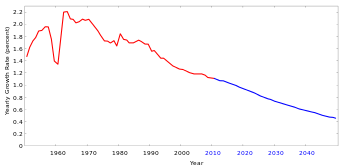
In 2009, the estimated annual growth rate was 1.1%.[4] The CIA World Factbook gives the world annual birthrate, mortality rate, and growth rate as 1.86%, 0.78%, and 1.08% respectively.[5] The last 100 years have seen a massive fourfold increase in the population, due to medical advances, lower mortality rates, and an increase in agricultural productivity[6] made possible by the Green Revolution.
The annual increase in the number of living humans peaked at 88.0 million in 1989, then slowly declined to 73.9 million in 2003, after which it rose again to 75.2 million in 2006. In 2009, the human population increased by 74.6 million.[4] Generally, developed nations have seen a decline in their growth rates in recent decades, though annual growth rates remain above 2% in poverty-stricken countries of the Middle East and Sub-Saharan Africa, and also in South Asia, Southeast Asia, and Latin America.[7]
In some countries the population is declining, especially in Eastern Europe, mainly due to low fertility rates, high death rates and emigration. In Southern Africa, growth is slowing due to the high number of AIDS-related deaths. Some Western Europe countries might also experience population decline.[8] Japan's population began decreasing in 2005; it now has the highest standard of living in the world.[9]
The United Nations Population Division projects world population to peak at over 10 billion at the end of the 21st century, but Sanjeev Sanyal has argued that global fertility will fall below the replacement rate in the 2020s and that world population will peak below 9 billion by 2050, followed by a long decline.[10]
Growth by country
According to United Nations population statistics, the world population grew by 30%, or 1.6 billion humans, between 1990 and 2010.[11] In number of people the increase was highest in India (350 million) and China (196 million). Population growth was among highest in the United Arab Emirates (315%) and Qatar (271%).[11]
| Rank | Country | Population 2010 |
Population 1990 |
Growth (%) 1990–2010 |
|---|---|---|---|---|
| World | 6,895,889,000 | 5,306,425,000 | 30.0% | |
| 1 | |
1,341,335,000 | 1,145,195,000 | 17.1% |
| 2 | |
1,224,614,000 | 873,785,000 | 40.2% |
| 3 | |
310,384,000 | 253,339,000 | 22.5% |
| 4 | |
239,871,000 | 184,346,000 | 30.1% |
| 5 | |
194,946,000 | 149,650,000 | 30.3% |
| 6 | |
173,593,000 | 111,845,000 | 55.3% |
| 7 | |
158,423,000 | 97,552,000 | 62.4% |
| 8 | |
148,692,000 | 105,256,000 | 41.3% |
| 9 | |
142,958,000 | 148,244,000 | -3.6% |
| 10 | |
128,057,000 | 122,251,000 | 4.7% |
| Example nation | 1967 population | 1990 population | 1994 population | 2002 population | 2008 population | Life expectancy in years (2008) | Total population growth from 1960s to 2007- 2011 |
|---|---|---|---|---|---|---|---|
| Eritrea* | N/A* | N/A* | 3,437,000[12] | 4,298,269 | 5,673,520[13] | 61[14][14] | 2,236,520 |
| Ethiopia* | 23,457,000*[15] | 50,974,000* [16] | 54,939,000[12] | 67,673,031(2003) | 79,221,000[17] | 55[14] | 55,764,000 |
| Sudan† | 14,355,000†[15] | 25,204,000† [16] | 27,361,000†[12] | 38,114,160 (2003)† | 42,272,000†[18] | 50†[14] | 27,917,000 |
| Chad | 3,410,000[15] | 5,679,000[16] | 6,183,000[12] | 9,253,493(2003) | 10,329,208 (2009)[19] | 47[14] | 6,919,205 |
| Niger | 3,546,000[15] | 7,732,000[16] | 8,846,000[12] | 10,790,352 (2001) | 15,306,252 (2009)[20] | 44[14] | 11,760,252 |
| Nigeria | 61,450,000[15] | 88,500,000[16] | 108,467,000[12] | 129,934,911 | 158,259,000[21] | 47[14] | 96,809,000 |
| Mali | 4,745,000[15] | 8,156,000,[16] | 10,462,000[12] | 11,340,480 | 14,517,176(2010).[22] | 50[14] | 9,772,176 |
| Mauritania | 1,050,000[15] | 2,025,000 [16] | 2,211,000[12] | 2,667,859 (2003) | 3,291,000 (2009)[19] | 54[14] | 2,241,000 |
| Senegal | 3,607,000[15] | 7,327,000[16] | 8,102,000[12] | 9,967,215 | 13,711,597 (2009)[23] | 57[14] | 10,104,597 |
| Gambia | 343,000[15] | 861,000[16] | 1,081,000[12] | 1,367,124 (2000) | 1,705,000[21] | 55[14] | 1,362,000 |
| Algeria | 11,833,126 (1966)[15] | 25,012,000[16] | 27,325,000 [12] | 32,818,500 (2003) | 34,895,000[17][24] | 74[14] | 23,061,874 |
| The DRC/Zaire | 16,353,000[15] | 35,562,000[16] | 42,552,000[12] | 55,225,478 (2003) | 70,916,439 [17][25] | 54[14] | 54,563,439 |
| Egypt | 30,083,419 (1966)[15] | 53,153,000[16] | 58,326,000[12] | 70,712,345 (2003) | 79,089,650 [17][26][26] | 72[14] | 49,006,231 |
| Réunion (French colony/overseas department) | 418,000[15] | N/A[16] | N/A[12] | 720,934 (2003) | 827,000 (2009) [24] | N/A[14] | 409,000 |
| The Falkland Islands (UK Territory) | 2,500[15] | N/A[16] | N/A[12] | 2,967 (2003) | 3,140(2010)[19] | N/A[14] | 640 |
| Chile | 8,935,500[15] | 13,173,000[16] | 13,994,000[12] | 15,116,435 | 17,224,200 (2011) | 77[14] | 8,288,700 |
| Colombia | 19,191,000[15] | 32,987,000[16] | 34,520,000[12] | 41,088,227 | 45,925,397(2010)[27] | 73[14] | 26,734,397 |
| Brazil | 85,655,000[15] | 150,368,000[16] | 153,725,000[12] | 174,468,575 (2000) | 190,732,694(2010) [28] | 72[14] | 105,077,694 |
| Mexico | 45,671,000[15] | 86,154,000[16] | 93,008,000[12] | 103,400,165 (2000) | 112,322,757(2010)[29] | 76[14] | 66,651,757 |
| Fiji | 476,727 (1966)[15] | 765,000[16] | 771,000[12] | 844,330 (2001) | 849,000[24] (2010) | 70[14] | 372,273 |
| Nauru | 6,050 (1966)[15] | 10,000[16] | N/A[12] | 12,329 | 9,322 (2011)[30] | N/A[14] | 3,272 |
| Jamaica | 1,876,000[15] | 2,420,000[16] | 2,429,000[12] | 2,695,867 (2003) | 2,847,232[31](2010) | 74[14] | 971,232 |
| Australia | 11,540,764 (1964)[15] | 17,086,000[16] | 17,843,000[12] | 19,546,792 (2003) | 24,420,782[32] (2010) | 82[14] | 10,066,508 |
| Albania | 1,965,500 (1964)[15] | 3,250,000[16] | 3,414,000[12] | 3,510,484 | 2,986,952 (July 2010 est.)[19][33] (2010) | 78[14] | 1,021,452 |
| Poland | 31,944,000[15] | 38,180,000[16] | 38,554,000[12] | 38,626,349 (2001) | 38,192,000(2010)[34] | 75[14] | 6,248,000 |
| Hungary | 10,212,000[15] | 10,553,000[16] | 10,261,000[12] | 10,106,017 | 9,979,000(2010)[35] | 73[14] | -142,000 |
| Bulgaria | 8,226,564 (1965)[15] | 8,980,000[16] | 8,443,000[12] | 7,707,495(2000) | 7,351,234 (2011)[36] | 73[14] | -875,330 |
| United Kingdom | 55,068,000 (1966)[15] | 57,411,000[16] | 58,091,000[12] | 58,789,194 | 62,008,048 (2010)[37] | 79[14] | 7,020,048 |
| Republic of Ireland | 2,884,002 (1966)[15] | 3,503,000[16] | 3,571,000[12] | 3,840,838 (2000) | 4,470,700 [38] (2010) | 78[14] | 1,586,698 |
| The PRC/China | 720,000,000[15] | 1,139,060,000[16] | 1,208,841,000[12] | 1,286,975,468 (2004) | 1,339,724,852(2010)[39] | 73[14] | 619,724,852 |
| Japan‡ | 98,274,961 (1965)[15] | 123,537,000[16] | 124,961,000[12] | 127,333,002 | 127,420,000 (2010)[40] | 82[14] | 28,123,865 |
| Ryukyu Islands (Once occupied by the United States)‡ | 934,176 (1965)[15] | N/A | N/A | N/A | N/A | N/A | N/A |
| India# | 511,115,000[15] | 843,931,000[16] | 918,570,000[12] | 1,028,610,328 (2001) | 1,210,193,422(2011)[41] | 69[14] | 699,078,422 |
| Singapore | 1,956,000 (1967)[15] | 3,003,000 (1990) [16] | 2,930,000 (1994)[12] | 4,452,732 (2002) | 5,076,700(2010)[24] | 82 (2008)[14] | 3,120,700 |
| Sikkim# | 183,000 (1967)[15] | N/A | N/A | N/A | N/A | N/A | N/A |
| Monaco | 24,000 (1967)[15] | 29,000 (1990) [16] | N/A (1994)[12] | 31,842 (2000) | 35,586[42] (2010) | (2008)[14] | 1,586 |
| Greece | 8,716,000 (1967)[15] | 10,123,000 (1990) [16] | 10,426,000 (1994)[12] | 10,964,020(2001)[43] | 11,305,118(2011)[44] | N/A (2008)[14] | 2,589,118 |
| Faroe Islands (Danish dependency) | 38,000 (1967)[15] | N/A(1990) [16] | N/A(1994)[12] | 46,345 (2000) | 48,917(2010) [45] | N/A (2008)[14] | 18,917 |
| Liechtenstein | 20,000 (1967)[15] | 29,000 (1990) [16] | N/A (1994)[12] | 33,307(2000) | 35,789(2009)[46] | (2008)[14] | 15,789 |
| South Korea | 29,207,856 (1966)[15] | 42,793,000 (1990) [16] | 44,453,000 (1994)[12] | 48,324,000 (2003) | 48,875,000(2010) [47] | (2008)[14] | 19,667,144 |
| North Korea | 12,700,000 (1967)[15] | 21,773,000 (1990) [16] | 23,483,000 (1994)[12] | 22,224,195 (2002) | 24,051,218(2010)[48] | (2008)[14] | 11,351,218 |
| Brunei | 107,200 (1967)[15] | 266,000(1990) [16] | 280,000 (1994)[12] | 332,844 (2001) | 401,890(2011)[19] | 76(2008)[14] | 306,609 |
| Malaysia | 10,671,000 (1967)[15] | 17,861,000 (1990) [16] | 19,489,000 (1994)[12] | 21,793,293(2002) | 27,565,821(2010)[49] | (2008)[14] | 16,894,821 |
| Thailand | 32,680,000 (1967)[15] | 57,196,000 (1990) [16] | 59,396,000 (1994)[12] | 60,606,947(2000)[50] | 63,878,267(2011)[51] | (2008)[14] | 31,198,267 |
| Lebanon | 2,520,000 (1967)[15] | 2,701,000 (1990) [16] | 2,915,000 (1994)[12] | 3,727,703 [52] (2003) | 4,224,000[53](2009) | - (2008)[14] | |
| Syria | 5,600,000 (1967)[15] | 12,116,000 (1990) [16] | 13,844,000 (1994)[12] | 17,585,540 (2003) | 22,457,763(2011)[54] | -(2008)[14] | |
| Bahrain | 182,00 (1967)[15] | 503,000 (1990) [16] | 549,000 (1994)[12] | 667,238 (2003) | 1,234,596 [55] (2010) | 75(2008)[14] | |
| Sri Lanka | 11,741,000 (1967)[15] | 16,993,000 (1990) [16] | 17,685,000 (1994)[12] | 19,607,519 (2002) | 20,238,000[24] (2009) | - (2008)[14] | |
| Switzerland | 6,050,000 (1967)[15] | 6.712,000 (1990) [16] | 6,994,000 (1994)[12] | 7,261,200 (2002) | 7,866,500[56] (2010) | - (2008)[14] | |
| Luxembourg | 335,000 (1967)[15] | 381,000 (1990) [16] | 401,000 (1994)[12] | 439,539 (2001) | 511,840(2011)[57] | -(2008)[14] | |
| Romania | 19,105,056 (1966)[15] | 23,200,000 (1990) [16] | 22,736,000 (1994)[12] | 21,680,974 (2002) | 21,466,174[58] (2011) | - (2008)[14] | |
| Niuē (New Zealand colony) | 1,900 (1966)[15] | N/A (1990) [16] | N/A (1994)[12] | 2,134 (2002) | 1,398(2009)[59] | N/A (2008)[14] | -502 |
| Tokelau (New Zealand colony) | 5,194 (1966)[15] | N/A (1990) [16] | N/A (1994)[12] | 1,445(2001) | 1,416(2009) | N/A (2008)[14] | -3,778 |
| Jamaica | 1,876,000 (1967)[15] | 2,420,000 (1990) [16] | 2,429,000 (1994)[12] | 2,695,867 (2003) | 2,847,232[31](2010) | 74 (2008)[14] | 971,232 |
| Argentina | 32,031,000 (1967)[15] | 32,322,000(1990) [16] | 34,180,000 (1994)[12] | 37,812,817 (2002) | 40,091,359 (2010) | 74 (2008)[14] | 8,060,359 |
| France | 49,890,660 (1967)[15] | 56,440,000(1990) [16] | 57,747,000 (1994)[12] | 59,551,000 (2001) | 63,136,180(2011)[60] | 81 (2008)[14] | |
| Italy | 52,334,000(1967)[15] | 57,662,000 (1990) [16] | 57,193,000 (1994)[12] | 56,995,744 (2002) | 60,605,053[61] (2011) | 80 (2008)[14] | |
| Mauritius | 774,000 (1967)[15] | 1,075,000(1990) [16] | 1,104,000(1994)[12] | 1,179,137 (2000) | 1,288,000 (2009)[24] | 75 (2008)[14] | 514,000 |
| Guatemala | 4,717,000 (1967)[15] | 9,197,000 (1990) [16] | 10,322,000 (1994)[12] | 12,974,361 (2000) | 13,276,517 (2009) | 70 (2008)[14] | 8,559,517 |
| Cuba | 8,033,000 (1967)[15] | 10,609,000 (1990) [16] | 10,960,000 (1994)[12] | 11,177,743 (2002) | 11,239,363(2009)[62] | 77 (2008)[14] | |
| Barbados | 246,000 (1967)[15] | 255,000 (1990) [16] | 261,000 (1994)[12] | 250,012 (2001) | 284,589(2010)[19] | 73 (2008)[14] | 18,589 |
| Samoa | 131,377 (1967)[15] | 164,000 (1990) [16] | 164,000 (1994)[12] | 178,173 (2003) | 179,000(2009)[24] | N/A (2008)[14] | |
| Sweden | 7,765,981 (1967)[15] | 8,559,000 (1990) [16] | 8,794,000 (1994)[12] | 8,920,705 (2002) | 9,354,462 (2009) | 81 (2008)[14] | |
| Finland | 4,664,000 (1967)[15] | 4,986,000 (1990) [16] | 5,095,000 (1994)[12] | 5,175,783 (2002) | 5,374,781 (2010) | N/A (2008)[14] | |
| Portugal | 9,440,000 (1967)[15] | 10,525,000 (1990) [16] | 9,830,000 (1994)[12] | 10,355,824 (2001) | 10,647,763[63](2011) | N/A (2008)[14] | |
| Austria | 7,323,981 (1967)[15] | 7,712,000 (1990) [16] | 8,031,000 (1994)[12] | 8,032,926 (2001) | 8,404,252 (2011) | N/A (2008)[14] | |
| Libya | 1,738,000 (1967)[15] | 4,545,000 (1990) [16] | 5,225,000(1994)[12] | 5,499,074 (2002) | 6,420,000 (2009)[24] | 77 (2008)[14] | |
| Peru | 12,385,000 (1967)[15] | 21,550,000 (1990) [16] | 23,080,000(1994)[12] | 27,949,639 (2002) | 29,496,000(2010) | 70 (2008)[14] | |
| Guinea Bissau | 528,000 (1967)[15] | 965,000 (1990) [16] | 1,050,000 (1994)[12] | 1,345,479 (2002) | 1,647,000[24](2009) | 48 (2008)[14] | |
| Angola | 5,203,066 (1967)[15] | 10,020,000 (1990) [16] | 10,674,000 (1994)[12] | 10,766,500(2003) | 18,498,000[24][64](2009) | (38 2008)[14] | |
| Equatorial Guinea | 277,000 (1967)[15] | 348,000 (1990) [16] | 389,000 (1994)[12] | 474,214 (2000) | 676,000(2009)[24] | 61 (2008)[14] | |
| Benin | 2,505,000 (1967)[15] | 4,736,000 (1990) [16] | 5,246,000(1994)[12] | 8,500,500 (2002) | 8,791,832 (2009) | 59 (2008)[14] | |
| Laos | 2,770,000 (1967)[15] | 4,139,000 (1990) [16] | 4,742,000 (1994)[12] | 5,635,967 (2002) | 6,800,000[65] (2011) | 56(2008)[14] | |
| Nepal | 10,500,000 (1967)[15] | 18,961,000 (1990) [16] | 21,360,000 (1994)[12] | 25,284,463 (2002) | 29,331,000[24] (2009) | (2008)[14] | |
| Iran | 25,781,090 (1966)[15] | 54,608,000(1990) [16] | 59,778,000(1994)[12] | 66,622,704 (2002) | 75,330,000 (2010) [41] | 71 (2008)[14] | |
| Canada | 20,014,880 (1966)[15] | 26,603,000(1990) [16] | 29,248,000(1994)[12] | 31,081,900 (2001) | 32,623,490(2011)[66] | 81 (2008)[14] | |
| United States | 199,118,000 (1967)[15] | 249,995,000(1990) [16] | 260,650,00(1994)[12] | 281,421,906 (2000) | 308,745,538(2010)[67] | 78(2008)[14] | |
| Uganda | 7,931,000 (1967)[15] | 18,795,000 (1990) [16] | 20,621,000(1994)[12] | 24,227,297 (2002) | 32,369,558 (2009) | 52 (2008)[14] |
- Notes
- * Eritrea left Ethiopia in 1991.
- † Split into the nations of Sudan and South Sudan during 2011.
- ‡ Japan and the Ryukyu Islands merged in 1972.
- # India and Sikkim merged in 1975.
| Population growth 1990–2012 (%)[68] | |
|---|---|
| Africa | 73.3% |
| Middle East | 68.2% |
| Asia (excl. China) | 42.8% |
| China | 19.0% |
| OECD Americas | 27.9% |
| Non-OECD Americas | 36.6% |
| OECD Europe | 11.5% |
| OECD Asia Oceania | 11.1% |
| Non-OECD Europe and Eurasia | -0.8% |

Into the future

According to the UN's 2010 revision to its population projections, world population is projected to peak at 10.1 billion in 2100 compared to 7 billion in 2011.[69] A 2014 paper by demographers from several universities and the United Nations Population Division projected that the world's population would reach about 10.9 billion in 2100 and continue growing thereafter.[70] However, some experts dispute the UN's figures and have argued that birth rates will fall below replacement rate in the 2020s. According to their projections, population growth will be only sustained till the 2040s by rising longevity, but will peak below 9 bn by 2050.[10]
See also
- Baby boom
- Biological exponential growth
- Demographic history
- Demographic transition
- Density dependence
- Doubling time
- Fertility factor (demography)
- Irruptive growth
- List of countries by population growth rate
- Natalism and Antinatalism
- Population bottleneck
- Population decline
- Population dynamics
- World population
References
- ↑ Population Reference Bureau. "2013 World Population Factsheet" (PDF). www.pbr.org. Population Reference Bureau. Retrieved 5 December 2014.
- ↑ 7. miljardis ihminen, Helsingin Sanomat editor Mr Timo Paukku 5.9.2011 D1 (Finnish)
- ↑ Association of Public Health Epidemiologists in Ontario
- 1 2 "International Programs".
- ↑ "The World Factbook". 20 November 2015. Retrieved 4 January 2016.
- ↑ "BBC NEWS - South Asia - The end of India's green revolution?".
- ↑ "International Programs". Archived from the original on 2009-07-01.
- ↑ UN population projections
- ↑ "Japan sees biggest population fall". the Guardian.
- 1 2 Sanjeev Sanyal. "Sanjeev Sanyal on The End of Population Growth - Project Syndicate". Project Syndicate.
- 1 2 "World Population Prospects - Population Division - United Nations".
- 1 2 3 4 5 6 7 8 9 10 11 12 13 14 15 16 17 18 19 20 21 22 23 24 25 26 27 28 29 30 31 32 33 34 35 36 37 38 39 40 41 42 43 44 45 46 47 48 49 50 51 52 53 54 55 56 57 58 59 60 61 62 63 64 65 66 67 68 69 70 71 72 73 74 75 76 The British Collins Longman Student Atlas, the 1996 and in 1998 publications, ISBN 978-0-00-448879-0 for the 1998 edition, ISBN 0-00-448365-0 for the 1996 edition
- ↑ url=http://www.un.org/esa/population/publications/wpp2008/wpp2008_text_tables.pdf
- 1 2 3 4 5 6 7 8 9 10 11 12 13 14 15 16 17 18 19 20 21 22 23 24 25 26 27 28 29 30 31 32 33 34 35 36 37 38 39 40 41 42 43 44 45 46 47 48 49 50 51 52 53 54 55 56 57 58 59 60 61 62 63 64 65 66 67 68 69 70 71 72 73 74 75 76 77 'Modern School Atlas (96th edition)', ISBN 978-1-84907-013-3.
- 1 2 3 4 5 6 7 8 9 10 11 12 13 14 15 16 17 18 19 20 21 22 23 24 25 26 27 28 29 30 31 32 33 34 35 36 37 38 39 40 41 42 43 44 45 46 47 48 49 50 51 52 53 54 55 56 57 58 59 60 61 62 63 64 65 66 67 68 69 70 71 72 73 74 75 76 77 The British Oxford economic atlas of the World 4th edition, ISBN 0-19-894107-2
- 1 2 3 4 5 6 7 8 9 10 11 12 13 14 15 16 17 18 19 20 21 22 23 24 25 26 27 28 29 30 31 32 33 34 35 36 37 38 39 40 41 42 43 44 45 46 47 48 49 50 51 52 53 54 55 56 57 58 59 60 61 62 63 64 65 66 67 68 69 70 71 72 73 74 75 The British Collins Atlas of the World, the 1993 edition, ISBN 0-00-448038-4
- 1 2 3 4 Ethiopia Central Statistics Office -- Population Projection for mid-2008 Archived January 5, 2012, at the Wayback Machine.
- ↑ Department of Economic and Social Affairs. "World Population Prospects, Table A.1" (PDF). 2008 revision. United Nations.
- 1 2 3 4 5 6 "Falkland Islands (Islas Malvinas)". The World Factbook. CIA. Retrieved 5 March 2010.
- ↑ Central Intelligence Agency (2009). "Niger". The World Factbook. Retrieved January 10, 2010.
- 1 2 Department of Economic and Social Affairs Population Division (2009). "World Population Prospects, Table A.1" (PDF). 2008 revision. United Nations. Retrieved 2009-03-12.
- ↑ "Mali preliminary 2009 census". Institut National de la Statistique. Archived from the original on April 18, 2010. Retrieved January 12, 2010.
- ↑ Central Intelligence Agency (2009). "Senegal". The World Factbook. Retrieved January 10, 2010.
- 1 2 3 4 5 6 7 8 9 10 11 12 Department of Economic and Social Affairs Population Division (2010). "World Population Prospects, Table A.1" (PDF). 2008 revision. United Nations. Retrieved 2009-03-12.
- ↑ The World Factbook- Congo, Democratic Republic of the. Central Intelligence Agency.
- 1 2 "Central Agency for Population Mobilisation and Statistics — Population Clock (July 2008)". Msrintranet.capmas.gov.eg. Retrieved 2010-08-25.
- ↑ "Departamento Administrativo Nacional de Estadística". Dane.gov.co. Retrieved 2010-08-22.
- ↑ IBGE. Censo 2010: população do Brasil é de 190.732.694 pessoas.
- ↑ "INEGI 2010 Census Statistics". inegi.org.mx. Retrieved 2010-11-25.
- ↑ Central Intelligence Agency (2011). "Nauru". The World Factbook. Retrieved 12 February 2011.
- 1 2 "The World Factbook".
- ↑ "Population clock". Australian Bureau of Statistics website. Commonwealth of Australia. Retrieved 12 April 2011. The population estimate shown is automatically calculated daily at 00:00 UTC and is based on data obtained from the population clock on the date shown in the citation.
- ↑ "IFs Forecast - Version 7.00-Google Public Data Explorer".
- ↑ "Wzrasta liczba ludności Polski - Wiadomości - WP.PL". Wiadomosci.wp.pl. 2010-07-23. Retrieved 2010-07-27.
- ↑ Hungarian Central Statistical Office. Retrieved 25 July 2010.
- ↑ http://www.nsi.bg/EPDOCS/Census2011pr.pdf
- ↑ "Total population at 1 January". Eurostat. 11 March 2011. Retrieved 29 April 2011.
- ↑ "CSO – Population and Migration Estimates April 2010" (PDF). September 2010. Retrieved 21 September 2010.
- ↑ Communiqué of the National Bureau of Statistics of People's Republic of China on Major Figures of the 2010 Population Census Archived November 8, 2013, at the Wayback Machine.
- ↑ "Statistics Bureau Home Page/Population Estimates Monthly Report".
- 1 2 "Provisional Population Totals - Census 2011". Indian Census Bureau 2011. Retrieved 2011-03-29.
- ↑ Monaco, The World Factbook, Central Intelligence Agency. Retrieved 7 June 2010.
- ↑ "Πίνακας 1. Πληθυσμός κατά φύλο και ηλικία" (PDF). National Statistical Service of Greece: Population census of 18 March 2001. Archived from the original (PDF) on March 25, 2009.
- ↑ "Total population". Eurostat. 1 January 2010. Retrieved 8 January 2010.
- ↑ (Faroese)
- ↑ Bevölkerungsstatistik 30. Juni 2009, Landesverwaltung Liechtenstein.
- ↑ "총인구, 인구성장률 : 지표상세화면". Index.go.kr. Retrieved 2010-10-29.
- ↑ (Korean) UNFPA (2009-10-01). "한반도 인구 7천400만명 시대 임박". United Nations. Retrieved 2010-04-14.
- ↑ "Laporan Kiraan Permulaan 2010". Jabatan Perangkaan Malaysia. p. iii. Archived from the original on 27 December 2010. Retrieved 31 January 2011.
- ↑ "Population and Housing Census 2000, National Statistical Office". Web.nso.go.th. 2000-04-01. Retrieved 2010-04-25.
- ↑ "Archived copy" (PDF). Archived from the original (PDF) on 2011-07-16. Retrieved 2011-07-16.
- ↑ "Central Intelligence Agency. March 2011 est". Cia.gov. Retrieved 2011-04-23.
- ↑ "World Population Prospects, Table A.1" (PDF). 2008 revision. United Nations Department of Economic and Social Affairs. 2009: 17. Retrieved 22 September 2010.
- ↑ "Central Intelligence Agency. March 2011 est". Cia.gov. Retrieved 2011-04-23.
- ↑ "REMARKABLE GROWTH EXPATS OUTNUMBER BAHRAINIS IN 2010 CENSUS". Bahraini Census 2010. 2010-11-28. Archived from the original on February 19, 2011. Retrieved 14 February 2011.
- ↑ "Population size and population composition". Swiss Federal Statistical Office. Swiss Federal Statistical Office, Neuchâtel. 2010. Retrieved 2011-04-29.
- ↑ "Population: 511 840 habitants au 1er janvier 2011", Le Portail des statistiques: Grand-Duché de Luxembourg, 3 May 2011. (French) Retrieved 4 May 2011.
- ↑ "Romania - Population". epp.eurostat.ec.europa.eu. Retrieved 26 May 2011.
- ↑ "Niue". The World Factbook. Central Intelligence Agency. Retrieved 2009-07-20.
- ↑ (French) INSEE, Government of France. "Population totale par sexe et âge au 1er janvier 2011, France métropolitaine". Retrieved 20 January 2011.
- ↑ (Italian) "Monthly demographic balance: January–November 2010" (PDF). Istat. 28 March 2011. Retrieved 2 April 2011.
- ↑ Anuario Estadístico de Cuba 2009. Edición 2010, Oficina Nacional de Estadísticas, República de Cuba. Accessed on November 6, 2010. Note: An exchange rate of 1 CUC to 1.08 USD was used to convert GDP.
- ↑ Pordata, "Base de Dados Portugal Contemporâneo". Accessed on March 7, 2011.
- ↑ "Population Forecast to 2060 by International Futures hosted by Google Public Data Explorer". Google.com. Retrieved 2011-07-13.
- ↑ "Background notes - Laos". US Dept. of State. Retrieved 2011-01-20.
- ↑ "Estimated population of Canada, 1605 to present". Statistics Canada. 6 July 2009. Retrieved 2011-04-17.
- ↑ "Resident Population Data – 2010". U.S. Census Bureau. 2010. Archived from the original on 2011-10-28. Retrieved 2010-12-22.
- ↑ CO2 Emissions from Fuel Combustion Population 1971–2014 IEA (PDF Page 74, marked page 72)
- ↑ "World Population Prospects - Population Division - United Nations".
- ↑ Gerland, P.; Raftery, A. E.; Ev Ikova, H.; Li, N.; Gu, D.; Spoorenberg, T.; Alkema, L.; Fosdick, B. K.; Chunn, J.; Lalic, N.; Bay, G.; Buettner, T.; Heilig, G. K.; Wilmoth, J. (September 14, 2014). "World population stabilization unlikely this century". Science. AAAS. 346 (6206): 234–7. doi:10.1126/science.1257469. ISSN 1095-9203. PMC 4230924
 . PMID 25301627. Retrieved September 21, 2014.
External links
- World Population Prospects, the 2010 Revision, Website of the United Nations Population Division
- Probabilistic Population Projections, 2nd Revision, Website of the United Nations Population Division
- 2008 Essays on Population Growth Blue Planet United — Population Press
- World population growth and trends 1950-2050 US Census
- UN University annual "State of the Future" report, including updates on Millennium Project goals including balancing global population growth & resources
- Population Growth Rate By Country, aggregated time series data from 1960 to present
- BBC News - Birth rate 'harms poverty goals' - 08/12/06
- Tsirel, S. V. 2004. On the Possible Reasons for the Hyperexponential Growth of the Earth Population. Mathematical Modeling of Social and Economic Dynamics / Ed. by M. G. Dmitriev and A. P. Petrov, pp. 367–9. Moscow: Russian State Social University, 2004.
- Rosling, Hans (25 January 2009). "What stops population growth?". Gapminder. Retrieved 2009-07-06.