New York gubernatorial election, 2002
New York gubernatorial election, 2002
|
|
|
|
|
|
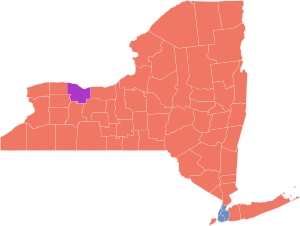
| County results |
|
|
The New York gubernatorial election of 2002 was an election for the state governorship held on November 5, 2002. Governor George Pataki, the two-term Republican incumbent, ran for a third term. Governor Pataki was re-elected to a third term in a landslide. His leadership and actions as governor during the September 11th Attacks put him over the top. He went on to defeat Carl McCall and Rochester billionaire Tom Golisano.
Background
In New York state politics, the proliferation of parties and ballot lines ensures that each candidate attempts to be listed under multiple ballot lines. Besides his standard Republican nomination, Governor Pataki sought the nominations of the Conservative and the Independence Party. Golisano, who sought (and ultimately won) the nomination of the Independence Party, also ran against the Governor in the Conservative primary, spending over $20 million during the primaries, or over $2000 per vote. Pataki secured the Republican and Conservative listings, while Golisano successfully defended his hold on the Independence Party ticket.[1]
Comptroller Carl McCall defeated Andrew Cuomo in the Democratic State Convention, and Cuomo withdrew less than a week before the primary, but this was too late to get his name off the Liberal line. Since Liberal supporters could no longer support the Democratic candidate, but vote for the Liberal line (and thus ensure that the Liberals would maintain ballot access), Cuomo's defeat effectively helped to destroy the Liberal Party.
Pataki was easily reelected; McCall received 33 percent of the vote, carrying New York City (other than Staten Island) and nearly carrying Albany County while Golisano received 14%, carrying western New York's Monroe County.
Primaries
Republican
Democratic
Democratic primary
Governor Polling
| Source |
Date |
H. Carl McCall |
Andrew Cuomo |
| Quinnipiac |
December 14, 2000 |
33% |
39% |
| Quinnipiac |
February 14, 2001 |
35% |
36% |
| Quinnipiac |
March 28, 2001 |
33% |
40% |
| Quinnipiac |
April 24, 2001 |
33% |
39% |
| Quinnipiac |
June 26, 2001 |
31% |
44% |
| Quinnipiac |
October 2, 2001 |
29% |
41% |
| Quinnipiac |
November 14, 2001 |
29% |
37% |
| Quinnipiac |
January 23, 2002 |
38% |
38% |
| Quinnipiac |
February 27, 2002 |
35% |
40% |
| Quinnipiac |
April 18, 2002 |
30% |
44% |
| Quinnipiac |
May 1, 2002 |
33% |
43% |
| Quinnipiac |
July 2, 2002 |
32% |
47% |
| Quinnipiac |
August 15, 2002 |
47% |
31% |
| Quinnipiac |
September 3, 2002 |
53% |
31% |
Lieutenant Governor Polling
| Source |
Date |
Dennis Mehiel |
Charlie King |
| Quinnipiac |
September 3, 2002 |
24% |
17% |
Republican primary
Polling
| Source |
Date |
George Pataki |
Rudolph Giuliani |
| Quinnipiac |
December 14, 2000 |
60% |
29% |
General election
Polling
| Source |
Date |
Andrew Cuomo (D) |
George Pataki (R) |
Thomas Golisano (I) |
| Quinnipiac |
December 14, 2000 |
37% |
48% |
- |
| Quinnipiac |
February 14, 2001 |
37% |
46% |
- |
| Quinnipiac |
March 28, 2001 |
36% |
48% |
- |
| Quinnipiac |
April 24, 2001 |
36% |
46% |
- |
| Quinnipiac |
June 26, 2001 |
39% |
47% |
- |
| Quinnipiac |
October 2, 2001 |
25% |
60% |
- |
| Quinnipiac |
November 14, 2001 |
25% |
57% |
- |
| Quinnipiac |
January 23, 2002 |
28% |
59% |
- |
| Quinnipiac |
February 27, 2002 |
28% |
59% |
- |
| Quinnipiac |
April 18, 2002 |
30% |
54% |
- |
| Quinnipiac |
May 1, 2002 |
26% |
59% |
- |
| Quinnipiac |
July 2, 2002 |
26% |
54% |
6% |
| Source |
Date |
H. Carl McCall (D) |
George Pataki (R) |
Thomas Golisano (I) |
| Quinnipiac |
December 14, 2000 |
36% |
48% |
- |
| Quinnipiac |
February 14, 2001 |
36% |
43% |
- |
| Quinnipiac |
March 28, 2001 |
35% |
48% |
- |
| Quinnipiac |
April 24, 2001 |
36% |
43% |
- |
| Quinnipiac |
June 26, 2001 |
35% |
46% |
- |
| Quinnipiac |
October 2, 2001 |
26% |
59% |
- |
| Quinnipiac |
November 14, 2001 |
24% |
56% |
- |
| Quinnipiac |
January 23, 2002 |
27% |
57% |
- |
| Quinnipiac |
February 27, 2002 |
29% |
57% |
- |
| Quinnipiac |
April 18, 2002 |
29% |
56% |
- |
| Quinnipiac |
May 1, 2002 |
27% |
58% |
- |
| Quinnipiac |
July 2, 2002 |
26% |
53% |
7% |
| Marist |
September 9, 2002 |
32% |
48% |
11% |
| Quinnipiac |
September 25, 2002 |
35% |
46% |
14% |
| Marist |
October 1, 2002 |
32% |
48% |
9% |
| Quinnipiac |
October 16, 2002 |
31% |
47% |
18% |
| The New York Times |
October 17, 2002 |
31% |
42% |
17% |
| Marist |
October 30, 2002 |
27% |
47% |
17% |
| Marist |
November 4, 2002 |
27% |
47% |
19% |
| Quinnipiac |
November 4, 2002 |
29% |
45% |
14% |
| Source |
Date |
Andrew Cuomo (D) |
Rudolph Giuliani (R) |
| Quinnipiac |
December 14, 2000 |
39% |
47% |
| Source |
Date |
H. Carl McCall (D) |
Rudolph Giuliani (R) |
| Quinnipiac |
December 14, 2000 |
39% |
45% |
Election Results
New York gubernatorial election, 2002[2]
| Party |
Candidate |
Votes |
% |
± |
|
Republican |
George Pataki |
2,085,407 |
45.54% |
|
|
Conservative |
George Pataki |
176,848 |
3.86% |
|
|
Total |
George Pataki |
2,262,255 |
49.40% |
-4.91% |
|
Democratic |
Carl McCall |
1,442,531 |
31.50% |
|
|
Working Families |
Carl McCall |
90,533 |
1.98% |
|
|
Total |
Carl McCall |
1,534,064 |
33.50% |
+0.34% |
|
Independence |
Tom Golisano |
654,016 |
14.28% |
+6.59% |
|
Right to Life |
Gerald Cronin |
44,195 |
0.97% |
-0.28% |
|
Green |
Stanley Aronowitz |
41,797 |
0.91% |
-0.63% |
|
Marijuana Reform |
Thomas K. Leighton |
21,977 |
0.48% |
-0.18% |
|
Liberal |
Andrew M. Cuomo |
15,761 |
0.34% |
-0.68% |
|
Libertarian |
Scott Jeffrey |
5,013 |
0.11% |
+0.01% |
| Majority |
728,191 |
15.90% |
-5.25% |
| Turnout |
4,579,078 |
|
|
|
Republican hold |
Swing |
|
|
Results by county
| County |
Pataki% |
Pataki# |
McCall% |
McCall# |
Golisano% |
Golisano# |
Cronin% |
Cronin# |
Aronowitz% |
Aronowitz# |
Others% |
Others# |
Total |
| Albany |
40.29% |
45,804 |
40.24% |
45,748 |
15.04% |
17,101 |
0.79% |
901 |
1.08% |
1,225 |
1.02% |
1,165 |
113,679 |
| Allegany |
59.02% |
8,134 |
14.82% |
2,042 |
19.47% |
2,683 |
1.42% |
196 |
0.70% |
96 |
0.88% |
121 |
13,782 |
| Bronx |
29.57% |
58,600 |
61.08% |
121,050 |
3.98% |
7,893 |
0.41% |
822 |
0.37% |
734 |
0.44% |
875 |
198,195 |
| Broome |
48.64% |
32,339 |
19.45% |
12,956 |
26.24% |
17,478 |
0.64% |
425 |
1.12% |
746 |
0.83% |
550 |
66,604 |
| Cattaraugus |
55.74% |
12,400 |
19.34% |
4,302 |
19.27% |
4,287 |
1.60% |
355 |
0.62% |
139 |
0.85% |
190 |
22,247 |
| Cayuga |
55.16% |
14,203 |
21.04% |
5,417 |
17.84% |
4,593 |
0.89% |
228 |
0.89% |
228 |
0.90% |
233 |
25,749 |
| Chautauqua |
59.41% |
22,869 |
21.62% |
8,323 |
14.93% |
5,747 |
0.89% |
341 |
0.44% |
170 |
0.94% |
360 |
38,493 |
| Chemung |
62.79% |
16,398 |
17.69% |
4,619 |
15.39% |
4,018 |
0.83% |
216 |
0.70% |
183 |
0.64% |
166 |
26,116 |
| Chenango |
59.50% |
8,676 |
17.34% |
2,529 |
17.81% |
2,597 |
0.79% |
115 |
1.54% |
225 |
0.94% |
137 |
14,582 |
| Clinton |
72.36% |
17,113 |
14.82% |
2,529 |
6.55% |
1,550 |
0.64% |
151 |
0.61% |
145 |
1.05% |
248 |
23,650 |
| Columbia |
52.06% |
11,995 |
28.01% |
6,454 |
13.42% |
3,091 |
0.69% |
160 |
1.97% |
454 |
1.50% |
346 |
23,040 |
| Cortland |
54.33% |
7,851 |
24.37% |
3,522 |
16.56% |
2,393 |
0.80% |
116 |
1.44% |
208 |
0.80% |
115 |
14,450 |
| Delaware |
58.99% |
9,139 |
18.58% |
2,878 |
14.98% |
2,320 |
0.86% |
134 |
1.42% |
220 |
1.43% |
221 |
15,492 |
| Dutchess |
57.26% |
44,289 |
24.05% |
18,606 |
13.80% |
10,671 |
1.31% |
1,015 |
0.94% |
729 |
0.92% |
715 |
77,348 |
| Erie |
43.18% |
130,377 |
28.27% |
85,360 |
22.75% |
68,702 |
1.59% |
4,791 |
0.61% |
1,831 |
0.96% |
2,905 |
301,929 |
| Essex |
71.84% |
10,550 |
12.22% |
1,794 |
8.06% |
1,183 |
0.70% |
103 |
0.74% |
108 |
1.15% |
169 |
14,686 |
| Franklin |
68.37% |
8,628 |
15.92% |
2,009 |
7.87% |
993 |
0.83% |
105 |
0.68% |
86 |
0.97% |
122 |
12,619 |
| Fulton |
56.09% |
9,012 |
19.01% |
3,055 |
20.54% |
3,301 |
0.91% |
146 |
0.38% |
61 |
1.00% |
160 |
16,067 |
| Genesee |
52.23% |
9,588 |
13.91% |
2,553 |
29.43% |
5,402 |
1.21% |
223 |
0.44% |
81 |
0.82% |
150 |
18,358 |
| Greene |
57.90% |
9,363 |
20.29% |
3,281 |
16.23% |
2,625 |
1.15% |
186 |
0.80% |
129 |
1.34% |
216 |
16,170 |
| Hamilton |
59.86% |
1,740 |
18.92% |
550 |
16.62% |
483 |
1.10% |
32 |
0.28% |
8 |
1.24% |
36 |
2,907 |
| Herkimer |
59.86% |
11,834 |
15.80% |
3,178 |
20.58% |
4,140 |
0.92% |
186 |
0.48% |
97 |
0.96% |
194 |
20,113 |
| Jefferson |
65.18% |
17,616 |
14.42% |
3,897 |
16.33% |
4,414 |
0.66% |
179 |
0.30% |
82 |
0.64% |
172 |
27,027 |
| Kings (Brooklyn) |
34.60% |
141,846 |
56.12% |
230,040 |
4.10% |
16,787 |
0.40% |
1,655 |
1.38% |
5,674 |
0.21% |
875 |
409,909 |
| Lewis |
62.30% |
5,823 |
14.66% |
1,370 |
16.71% |
1,562 |
0.92% |
86 |
0.29% |
27 |
0.88% |
82 |
9,347 |
| Livingston |
43.10% |
8,757 |
17.97% |
3,651 |
34.77% |
7,066 |
0.82% |
167 |
0.69% |
140 |
1.01% |
205 |
20,320 |
| Madison |
51.87% |
10,393 |
20.99% |
4,206 |
22.43% |
4,493 |
1.18% |
236 |
0.82% |
164 |
0.95% |
191 |
20,035 |
| Monroe |
34.27% |
81,110 |
24.65% |
58,334 |
37.17% |
87,967 |
0.77% |
1,820 |
0.81% |
1,929 |
0.86% |
2,039 |
236,691 |
| Montgomery |
52.64% |
9,285 |
18.97% |
3,346 |
20.26% |
3,573 |
0.87% |
153 |
0.37% |
65 |
1.04% |
183 |
17,640 |
| Nassau |
60.56% |
232,785 |
25.98% |
99,865 |
9.33% |
35,860 |
1.45% |
5,574 |
0.37% |
1,572 |
0.74% |
2,855 |
384,408 |
| New York (Manhattan) |
32.53% |
117,863 |
55.78% |
202,101 |
5.45% |
19,743 |
0.25% |
916 |
2.05% |
7,415 |
1.40% |
5,054 |
362,277 |
| Niagara |
47.65% |
32,005 |
19.30% |
12,966 |
27.21% |
18,278 |
1.36% |
916 |
0.31% |
210 |
0.96% |
648 |
67,165 |
| Oneida |
56.14% |
40,186 |
19.17% |
13,719 |
19.94% |
14,274 |
1.31% |
940 |
0.35% |
251 |
0.93% |
668 |
71,580 |
| Onondaga |
50.47% |
74,694 |
26.43% |
39,110 |
18.56% |
27,459 |
0.92% |
1,366 |
0.84% |
1,239 |
0.97% |
1,437 |
147,986 |
| Ontario |
45.38% |
15,480 |
16.16% |
5,512 |
33.65% |
11,478 |
0.72% |
247 |
0.87% |
297 |
1.01% |
343 |
34,111 |
| Orange |
61.22% |
53,950 |
20.27% |
17,866 |
13.52% |
11,914 |
1.42% |
1,251 |
0.79% |
695 |
0.81% |
715 |
88,121 |
| Orleans |
48.15% |
5,426 |
13.92% |
1,568 |
34.34% |
3,869 |
0.88% |
99 |
0.41% |
46 |
0.75% |
84 |
11,268 |
| Oswego |
52.97% |
17,393 |
20.79% |
6,826 |
21.66% |
7,111 |
0.86% |
284 |
0.45% |
147 |
0.99% |
325 |
32,836 |
| Otsego |
54.40% |
9,846 |
22.70% |
4,109 |
15.60% |
2,824 |
0.97% |
175 |
1.95% |
353 |
1.75% |
316 |
18,099 |
| Putnam |
69.50% |
19,998 |
14.79% |
4,284 |
11.11% |
3,217 |
1.24% |
359 |
0.83% |
240 |
1.09% |
317 |
28,961 |
| Queens |
43.74% |
155,599 |
45.18% |
160,746 |
6.06% |
21,556 |
0.90% |
3,219 |
0.68% |
2,402 |
0.62% |
2,196 |
355,756 |
| Rensselaer |
48.91% |
27,120 |
27.94% |
15,491 |
17.87% |
9,908 |
1.08% |
601 |
0.92% |
512 |
1.14% |
631 |
55,447 |
| Richmond (Staten Island) |
67.06% |
59,656 |
20.50% |
18,239 |
8.52% |
7,583 |
0.81% |
722 |
0.46% |
409 |
0.66% |
586 |
88,958 |
| Rockland |
61.26% |
53,025 |
25.48% |
22,054 |
8.73% |
7,557 |
0.75% |
649 |
0.68% |
589 |
0.87% |
750 |
86,551 |
| St. Lawrence |
62.64% |
19,365 |
19.89% |
6,234 |
11.55% |
3,621 |
0.53% |
166 |
0.46% |
145 |
0.95% |
297 |
31,348 |
| Saratoga |
54.21% |
38,797 |
23.59% |
16,881 |
17.39% |
12,448 |
0.92% |
659 |
1.03% |
735 |
1.13% |
811 |
71,567 |
| Schenectady |
46.96% |
24,201 |
27.90% |
14,378 |
19.63% |
10,116 |
1.06% |
546 |
0.80% |
410 |
1.02% |
527 |
51,537 |
| Schoharie |
53.11% |
5,731 |
21.28% |
2,296 |
19.84% |
2,141 |
1.12% |
121 |
1.01% |
109 |
1.38% |
149 |
10,791 |
| Schuyler |
58.93% |
3,535 |
17.39% |
1,043 |
16.49% |
989 |
0.95% |
57 |
2.02% |
121 |
0.95% |
57 |
5,999 |
| Seneca |
55.65% |
5,969 |
18.52% |
1,986 |
21.16% |
2,270 |
0.74% |
79 |
0.76% |
81 |
1.22% |
131 |
10,726 |
| Steuben |
62.26% |
17,523 |
12.15% |
3,419 |
20.33% |
5,721 |
1.03% |
290 |
0.82% |
232 |
0.81% |
229 |
28,147 |
| Suffolk |
57.79% |
209,361 |
22.85% |
82,776 |
14.16% |
51,288 |
1.54% |
5,589 |
0.55% |
1,978 |
0.89% |
3,216 |
362,280 |
| Sullivan |
54.89% |
11,279 |
24.09% |
4,949 |
15.25% |
3,133 |
1.10% |
226 |
0.83% |
170 |
1.17% |
240 |
20,548 |
| Tioga |
59.54% |
9,561 |
14.92% |
2,396 |
21.54% |
3,459 |
0.82% |
131 |
1.07% |
172 |
0.78% |
125 |
16,059 |
| Tompkins |
39.00% |
10,995 |
38.62% |
10,887 |
11.84% |
3,338 |
0.53% |
150 |
5.03% |
1,418 |
2.13% |
601 |
28,192 |
| Ulster |
50.88% |
29,801 |
26.58% |
15,567 |
15.72% |
9,205 |
0.87% |
511 |
2.25% |
1,318 |
1.79% |
1,046 |
58,572 |
| Warren |
56.75% |
11,964 |
22.91% |
4,831 |
15.09% |
3,182 |
0.89% |
188 |
0.68% |
143 |
1.08% |
227 |
21,083 |
| Washington |
55.23% |
9,491 |
21.92% |
3,767 |
17.53% |
3,012 |
0.93% |
160 |
0.88% |
152 |
1.26% |
217 |
17,183 |
| Wayne |
45.00% |
12,553 |
14.95% |
4,171 |
36.45% |
10,169 |
0.89% |
248 |
0.54% |
152 |
0.87% |
242 |
27,898 |
| Westchester |
54.37% |
140,329 |
31.81% |
82,099 |
8.95% |
23,113 |
0.85% |
2,200 |
0.77% |
1,982 |
1.05% |
2,715 |
258,104 |
| Wyoming |
53.57% |
6,931 |
15.72% |
2,034 |
25.50% |
3,299 |
1.84% |
238 |
0.32% |
41 |
0.87% |
112 |
12,938 |
| Yates |
52.26% |
3,781 |
18.23% |
1,319 |
24.44% |
1,768 |
1.04% |
75 |
1.06% |
77 |
1.16% |
84 |
7,235 |
|
| Totals | 49.40% | 2,262,255 | 33.50% | 1,534,064 | 14.28% | 654,016 | 0.97% | 44,195 | 0.91% | 41,797 | 0.93% | 42,751 | 4,579,078 |
See also
References
External links
|
|---|
|
U.S.
Senate | |
|---|
|
U.S.
House | |
|---|
|
State
governors | |
|---|
|
States
generally |
- Alabama
- Alaska
- Arizona
- Arkansas
- California
- Colorado
- Connecticut
- Delaware
- Florida
- Georgia
- Hawaii
- Idaho
- Illinois
- Indiana
- Iowa
- Kansas
- Kentucky
- Louisiana
- Maine
- Maryland
- Massachusetts
- Michigan
- Minnesota
- Mississippi
- Missouri
- Montana
- Nebraska
- Nevada
- New Hampshire
- New Jersey
- New Mexico
- New York
- North Carolina
- North Dakota
- Ohio
- Oklahoma
- Oregon
- Pennsylvania
- Rhode Island
- South Carolina
- South Dakota
- Tennessee
- Texas
- Utah
- Vermont
- Virginia
- Washington
- West Virginia
- Wisconsin
- Wyoming
|
|---|
|
|---|
|
| Presidential (since 1832) | |
|---|
|
| Senatorial (since 1990) | |
|---|
|
| Gubernatorial (since 1990) | |
|---|
|
|