Poverty in India
Poverty in India is an important issue within the nation. With one of the fastest growing economies in the world, clocked at a growth rate of 7.6% in 2015,and a consumer economy. According to Deutsche Bank Research the estimates are nearly 300 million people in the Middle Class.[1] If current trends continue, India's share of world GDP will significantly increase from 7.3% in 2016 to 8.5% by 2020.[2] In 2011, less than 22 percent of Indians lived under the global poverty line, nearly a 10 percent reduction from 29.8 percent just two years prior in 2009.[3]
The World Bank has similarly revised its definition and benchmarks to measure poverty since 1990, with $2 per day income on purchasing power parity basis as the definition in use from 2005 to 2013.[4] Some semi-economic and non-economic indices have also been proposed to measure poverty in India; for example, the Multi-dimensional Poverty Index placed 33% weight on number of years spent in school and education and 6.25% weight on financial condition of a person, in order to determine if that person is poor.[5]
The different definitions and different underlying small sample surveys used to determine poverty in India, have resulted in widely different estimates of poverty from 1950s to 2010s. In 2012, the Indian government stated 22% of its population is below its official poverty limit.[6] The World Bank, in 2011 based on 2005's PPPs International Comparison Program,[7] estimated 23.6% of Indian population, or about 276 million people, lived below $1.25 per day on purchasing power parity.[8][9] According to United Nation's Millennium Development Goal (MDG) programme 270 millions or 21.9% people out of 1.2 billion of Indians lived below poverty line of $1.25 in 2011-2012.[10]
Poverty in India is a historical reality. From late 19th century through early 20th century, under British colonial rule, poverty in India intensified, peaking in 1920s.[11][12] Famines and diseases killed millions each time.[13][14] After India gained its independence in 1947, mass deaths from famines were prevented. Rapid economic growth since 1991, has led to sharp reductions in extreme poverty in India.[15][16] However, those above poverty line live a fragile economic life.[17]
The World Bank reviewed and proposed revisions in May 2014, to its poverty calculation methodology and purchasing power parity basis for measuring poverty worldwide, including India. According to this revised methodology, the world had 872.3 million people below the new poverty line, of which 179.6 million people lived in India. In other words, India with 17.5% of total world's population, had 20.6% share of world's poorest in 2011.[9][18] As of 2014, 58% of the total population were living on less than $3.10 per day .[19] According to the Modified Mixed Reference Period (MMRP) concept proposed by World Bank in 2015, India's poverty rate for period 2011-12 stood at 12.4% of the total population, or about 172 million people; taking the revised poverty line as $1.90.[20][21][22]
The Asian Development Bank estimates India’s population to be at 1.28 billion with an average growth rate, from 2010-2015, at 1.3%. In 2014, 49.9% of the population aged 15 years and above were employed. However, there are still 21.9% of the population who live below the national poverty line.[23]
According to Global Wealth Report 2016 [24] compiled by Credit Suisse Research Institute, India is the second most unequal country in the world with the top one per cent of the population owning nearly 60% of the total wealth. [25]
Definition of poverty

- Economic measures
There are several definitions of poverty, and scholars disagree as to which definition is appropriate for India.[26][27] Inside India, both income-based poverty definition and consumption-based poverty statistics are in use.[28] Outside India, the World Bank and institutions of the United Nations use a broader definition to compare poverty among nations, including India, based on purchasing power parity (PPP), as well as nominal relative basis.[29][30] Each state in India has its own poverty threshold to determine how many people are below its poverty line and to reflect regional economic conditions. These differences in definition yield a complex and conflicting picture about poverty in India, both internally and when compared to other developing countries of the world.[18]
As with many countries,[31] poverty was historically defined and estimated in India using a sustenance food standard. This methodology has been revised. India's current official poverty rates are based on its Planning Commission’s data derived from so-called Tendulkar methodology.[32] It defines poverty not in terms of annual income, but in terms of consumption or spending per individual over a certain period for a basket of essential goods. Further, this methodology sets different poverty lines for rural and urban areas. Since 2007, India set its official threshold at ₹ 26 a day ($0.43) in rural areas and about ₹ 32 per day ($0.53) in urban areas.[33] While these numbers are lower than the World Bank's $1.25 per day income-based definition, the definition is similar to China's US$0.65 per day official poverty line in 2008.[34]
The World Bank’s international poverty line definition is based on purchasing power parity basis, at $1.25 per day.[35][36] This definition is inspired by the reality that the price of same goods, and services such as a haircut, are quite different in local currencies around the world. A realistic definition and comparison of poverty must consider these differences in costs of living, or must be on purchasing power parity (PPP) basis. On this basis, currency fluctuations and nominal numbers become less important, the definition is based on the local costs of a basket of essential goods and services that people can purchase. By World Bank's 2014 PPP definition, India's poverty rate is significantly lower than previously believed.[18]
- Mixed, semi-economic and non-economic measures
As with economic measures, there are many mixed or non-economic measures of poverty and experts contest which one is most appropriate for India. For example, Dandekar and Rath in 1971 suggested a measure of poverty rate that was based on number of calories consumed.[37] In 2011, Alkire et al. suggested a poverty rate measure so-called Multi-dimensional Poverty Index (MPI), which put only 6.25% weight to assets owned by a person and placed 33% weight on education and number of years spent in school.[5] These non-economic measures remain controversial and contested as a measure of poverty rate of any nation, including India.[38][39]
| Country | Poverty line (per day) |
Year | Reference |
|---|---|---|---|
| |
50 rupees ($0.76) | 2007 | [33] |
| |
6 pesos ($0.74) | 2012 | [40] |
| |
6.3 yuan ($1) | 2011 | [41] |
| |
65 naira ($0.4) | 2011 | [42] |
| |
$13[43] | 2005 | [44][45] |
- Comparison with alternate international definitions
India determines household poverty line by summing up the individual per capita poverty lines of the household members. This practice is similar to many developing countries, but different from developed countries such as the United States that adjust poverty line on an incremental basis per additional household member. For example, in the United States, the poverty line for a household with just one member was set at $11,670 per year for 2014, while it was set at $23,850 per year for a 4-member household (or $5963 per person for the larger household).[45] The rationale for the differences arise from the economic realities of each country. In India, households may include surviving grandparents, parents and children. They typically do not incur any or significant rent expenses every month particularly in rural India, unlike housing in mostly urban developed economies. The cost of food and other essentials are shared within the household by its members in both cases. However, a larger portion of a monthly expenditure goes to food in poor households in developing countries,[46] while housing, conveyance and other essentials cost significantly more in developed economies.
For its current poverty rate measurements, India calculates two benchmarks. The first includes a basket of goods including food items but does not include the implied value of home, value of any means of conveyance or the economic value of other essentials created, grown or used without a financial transaction, by the members of a household. The second poverty line benchmark adds rent value of residence as well as the cost of conveyance, but nothing else, to the first benchmark.[47] This practice is similar to those used in developed countries for non-cash income equivalents and poverty line basis.[48][49]
India's official poverty line, in 2014, was ₹972 (US$14) a month in rural areas or ₹1,407 (US$21) a month in cities.[50] India's nationwide average poverty line differs from each state's poverty line. For example, in 2011-2012, Puducherry had its highest poverty line of ₹1,301 (US$19) a month in rural and ₹1,309 (US$19) a month in urban areas, while Odisha had the lowest poverty thresholds of ₹695 (US$10) a month for rural and ₹861 (US$13) a month for its urban areas.[51]
Poverty prevalence and estimates
Before Independence
The 19th century and early 20th century saw increasing poverty in India during the colonial era.[11][52] Over this period, the colonial government de-industrialized India by reducing garments and other finished products manufacturing by artisans in India, importing these from Britain's expanding industry with 19th century industrial innovations, while simultaneously encouraging conversion of more land into farms, and of agricultural exports from India.[53][54] Eastern regions of India along the Ganges river plains, such as those now known as eastern Uttar Pradesh, Bihar, Jharkhand and West Bengal,[55] were dedicated to producing poppy and opium, which were then exported to southeast and east Asia particularly China, with the trade an exclusive monopoly first of East India Company, and later the colonial British institutions.[56] The economic importance of this shift from industry to agriculture in India was large;[57] by 1850, it created nearly 1,000 square kilometres of poppy farms in India in its fertile Ganges plains, led to two opium wars in Asia, with the second opium war fought between 1856 and 1860. After China accepted opium trade, the colonial government dedicated more land exclusively to poppy,[54] the opium agriculture in India rose from 1850 through 1900, when over 500,000 acres of the most fertile Ganges basin farms were devoted to poppy cultivation,[58] opium processing factories owned by colonial officials were expanded in Benares and Patna, and shipping expanded from Bengal to the ports of East Asia such as Hong Kong, all under exclusive monopoly of the British. By early 20th century, 3 out of 4 Indians were employed in agriculture, famines were common, and food consumption per capita declined in every decade.[12] In London, the late 19th century British parliament debated the repeated incidence of famines in India, and the impoverishment of Indians due to this diversion of agriculture land from growing food staples to growing poppy for opium export under orders of the colonial British empire.[54][58]

These colonial policies moved unemployed artisans into farming, and transformed India as a region increasingly abundant in land, unskilled labour and low productivity, and scarce in skilled labour, capital and knowledge.[11][12] On an inflation adjusted 1973 Rupee basis, the average income of Indian agrarian labourer was Rs. 7.20 per year in 1885, against an inflation adjusted poverty line of Rs. 23.90 per year. Thus, not only was the average income below poverty line, the intensity of poverty was severe. The intensity of poverty increased from 1885 to 1921, then began a reversal. However, the absolute poverty rates continued to be very high through the 1930s.[11][60] The colonial policies on taxation and its recognition of land ownership claims of zamindars and mansabdars, or Mughal era nobility, made a minority of families wealthy, while it weakened the ability of poorer peasants to command land and credit. The resulting rising landlessness and stagnant real wages intensified poverty.[11][61]
The National Planning Committee of 1936 noted the appalling poverty of undivided India.[62]
(...) there was lack of food, of clothing, of housing and of every other essential requirement of human existence... the development policy objective should be to get rid of the appalling poverty of the people.— Nehru, The Discovery of India, (1946)
The National Planning Committee, notes Suryanarayana, then defined goals in 1936 to alleviate poverty by setting targets in terms of nutrition (2400 to 2800 calories per adult worker), clothing (30 yards per capita per annum) and housing (100 sq. ft per capita).[62] This method of linking poverty as a function of nutrition, clothing and housing continued in India after it became independent from British colonial empire.
These poverty alleviation goals were theoretical, with administrative powers resident in the British Empire. Poverty ravaged India. In 1943, for example, despite rising agricultural output in undivided South Asia, the Bengal famine killed millions of Indians from starvation, disease and destitution. Destitution was so intense in Bengal, Bihar, eastern Uttar Pradesh, Jharkhand and Orissa, that entire families and villages were "wiped out" of existence. Village artisans, along with sustenance farming families, died from lack of food, malnutrition and a wave of diseases.[14] The 1943 famine was not an isolated tragedy. Devastating famines impoverished India every 5 to 8 years in late 19th century and the first half of 20th century. Between 6.1 and 10.3 million people starved to death in British India during the 1876-1879 famine, while another 6.1 to 8.4 million people died during 1896-1898 famine.[63] The Lancet reported 19 million died from starvation and consequences of extreme poverty in British India, between 1896 and 1900.[64] Sir MacDonnell observed the suffering and poverty in 1900, and noted, "people died like flies" in Bombay.[65]
After Independence
1950s
| Year[66] | Total Population (millions) |
50% lived on (₹ / year) |
95% lived on (₹ / year) |
|---|---|---|---|
| 1956-57 | 359 | 180 | 443 |
| 1961-62 | 445 | 204 | 498 |
| 1967-68 | 514 | 222 | 512 |
Minhas published his estimates of poverty rates in 1950s India as cyclical and a strong function of each year's harvest. Minhas disagreed with the practice of using calories as the basis for poverty estimation and proposed a poverty line based on real expenditure per year (Rs 240 per annum). In 1956-57, a good harvest year, he computed India's poverty rate to be 65% (215 million people).[66][67] For 1960, Minhas estimated the poverty to be 59%.[68]
1960s
A Working Group was formed in 1962 to attempt to set a poverty line for India.[69][70] This Working Group used calories required for survival, and income needed to buy those calories in different parts of rural India, to derive an average poverty line of Rs. 20 per month at 1960-61 prices.[71]
Estimates of poverty in India during the 1960s varied widely. Dandekar and Rath, on the behalf of then Indian government, estimated that the poverty rate in 1960s remained generally constant at 41%. Ojha, in contrast, estimated that there were 190 million people (44%) in India below official poverty limit in 1961, and that this below-poverty line number increased to 289 million people (70%) in 1967. Bardhan also concluded that Indian poverty rates increased through the 1960s, reaching a high of 54%.[68][72] Those above the 1960s poverty level of Rs 240 per year, were in fragile economic groups as well and not doing well either. Minhas estimated that 95% of India's people lived on Rs 458 per year in 1963-64, while the richest 5% lived on an average of Rs 645 per year (all numbers inflation adjusted to 1960-61 Rupee).[66]
1970s - 1980s
Dandekar and Rath[73] in 1971 used a daily intake of 2,250 calories per person to define the poverty line for India. Using NSSO data regarding household expenditures for 1960–61, they determined that in order to achieve this food intake and other daily necessities, a rural dweller required an annual income of ₹ 170.80 per year (₹ 14.20 per month, adjusted to 1971 Rupee). An urban dweller required ₹ 271.70 per year (₹ 22.60 per month). They concluded from this study that 40 percent of rural residents and 50 percent of urban residents were below the poverty line in 1960–61.[74]
Poverty alleviation has been a driver for India's Planning Commission's Task Force on Projections of Minimum Needs and Effective Consumption Demand of the Perspective Planning Division. This division, in 1979, took into account differences in calorie requirements for different age groups, activity levels, and sex. They determined that the average rural dweller needed around 2400 calories, and those in urban areas required about 2100 calories per person per day. To satisfy the food requirement, the Task Force estimated that a consumer spending in 1973–74 of Rs.49.09 per person per month in rural areas and Rs.56.64 in urban areas was appropriate measure to estimate its poverty line.[75]
Poverty remained stubbornly high in India through the 1970s and 1980s. It created slogans such as Garibi Hatao (literally, abolish poverty) for political campaigns, during elections in early 1970s through the 1980s.[76] Rural poverty rate exceeded 50%, using India's official poverty line for 1970s.[77][78]
1990s
Another Expert Group was instituted in 1993, chaired by Lakdawala, to examine poverty line for India. It recommended that regional economic differences are large enough that poverty lines should be calculated for each state. From then on, a standard list of commodities were drawn up and priced in each state of the nation, using 1973–74 as a base year. This basket of goods could then be re-priced each year and comparisons made between regions. The Government of India began using a modified version of this method of calculating the poverty line in India.[79]
There are wide variations in India's poverty estimates for 1990s, in part from differences in the methodology and in the small sample surveys they poll for the underlying data. A 2007 report for example, using data for late 1990s, stated that 77% of Indians lived on less than ₹ 20 a day (about US$0.50 per day).[80] In contrast, Datt estimated India's national poverty rate to be 35% in 1994, at India's then official poverty line of Rs 49 per capita, with consumer price index adjusted to June 1974 rural prices.[78]
2000s
Saxena Committee report, using data over 1972 to 2000, separated calorific intake apart from nominal income in its economic analysis of poverty in India, and then stated that 50% of Indians lived below the poverty line.[81] The Planning Commission of India, in contrast, determined that the poverty rate was 39%.
The National Council of Applied Economic Research estimated that 48% of the Indian households earn more than ₹90,000 (US$1,337.40) annually (or more than US$ 3 PPP per person). According to NCAER, in 2009, of the 222 million households in India, the absolutely poor households (annual incomes below ₹45,000 (US$670) accounted for only 15.6% of them or about 35 million (about 200 million Indians). Another 80 million households are in income levels of ₹45,000 (US$670) to ₹90,000 (US$1,300) per year. These numbers are similar to World Bank estimates of the "below-the-poverty-line" households that may total about 100 million (or about 456 million individuals).[82]
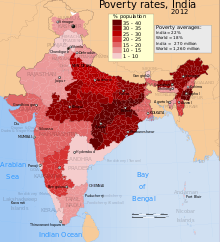
Reserve Bank of India (2015)
In their annual report of 2012, Reserve Bank of India names the state of Goa as having the least poverty of 5.09% while national average stands at 21.92%[6] The table below presents the poverty statistics for rural, urban and combined, percent below poverty line (BPL) for each State or Union Territory.[6] The highest poverty statistic for each category column, is coloured light red in the table below.
| State or Union Territory | No. of Persons (Thousands) Rural |
% of Persons (Rural) below poverty line |
Poverty line (Rs)/month (Rural) | No. of Persons (Thousands) Urban |
% of Persons (Urban) below poverty line |
Poverty line (Rs) (Urban) | No. of Persons (Thousands) Combined |
% of Persons (Combined) below poverty line |
|---|---|---|---|---|---|---|---|---|
| Andhra Pradesh | 6180 | 10.96 | 860.00 | 1698 | 5.81 | 1009.00 | 7878 | 9.20 |
| Arunachal Pradesh | 425 | 38.93 | 930.00 | 66 | 20.33 | 1060.00 | 491 | 34.67 |
| Assam | 9206 | 33.89 | 828.00 | 921 | 20.49 | 1008.00 | 10127 | 31.98 |
| Bihar | 32040 | 34.06 | 778.00 | 3775 | 31.23 | 923.00 | 35815 | 33.74 |
| Chhattisgarh | 8890 | 44.61 | 738.00 | 1522 | 24.75 | 849.00 | 10411 | 39.93 |
| Goa | 37 | 6.81 | 1090.00 | 38 | 4.09 | 1134.00 | 75 | 5.09 |
| Gujarat | 7535 | 21.50 | 932.00 | 2688 | 10.14 | 1152.00 | 10223 | 16.63 |
| Haryana | 1942 | 11.64 | 1015.00 | 941 | 10.28 | 1169.00 | 2883 | 11.16 |
| Himachal Pradesh | 529 | 8.48 | 913.00 | 30 | 4.33 | 1064.00 | 559 | 8.06 |
| Jammu & Kashmir | 1073 | 11.54 | 891.00 | 253 | 7.20 | 988.00 | 1327 | 10.35 |
| Jharkhand | 10409 | 40.84 | 748.00 | 2024 | 24.83 | 974.00 | 12433 | 36.96 |
| Karnataka | 9280 | 24.53 | 902.00 | 3696 | 15.25 | 1089.00 | 12976 | 20.91 |
| Kerala | 1548 | 9.14 | 1018.00 | 846 | 4.97 | 987.00 | 2395 | 7.05 |
| Madhya Pradesh | 19095 | 35.74 | 771.00 | 4310 | 21.00 | 897.00 | 23406 | 31.65 |
| Maharashtra | 15056 | 24.22 | 967.00 | 4736 | 9.12 | 1126.00 | 19792 | 17.35 |
| Manipur | 745 | 38.80 | 1118.00 | 278 | 32.59 | 1170.00 | 1022 | 36.89 |
| Meghalaya | 304 | 12.53 | 888.00 | 57 | 9.26 | 1154.00 | 361 | 11.87 |
| Mizoram | 191 | 35.43 | 1066.00 | 37 | 6.36 | 1155.00 | 227 | 20.40 |
| Nagaland | 276 | 19.93 | 1270.00 | 100 | 16.48 | 1302.00 | 376 | 18.88 |
| Odisha | 12614 | 35.69 | 695.00 | 1239 | 17.29 | 861.00 | 13853 | 32.59 |
| Punjab | 1335 | 7.66 | 1054.00 | 982 | 9.24 | 1155.00 | 2318 | 8.26 |
| Rajasthan | 8419 | 16.05 | 905.00 | 1873 | 10.69 | 1002.00 | 10292 | 14.72 |
| Sikkim | 45 | 9.85 | 930.00 | 6 | 3.66 | 1226.00 | 51 | 8.19 |
| Tamil Nadu | 5923 | 15.83 | 880.00 | 2340 | 6.54 | 937.00 | 8263 | 11.28 |
| Tripura | 449 | 16.53 | 798.00 | 75 | 7.42 | 920.00 | 524 | 14.05 |
| Uttar Pradesh | 47935 | 30.40 | 768.00 | 11884 | 26.06 | 941.00 | 59819 | 29.43 |
| Uttarakhand | 825 | 11.62 | 880.00 | 335 | 10.48 | 1082.00 | 1160 | 11.26 |
| West Bengal | 14114 | 22.52 | 783.00 | 4383 | 14.66 | 981.00 | 18498 | 19.98 |
| Andaman & Nicobar Islands | 4 | 1.57 | - | 0 | 0.00 | - | 4 | 1.00 |
| Chandigarh | 0 | 1.64 | - | 234 | 22.31 | - | 235 | 21.81 |
| Dadra & Nagar Haveli | 115 | 62.59 | - | 28 | 15.38 | - | 143 | 39.31 |
| Daman and Diu | 0 | 0.00 | - | 26 | 12.62 | - | 26 | 9.86 |
| Delhi | 50 | 12.92 | 1145.00 | 1646 | 9.84 | 1134.00 | 1696 | 9.91 |
| Lakshadweep | 0 | 0.00 | - | 2 | 3.44 | - | 2 | 2.77 |
| Puducherry | 69 | 17.06 | 1301.00 | 55 | 6.30 | 1309.00 | 124 | 9.69 |
| All India | 216658 | 25.70 | 816.00 | 53125 | 13.70 | 1000.00 | 269783 | 21.92 |
2010s
The World Bank has reviewed its poverty definition and calculation methodologies several times over the last 25 years. In early 1990s, The World Bank anchored absolute poverty line as $1 per day. This was revised in 1993, and the absolute poverty line was set at $1.08 a day for all countries on a purchasing power parity (PPP)basis, after adjusting for inflation to the 1993 US dollar. In 2005, after extensive studies of cost of living across the world, The World Bank raised the measure for global poverty line to reflect the observed higher cost of living.[4] Thereafter, the World Bank determined poverty rates from those living on less than US$1.25 per day on 2005 PPP basis, a measure that has been widely used in media and scholarly circles.
In May 2014, after revisiting its poverty definition, methodology and economic changes around the world, the World Bank proposed another major revision to PPP calculation methodology, international poverty line and indexing it to 2011 US dollar.[18] The new method proposes setting poverty line at $1.78 per day on 2011 PPP basis. According to this revised World Bank methodology, India had 179.6 million people below the new poverty line, China had 137.6 million, and the world had 872.3 million people below the new poverty line on an equivalent basis as of 2013. India, in other words, while having 17.5% of total world's population, had 20.6% share of world's poor.[9][18]In October 2015, the World Bank updated the international poverty line to US$1.90 a day.
Semi-economic measures of poverty
Other measures such as the semi-economic Multi-dimensional Poverty Index (MPI), which places 33% weight on education and number of schooling years in its definition of poverty, and places 6.25% weight on income and assets owned, suggests there were 650 million people (53.7% of population) living in MPI-poverty in India.[5] 421 million of MPI-defined poor are concentrated in eight North Indian and East Indian states of Bihar, Chhattisgarh, Jharkhand, Madhya Pradesh, Orissa, Rajasthan, Uttar Pradesh and West Bengal. The table below presents this semi-economic poverty among the states of India based on the Multi-dimensional Poverty Index, using a small sample survey data for Indian states in 2005.[83]
| MPI rank | States | Population (in millions) 2007 | MPI | Proportion of MPI-poor | Average intensity | Contribution to overall MPI-poverty | Number of MPI poor (in millions) |
|---|---|---|---|---|---|---|---|
| — | India | 1,164.7 | 0.296 | 55.4% | 53.5% | – | 645.0 |
| 1 | Kerala | 35.0 | 0.065 | 15.9% | 40.9% | 0.6% | 5.6 |
| 2 | Goa | 1.6 | 0.094 | 21.7% | 43.4% | 0.0% | 0.4 |
| 3 | Punjab | 27.1 | 0.120 | 26.2% | 46.0% | 1.0% | 7.1 |
| 4 | Himachal Pradesh | 6.7 | 0.131 | 31.0% | 42.3% | 0.3% | 2.1 |
| 5 | Tamil Nadu | 68.0 | 0.141 | 32.4% | 43.6% | 2.6% | 22.0 |
| 6 | Uttarakhand | 9.6 | 0.189 | 40.3% | 46.9% | 0.5% | 3.9 |
| 7 | Maharashtra | 108.7 | 0.193 | 40.1% | 48.1% | 6.0% | 43.6 |
| 8 | Haryana | 24.1 | 0.199 | 41.6% | 47.9% | 1.3% | 10.0 |
| 9 | Gujarat | 98.3 | 0.205 | 21.5% | 49.2% | 0.4% | 0.8 |
| 10 | Jammu and Kashmir | 12.2 | 0.209 | 43.8% | 47.7% | 0.7% | 5.4 |
| 11 | Andhra Pradesh | 83.9 | 0.211 | 44.7% | 47.1% | 5.1% | 37.5 |
| 12 | Karnataka | 58.6 | 0.223 | 46.1% | 48.3% | 4.2% | 27.0 |
| 13 | Northeast Indian States | 44.2 | 0.303 | 57.6% | 52.5% | 4.0% | 25.5 |
| 14 | West Bengal | 89.5 | 0.317 | 58.3% | 54.3% | 8.5% | 52.2 |
| 15 | Orissa | 40.7 | 0.345 | 64.0% | 54.0% | 4.3% | 26.0 |
| 16 | Rajasthan | 65.4 | 0.351 | 64.2% | 54.7% | 7.0% | 41.9 |
| 17 | Uttar Pradesh | 192.6 | 0.386 | 69.9% | 55.2% | 21.3% | 134.7 |
| 18 | Chhattisgarh | 23.9 | 0.387 | 71.9% | 53.9% | 2.9% | 17.2 |
| 19 | Madhya Pradesh | 70.0 | 0.389 | 69.5% | 56.0% | 8.5% | 48.6 |
| 20 | Jharkhand | 30.5 | 0.463 | 77.0% | 60.2% | 4.2% | 23.5 |
| 21 | Bihar | 95.0 | 0.499 | 81.4% | 61.3% | 13.5% | 77.3 |
Other estimates

According to a 2011 poverty Development Goals Report, as many as 320 million people in India and China are expected to come out of extreme poverty in the next four years, with India's poverty rate projected to drop from 51% in 1990 to about 22% in 2015.[84] The report also indicates that in Southern Asia, only India is on track to cut poverty by half by the 2015 target date.[84] In 2015,according to United Nation's Millennium Development Goal (MGD) programme,India has already achieved the target of reducing poverty by half, with 24.7% of its 1.2 billion people in 2011 living below the poverty line or having income of less than $1.25 a day, the U.N. report said.The same figure was 49.4% in 1994. India had set a target of 23.9% to be achieved by 2015.[85]
- Global Hunger Index
Global Hunger Index (GHI) is an index that places a third of weight on proportion of the population that is estimated to be undernourished, a third on the estimated prevalence of low body weight to height ratio in children younger than five, and remaining third weight on the proportion of children dying before the age of five for any reason. According to 2011 GHI report, India has improved its performance by 22% in 20 years, from 30.4 to 23.7 over 1990 to 2011 period.[86] However, its performance from 2001 to 2011 has shown little progress, with just 3% improvement. A sharp reduction in the percentage of underweight children has helped India improve its hunger record on the Global Hunger Index (GHI) 2014. India now ranks 55 among 76 emerging economies. Between 2005 and 2014, the prevalence of underweight children under the age of five fell from 43.5% to 30.7%.[87]
Poverty: 2011-2012 Percentage of people by Caste[88]
Findings below are based on a survey conducted during 2011-12.
Total population of India 1,276,267,631
| Caste | Percentage | No. of People |
|---|---|---|
| FC | 30.8% | 393M |
| OBC | 41.1% | 524M |
| SC | 19.7% | 251M |
| ST | 8.5% | 108M |
Poverty in India based on caste.[88]
| Caste | Percentage of Poverty | No. of People |
|---|---|---|
| FC | 12.5% | 49.1M |
| OBC | 20.7% | 108.5M |
| SC | 29.4% | 73.8M |
| ST | 43.0% | 46.4M |
Impact of poverty
Since the 1950s, the Indian government and non-governmental organisations have initiated several programs to alleviate poverty, including subsidising food and other necessities, increased access to loans, improving agricultural techniques and price supports, and promoting education and family planning. These measures have helped eliminate famines, cut absolute poverty levels by more than half, and reduced illiteracy and malnutrition.
Although the Indian economy has grown steadily over the last two decades, its growth has been uneven when comparing social groups, economic groups, geographic regions, and rural and urban areas.[89][90] Between 1999 and 2008, the annualised growth rates for Gujarat, Haryana, or Delhi were higher than for Bihar, Uttar Pradesh, or Madhya Pradesh.[91]
Despite significant economic progress, one quarter of the nation's population earns less than the government-specified poverty threshold of ₹32 per day (approximately US$ 0.6).[92]
According to the 2001 census, 35.5% of Indian households used banking services, 35.1% owned a radio or transistor, 31.6% a television, 9.1% a phone, 43.7% a bicycle, 11.7% a scooter, motorcycle or a moped, and 2.5% a car, jeep or van; 34.5% of the households had none of these assets.[93] According to Department of Telecommunications of India the phone density reached 73.34% by December 2012 and as an annual growth decreased by −4.58%.[94] This tallies with the fact that a family of four with an annual income of ₹137,000 (US$2,000) could afford some of these luxury items.
Causes
One cause is a high population growth rate, although demographers generally agree that this is a symptom rather than cause of poverty. While services and industry have grown at double-digit figures, agriculture growth rate has dropped from 4.8% to 2%. About 52% of the population is employed in agriculture whereas the contribution of agriculture to the GDP is about 18%.[95] The surplus of labour in agriculture has caused many people to not have jobs. Farming is strangulated by the government by not allowing economies of scale (Land Ceiling Act) thus not the use of machines and freeing up the labour for industrial production. The purchase of Agriculture land is not financed by banks which restricts enterprise in agriculture.
India's economic policies
In 1947, the average annual income in India was M$619, compared with M$439 for China, M$770 for South Korea, and M$936 for Taiwan (M$[96] being Maddison's estimate of inflation adjusted to 1990 international dollar). About 50 years later, by 1999, the numbers were US$1,818 India; US$3,259 China; US$13,317 South Korea ; and US$15,720 Taiwan, respectively.[96] In other words, the average income in India was not much different from South Korea in 1947, but South Korea became a developed country by the 2000s. For the first 40 years, India followed the Soviet-style economic planning, nationalisation programs and government ownership of industry. Its economic growth averaged about 3.5%, while Asian economies such as South Korea grew on average more than twice that rate annually.[97][98] Adjusted for population growth in India, its per capita income grew at 1.49% annually, while incomes of South Koreans - rich and poor - rose rapidly.
India's Soviet-style economy included License Raj, which refers to the elaborate licenses, regulations and the accompanying red tape that were required to set up and run a business in India between 1947 and 1990.[99][100] The License Raj was a result of India's decision to have a planned economy, where all aspects of the economy are controlled by the state and licenses were given to a select few. Corruption flourished under this system.[101][102] Under this economic system, the country created few jobs and little wealth to systematically and sustainably address widespread poverty.[103]
The labyrinthine bureaucracy often led to absurd restrictions – up to 80 agencies had to be satisfied before a firm could be granted a licence to produce and the state would decide what was produced, how much, at what price and what sources of capital were used.— BBC[104]
India had started out in the 1950s with high growth rates,[105] openness to trade and investment, a promotional state, social expenditure awareness and macro stability but ended the 1980s with low growth rates,[105] closure to trade and investment, a license-obsessed, restrictive state (License Raj), inability to sustain social expenditures and macro instability, and an economic crisis.
Reduction in poverty
The World Bank’s Global Monitoring Report for 2014-15 on the Millennium Development Goals says India has been the biggest contributor to poverty reduction between 2008 and 2011, with around 140 million or so lifted out of absolute poverty.[106] Since the early 1950s, Indian government initiated various schemes to help the poor attain self-sufficiency in food production. These have included ration cards and price controls over the supply of basic commodities, particularly food at controlled prices, available throughout the country. These efforts prevented famines, but did little to eliminate or reduce poverty in rural or urban areas between 1950 and 1980.[107]
One of the main reasons for record decline in Poverty is India's rapid economic growth rate since 1991.[15][16][108] Another reason proposed is India's launch of social welfare programs such as Mahatma Gandhi National Rural Employment Guarantee Act (MGNREGA) and Midday Meal Scheme in Government Schools. Klonner and Oldiges, in a 2012 study, conclude that MGNREGA helps reduce rural poverty gap (intensity of rural poverty), seasonal poverty, but not overall poverty.[109][110]
- Alternate views
The value of economic reforms to poverty reduction has been questioned. Some[111] suggest it has caused a collapse of rural economies and increase in poverty.
Controversy over extent of poverty reduction
The Indian government's definition of poverty in 2009 was questioned by United Nation's World Food Programme. It wondered if 11 kilograms of grains per month per person (24 lbs) is sufficient.[112] The political debate that followed launched India's National Food Security Act, 2013, that guarantees food grains at very low costs to 820 million of the poorest Indians.[113]
Various sources have questioned whether the Indian government should continue defining poverty solely in terms of food or money. For example, the French Ministry of Foreign Affairs linked group CSH asks:
While total overall poverty in India has declined, the extent of poverty reduction is often debated. While there is a consensus that there has not been an increase in poverty between 1993–94 and 2004–05, the picture is not so clear if one considers other non-pecuniary dimensions (such as health, education, crime and access to infrastructure). With the rapid economic growth that India is experiencing, it is likely that a significant fraction of the rural population will continue to migrate toward cities, making the issue of urban poverty more significant in the long run.[114]
Others suggest India should focus on Human Development Index (HDI), a composite statistic of life expectancy, education, and income indices.[115] Yet others recommend Multi-dimensional Poverty Index (MPI).[5]
Persistence of malnutrition among children
UNICEF, using 2005-2006 NFHS-3 sample survey results, has highlighted malnourishment in Indian children below the age of 5, with an estimated 7.4 million babies that were born in the sample year with low birth weights.[116][117] The survey reported 17,656 women (39 percent), out of 45,325, were underweight at the time of delivery, 40 percent of urban children in 6-59 month category were shorter than world standards (stunted), and 33 percent were underweight than expected weight to their height per world standards (undernourished). In rural parts, the observed deviation of expected height and weights from world's ideal height and weight standards was significantly higher. Scheduled Tribe children were observed to be most stunted and undernourished. Malnutrition is prevalent in all the religious groups in India. However, Hindu and Muslim children are about equally likely to be undernourished, whereas, Christian, Sikh, and Jain children are considerably better nourished.[117] The states with higher rates of poverty also had the higher rates of child undernourishment (Bihar, Jharkhand and Madhya Pradesh), except for the northeastern states where Meghalaya had most undernourishment while Manipur relatively less.[117] Rohini Mukherjee, of the Naadi foundation – one of the NGOs that published the report – stated India is "doing worse than sub-Saharan Africa."[118] However, the main cause for this malnourishment is dietary practices, and not economic poverty. To quote the same Rohini Mukherjee "It is very clear that in Africa (malnutrition) is a result of absolute poverty. They are starving... In our case, to me it seems it is about eating and feeding practices... Most children we measured have never been hungry, but what the child is eating is almost all carbohydrate."
A 2005 World Bank report estimated just 5 poorest states of India accounted for 80% of India's child malnutrition cases.[119][120]
- Integrated Childhood Development Service
The Indian government came up with the Integrated Childhood Development Service (ICDS) in 1975 to combat the problem of malnutrition in the country. ICDS is the world's largest child development programme, but its effects on the problem in India are limited.[121] This is because, suggested a 2006 World Bank study, the programme failed to focus on children under 3, the group that should receive the most help from the ICDS; most growth retardation would have developed by the age of 2 and is mostly irreversible.[122] With the lack of help, the chances that newborn babies are unable to develop fully would be higher.
The quality of ICDS centres varies from states to states; with least number of centres present in the most impoverished states with the highest rates of malnutrition.[121] Rajasthan, Uttar Pradesh, Bihar, Orissa and Madhya Pradesh, all rank in the bottom ten in terms of ICDS coverage.[122] Despite the poor distribution of help, the ICDS is still considered to be efficient in improving the health of the children in the country.[123] Statistics from UNICEF show that the mortality rate of children under 5 has improved from 118 per 1000 live births in 1990 to 66 in the year 2009.[124]
Several states have been evaluating different methods of reducing child malnutrition in India's federal system of governance. Madhya Pradesh, claim Dasguta et al.,[125] has made significant progress in facility based management of severe malnutrition. Its model is being adopted by other Indian states to address cases of severe acute malnutrition and severe chronic malnutrition. Similar but limited successes with intervention programs have been reported in Jharkhand.[126][127]
- Child malnutrition and reference population debate
The validity of child malnutrition statistics for India have been questioned.[128] One of the concerns with the method used to determine malnourishment and stunting is the weight and height standards that are benchmarked to a presumed ideal European body; this reference population standard ignores the genetic, environmental and other differences between East Asian, South Asian, African, European, Tribal and various ethnic groups with different child and adult heights and weights. These factors are acknowledged and accepted by United Nation's WHO, but not the survey personnel who discount local factors and ethnic groups while counting malnutrition cases in India. Thus Kerala, one of the more prosperous states of India with 95% literacy, near-developed nations like life expectancy, very low child mortality rate and high Human Development Indices, is counted to have significantly higher child malnutrition rates than sub-Saharan countries reporting very high child mortality rates.[128] Typically, child malnutrition rates, infant mortality and life expectancy at birth are positively correlated. Thus, child malnutrition from poverty in India, as well as for children of wealthier Indians settled abroad, is being debated whether there is a need to improve "reference population" being used to determine who is actually suffering malnutrition and needs attention, and who is getting misclassified.[128][129] A similar debate on malnutrition among children in United States led to a revision of "reference population" standards in 2000, wherein the reference was tailored to various ethnic and other factors.[130]
See also
| Wikimedia Commons has media related to Poverty in India. |
- Economic and socio-economic
- Economy of India
- Income in India
- India State Hunger Index
- Socio-economic issues in India
- Street vendors
- Housing
- Utilities
- Corruption
- Other
References
- ↑ Deutsche Bank Research: The middle class in India
- ↑ "Report for Selected Countries and Subjects".
- ↑ "India - Data".
- 1 2 Martin Ravallion, Shaohua Chen and Prem Sangraula (2008). "Dollar a Day Revisited" (PDF). The World Bank.
- 1 2 3 4 "Country Briefing: India, Multidimensional Poverty Index (MPI) At a Glance" (PDF). Oxford Poverty and Human Development Initiative.
- 1 2 3 "Number and Percentage of Population Below Poverty Line". Reserve Bank of India. 2012. Retrieved 4 April 2014.
- ↑ World Bank’s $1.25/day poverty measure- countering the latest criticisms The World Bank (2010)
- ↑ Note: 24.6% rate is based on 2005 PPP at $1.25 per day, International dollar basis, The World Bank (2015). A measured approach to ending poverty and boosting shared prosperity (PDF). World Bank Group. p. 50. ISBN 978-1-4648-0361-1.
- 1 2 3 Chandy and Kharas, What Do New Price Data Mean for the Goal of Ending Extreme Poverty? Brookings Institution, Washington D.C. (May 2014)
- ↑ "8% GDP growth helped reduce poverty: UN report".
- 1 2 3 4 5 T. Roy, London School of Economics, Globalization, Factor Prices and Poverty in Colonial India, Australian Economic History Review, Vol. 47, No. 1, pp. 73-94 (March 2007)
- 1 2 3 Maddison, A. (1970), The historical origins of Indian poverty, PSL Quarterly Review, 23(92), pp. 31-81
- 1 2 Murton, Brian (2000), "VI.4: Famine", The Cambridge World History of Food 2, Cambridge, New York, pp. 1411–27
- 1 2 A Sen (1983), Poverty and Famines: An Essay on Entitlement and Deprivation, Oxford University Press, ISBN 978-0198284635
- 1 2 Bhagwati & Panagariya (2013), Why Growth Matters: How Economic Growth in India Reduced Poverty and the Lessons for Other Developing Countries, Public Affairs, ISBN 978-1610393737
- 1 2 Swaminathan S. Anklesaria Aiyar, The Elephant That Became a Tiger: 20 Years of Economic Reform in India Cato Institute (20 July 2011)
- ↑ John Burn-Murdoch and Steve Bernard, The Fragile Middle: millions face poverty as emerging economies slow, The Financial Times (13 April 2014)
- 1 2 3 4 5 6 Shawn Donnan, World Bank eyes biggest global poverty line increase in decades The Financial Times (9 May 2014).
- ↑ "Poverty & Equity Data | Home | The World Bank". povertydata.worldbank.org. Retrieved 11 February 2016.
- ↑ Udit Misra (7 October 2015). "Meaning URP, MRP and MMRP". The Indian Express. Retrieved 14 July 2016.
- ↑ "India's poverty rate at 12.4% in 2011-12". Business Standard. 6 October 2015. Retrieved 14 July 2016.
- ↑ "Why India's poverty rate has fallen to 12.4%". Rediff. 6 October 2015. Retrieved 14 July 2016.
- ↑ Asian Development Bank. (n.d.). Poverty in India. Retrieved 21 November 2016 from https://www.adb.org/countries/india/poverty
- ↑ "Global Wealth Report 2016". Credit Suisse Research Institute.
- ↑ "India second most unequal country in the world: Wealth Report". Hindustan Times. 24 November 2016.
- ↑ Erenstein (2011), Livelihood Assets as a Multidimensional Inverse Proxy for Poverty: A District‐level Analysis of the Indian Indo‐Gangetic Plains, Journal of Human Development and Capabilities, 12(2), pp. 283-302
- ↑ How to read India's poverty stats? The Wall Street Journal (2013)
- ↑ Krishna & Shariff (2011), The irrelevance of national strategies? Rural poverty dynamics in states and regions of India, 1993–2005. World Development, 39(4), pp. 533-549
- ↑ Chandy, L., & Gertz, G. (2011), Poverty in numbers: The changing state of global poverty from 2005 to 2015, Brookings Institution
- ↑ THE DEFINITIONS OF POVERTY The World Bank (2009)
- ↑ Gordon Fisher, The Development and the history of poverty thresholds Social Security Bulletin, Vol 55, No 4 (Winter 1992), US Government
- ↑ Panagariya & Mukim (2014), A comprehensive analysis of poverty in India. Asian Development Review, 31(1), pp. 1-52
- 1 2 Not poor if you earn Rs.32 a day: Planning Commission India Today (21 September 2011)
- ↑ Chen and Ravallion, China is Poorer than we Thought, But No Less Successful in the Fight against Poverty Policy Research Working Paper 4621, The World Bank (2008), page 9
- ↑ Chen & Ravallion (2013), More Relatively‐Poor People in a Less Absolutely‐Poor World, Review of Income and Wealth, 59(1), pp. 1-28
- ↑ Alkire & Sumner (2013), Multidimensional Poverty and the Post-2015 MDGs, Development, 56(1), pp. 46-51
- ↑ Paul, S. (1989), A model of constructing the poverty line, Journal of Development Economics, 30(1), pp. 129-144
- ↑ Sumner (2004), Economic Well-being and Non-economic Well-being, A Review of the Meaning and Measurement of Poverty, ISBN ISBN 92-9190-617-4
- ↑ Appleton (2001), ‘The Rich Are Just Like Us, Only Richer’: Poverty Functions or Consumption Functions?, Journal of African Economies, 10(4), pp. 433-469
- ↑ The six pesos diet The Economist (8 September 2012)
- ↑ China issues white paper on poverty reduction China (16 November 2011)
- ↑ Federal Republic of Nigeria - Study for Poverty Profile (Africa) JICA Japan (March 2011)
- ↑ the official poverty line in the United States varies with number of people in a household, $13 per day is per person in a family of four
- ↑ World Bank’s $1.25/day poverty measure- countering the latest criticisms The World Bank, quote - "the official poverty line used in the United States is $13 a day in 2005 (per person, for a family of four)."
- 1 2 2014 Poverty Guidelines US Department of Health and Human Services (2014)
- ↑ Food Security and Poverty in Asia and the Pacific Asian Development Bank (April 2012), ISBN 978-92-9092-666-5, pp. 9-11
- ↑ REPORT OF THE EXPERT GROUP TO REVIEW THE METHODOLOGY FOR ESTIMATION OF POVERTY Govt of India (2009), pp. 11-27
- ↑ Gordon Fisher, The Development and the history of poverty thresholds Social Security Bulletin, Vol 55, No 4 (Winter 1992), US Government, pp. 9
- ↑ Smeeding et al., POVERTY, INEQUALTTY, AND FAMILY LIVING STANDARDS IMPACTS ACROSS SEVEN NATIONS: THE EFFECT OF NONCASH SUBSIDIES FOR HEALTH, EDUCATION AND HOUSING Review of Income and Wealth, Series 39, Number 3. September 1993, pp. 229-256
- ↑ New Poverty Formula Proves Test for India The Wall Street Journal, 27 July 2014
- ↑ Press Note on Poverty Estimates, 2011-12 Government of India, p. 5
- ↑ Sarkar (1983), The colonial economy, In: S. Sarkar (Editor) Modern India: 1885–1947, Macmillan, ISBN 978-0333904251
- ↑ Thorner (1962), ‘Deindustrialization’ in India, 1881–1931, In: D. Thorner, and A. Thorner (Editors), Land and Labour in India, ISBN 978-8180280214
- 1 2 3 Richard Hunt (1997), To End Poverty - The Starvation of the Periphery by the Core, Oxford, UK, ISBN 978-0952887201, pp. 145-148
- ↑ These were variously called or were parts of United Provinces, Northwestern Provinces, Oudh, Behar, Bengal and Rewa in 19th century South Asia
- ↑ Kranton and Swamy, Contracts, Hold-Up, and Exports: Textiles and Opium in Colonial India, American Economic Review, 98(3): 967-989
- ↑ Allen (1853), The opium trade: a sketch of its history, extent, effects as carried on in India and China at Google Books, J.P. Walker
- 1 2 The Parliamentary Debates, Volume 348, p. 1058, at Google Books, Hansard's, HM Government, Great Britain (14 August 1890), pp. 1054-1061
- ↑ Singh (2002), Population And Poverty, Mittal, ISBN 978-81-7099-848-8
- ↑ Reddy (1986), Trends in agricultural wages in some south Indian districts: 1800–1980, Indian Journal of Labour Economics, 28, pp. 307–349
- ↑ Raychaudhuri (1982), Non-agricultural production: Mughal India, In: T. Raychaudhuri, and I. Habib, (Editors), The Cambridge Economic History of India, Cambridge University Press
- 1 2 M.H. Suryanarayana. "Nutritional Norms for Poverty: Issues and Implications" (PDF). Indira Gandhi Institute of Development Research. Retrieved 22 May 2014.
- ↑ Mike Davis, (Editors - Richard Peet, Michael Watts) (2004). Liberation Ecologies: Environment, Development and Social Movements. Routledge. pp. 44–49. ISBN 978-0415312363.
- ↑ Davis, Mike (2001). Late Victorian Holocausts: El Niño Famines and the Making of the Third World. Verso. p. 7. ISBN 978-1859847398.
- ↑ Romesh Dutt (1901), Indian Famines, Their Causes and Prevention, London
- 1 2 3 B.S. Minhas, Rural Poverty, Land Redistribution and Development Strategy: Facts and Policy, Indian Economic Review New Series, Vol. 5, No. 1 (APRIL 1970), pp. 97-128
- ↑ B.S. Minhas (1974), Planning and the Poor at Google Books, Chand, pp. 71-76
- 1 2 Gary S. Fields, Poverty, Inequality, and Development at Google Books, ISBN 978-0521298520, pp. 204-210
- ↑ Poverty Puzzle, The Statesman
- ↑ Arvind Singhal (28 August 2008). "Arvind Singhal: A market at the bottom of the pyramid?" (PDF). Retrieved 22 May 2014.
- ↑ Joshi, P. D. (Department of Statistics, Ministry of Planning and Programme Implementation, India). "Conceptualisation, Measurement and Dimensional Aspects of Poverty in India, by P. D. Joshi, Department of Statistics, Ministry of Planning and Programme Implementation, India" (PDF). Seminar on Poverty Statistics Santiago 7–9 May 1997. United Nations Statistical Commission Expert Group on Poverty Statistics. Retrieved 7 September 2013.
- ↑ P. Sarangi, Consumption, Poverty And Inequality, ISBN 978-8183562645, pp. 188-200
- ↑ "Poverty in India | Economic and Political Weekly". Epw.in. 2 January 1971. Retrieved 22 May 2014.
- ↑ "Proceedings of the workshop on forests for poverty reduction: changing role for research, development and training institutions". Fao.org. Retrieved 22 May 2014.
- ↑ "Report of The Expert Group on Estimation of Proportion and Number of Poor" (PDF). Perspective Planning Division,Planning Commission. Retrieved 5 August 2013.
- ↑ Banerjee & Somanathan (2007), The political economy of public goods: Some evidence from India, Journal of development Economics, 82(2), pp. 287-314
- ↑ Chen, S., G. Datt, and M. Ravallion (1994), Is poverty increasing in the developing world?, Review of Income and Wealth, 40 (4): 359–376
- 1 2 Datt (1998), Poverty in India and Indian states: An update, IFPRI, Washington DC
- ↑ "eport of the Expert Group to Recommend the Detailed Methodology for Identification of Families Living Below Poverty Line in the Urban Areas" (PDF). Planning Commission. Retrieved 15 August 2013.
- ↑ "Report on Condition of Work and Promotion of Livelihoods in the unorganised sector." (PDF).
- ↑ "Calorie intake criterion puts 50 per cent Indians below poverty line". The Hindu. Chennai, India. 19 September 2009.
- ↑ http://www.ncaer.org/downloads/MediaClips/Press/businesstandard-arvindsingal.pdf
- ↑ "Country Briefing: India" (PDF). Oxford Poverty and Human Development Initiative. 2010. Retrieved 14 June 2011.
- 1 2 "India's poverty will fall from 51% to 22% by 2015: UN report – Times of India". Timesofindia.indiatimes.com. 8 July 2011. Retrieved 16 October 2011.
- ↑ Agarwal, Vibhuti (5 February 2015). "India Hits Its U.N. Poverty-Cutting Target, but Misses Others" – via Wall Street Journal.
- ↑ "2011 Global Hunger Index Report" (PDF). International Food Policy Research Institute (IFPRI). pp. 12, 49.
- ↑ Bera, By Sayantan (13 October 2014). "India betters its rank in Global Hunger Index".
- 1 2 Working Paper No. 2013-02.Poverty by Social, Religious & EconomicGroups in India and Its Largest States1993-94 to 2011-12
- ↑ "Inclusive Growth and Service delivery: Building on India's Success" (PDF). World Bank. 2006. Retrieved 28 April 2007.
- ↑ "Luis Flores Ballesteros. "How lack or poor infrastructure shapes inequality and poverty in supernations. A lesson from India" 54 Pesos Sep. 2010:54 Pesos 28 Sep 2010". 54pesos.org. Retrieved 16 October 2011.
- ↑ "A special report on India: Ruled by Lakshmi Dec 11th 2008 From The Economist print edition". Economist.com. 11 December 2008. Retrieved 16 October 2011.
- ↑ Ghosh, Jayati (4 October 2011). "India'a official poverty line". London: Guardian UK.
- ↑ "Households Availing Banking Services with Households in India" (PDF). Town and Country Planning Organisation, Ministry of Urban Affairs. 2001. Retrieved 31 July 2009.
- ↑ Material%20for%20DOT%27s%20WEBSITE%20December%202012.pdf "Department of Telecom, memo Feb 2013" Check
|url=value (help) (PDF). Department of Telecommunication of India. 2013. - ↑ India CIA World Fact Book. 7 August 2008. Retrieved 20 August 2008.
- 1 2 MEGHNAD DESAI (2003). "INDIA and CHINA: AN ESSAY IN COMPARATIVE POLITICAL ECONOMY" (PDF). IMF.
- ↑ Swaminathan S. Anklesaria Aiyar, Socialism Kills - The Human Cost of Delayed Economic Reform in India, Cato Institute (21 October 2009)
- ↑ Ray, S. C. (2002), Did India's economic reforms improve efficiency and productivity? A nonparametric analysis of the initial evidence from manufacturing, Indian Economic Review, Vol. 37, No. 1, pp. 23-57
- ↑ Overstreet (1958), Soviet and Communist Policy in India, The Journal of Politics, 20(1), pp. 187-202
- ↑ Street Hawking Promise Jobs in Future, The Times of India, 25 November 2001 Archived 29 March 2008 at the Wayback Machine.
- ↑ Kumar (2003), Corruption and Human Rights: Promoting Transparency in Governance and the Fundamental Right to Corruption-Free Service in India, Columbia Journal of Asian Law, 17, 31
- ↑ The India Report, Astaire Research
- ↑ Thakur (1993), Restoring India's economic health, Third World Quarterly, 14(1), 137-157
- ↑ India: the economy. Published in 1998 by BBC.
- 1 2 "What Went Wrong: Derailing after the 1950s".
- ↑ Chakravarty, Manas (13 October 2014). "The World Bank on India's poverty".
- ↑ "India's Urban Poverty Agenda: Understanding the Poor in Cities and Formulating Appropriate Anti-Poverty Actions" (PDF). Goa, India. 9–21 January 2000. Retrieved 22 May 2014.
- ↑ Ravallion & Datt (2002), Why has economic growth been more pro-poor in some states of India than others?, Journal of development economics, 68(2), 381-400
- ↑ Klonner and Oldiges, Employment Guarantee and its Welfare E§ects in India University of Heidelberg, (September 2012)
- ↑ Klonner and Oldiges, Safety Net for India's Poor or Waste of Public Funds? Poverty and Welfare in the Wake of the World's Largest Job Guarantee Program University of Heidelberg, Germany (May 2014)
- ↑ "Thehindu.com/2009/04/03/stories". Chennai, India: Hindu.com. 3 April 2009. Retrieved 16 October 2011.
- ↑ Sinha, Kounteya (27 February 2009). "India tops world hunger chart". The Times of India.
- ↑ THE NATIONAL FOOD SECURITY ACT, 2013 The Gazette of India, Govt of India (2013)
- ↑ The Multidimensions of Urban Poverty in India, Centre de Sciences Humaines, New Delhi Archived 19 June 2006 at the Wayback Machine.
- ↑ Human Development Report, The Real Wealth of Nations: Pathways to Human Development (2010)
- ↑ Nutrition - India UNICEF
- 1 2 3 [http://dhsprogram.com/pubs/pdf/FRIND3/FRIND3-Vol1[Oct-17-2008].pdf NATIONAL FAMILY HEALTH SURVEY (NFHS-3) 2005–06] Volume 1, Govt of India, pp. 269-273
- ↑ "AFP: India's malnutrition 'a national shame', says PM". Google.com. 10 January 2012. Archived from the original on 25 February 2012. Retrieved 13 August 2012.
- ↑ India - Malnutrition Report World Bank (2005)
- ↑ "INDIA'S UNDERNOURISHED CHILDREN: A CALL FOR REFORM AND ACTION" (PDF). World Bank. August 2005. Retrieved 16 October 2011.
- 1 2 "Child malnutrition in India: Putting the smallest first". The Economist. 23 September 2010. Retrieved 16 October 2011.
- 1 2 "News & Broadcast – Urgent Action Needed to Overcome Persistent Malnutrition in India, says World Bank Report". Web.worldbank.org. 11 May 2006. Retrieved 16 October 2011.
- ↑ "India - Integrated Child Development Services (ICDS)" (PDF). Retrieved 22 May 2014.
- ↑ "India – Statistics". UNICEF. Retrieved 16 October 2011.
- ↑ Dasgupta, R., Ahuja, S., & Yumnam, V. (2014), Can nutrition rehabilitation centers address severe malnutrition in India?, Indian pediatrics, 51(2), 95-99
- ↑ Aguayo et al., Providing care for children with severe acute malnutrition in India: new evidence from Jharkhand, Public Health Nutrition / Volume 17 / Issue 01 / January 2014, pp 206-211
- ↑ Ruel and Alderman, Nutrition-sensitive interventions and programmes: how can they help to accelerate progress in improving maternal and child nutrition?, The Lancet, Volume 382, Issue 9891, Pages 536 - 551, 10 August 2013
- 1 2 3 Arvind Panagariya, Does India Really Suffer from Worse Child Malnutrition Than Sub-Saharan Africa?, E&P Weekly, 4 May 2013, Vol 48, No 18, pp. 98-111
- ↑ Tarozzi, Alessandro (2008): "Growth Reference Charts and the Status of Indian Children", Economics and Human Biology, 6 (3), pp. 455-468
- ↑ Kuczmarski et al. (2002), "2000 CDC Growth Charts for the United States: Methods and Development", Vital and Health Statistics, Series 11, 246, pp 1-190
Further reading
- Poverty in India, World Bank
- "Can India eradicate poverty? Will India's economic boom help the poor?"
- Deaton, A. & Kozel, V. (2005): Data and Dogma: The Great Indian Poverty Debate. The World Bank Research Observer, Vo. 20, No. 2.
- "World Hunger – India"
- George, Abraham, Wharton Business School Publications – Why the Fight Against Poverty is Failing: A Contrarian View
- Poverty and riches in booming India
External links
| Wikimedia Commons has media related to Poverty in India. |
- Poverty in India 2
- Expert Group on Methodology for Estimation of Poverty Suresh Tendulkar
- From poverty to empowerment: India’s imperative for jobs, growth, and effective basic services McKinsey Global Institute (2013)
- PERSPECTIVES ON POVERTY IN INDIA, The World Bank (2013)
- Chapter 4 - INDIA: DEFINING AND EXPLAINING INCLUSIVE GROWTH AND POVERTY, International Monetary Fund (2014)
| Companies |
|
|---|---|
| Governance |
|
| Currency | |
| Financial services | |
| History | |
| People |
|
| States | |
| Sectors | |
| |