Economic history of India
The known economic history of India begins with the Indus Valley Civilisation (3300–1300 BC), whose economy appears to have depended significantly on trade, which was facilitated by advances in transport. Around 600 BC, the Mahajanapadas minted punch-marked silver coins. The period was marked by intensive trade activity and urban development. By 300 BC, the Maurya Empire united most of the Indian subcontinent. The political unity and military security allowed for a common economic system and enhanced trade and commerce, with increased agricultural productivity. For the next 1500 years, India produced its classical civilisations such as the Rashtrakutas, Hoysalas and Western Gangas. During this period India is estimated to have had the largest economy of the ancient and medieval world between 1 AD until 16th century AD, controlling between one third and one fourth of the world's wealth up to the time of Maratha Empire, from when it rapidly declined during European intervention.
Thanks to its prehistory as a trading zone and later the colonial status, colonial India experienced a deep economic integration with the world. Trade, investment and migration rose to higher levels than before.[1] According to economic historian Angus Maddison in his book The World Economy: A Millennial Perspective, India was the richest country in the world and had the world's largest economy until the 16th century AD.[2][3] According to the Balance of Economic Power, India had the largest and most advanced economy from 1 AD to 16th century AD, the most of any country for a large part of the last two millennia.[4]
India has followed central planning for most of its independent history, which have included extensive public ownership, regulation, red tape, and trade barriers.[5][6] After the 1991 economic crisis, the central government launched economic liberalisation. India has turned towards a more capitalist system and has emerged as one of the fastest growing large economies of the world.[5][7]
Indus Valley civilization
Indus Valley civilisation, the first known permanent and predominantly urban settlement that flourished between 3500 BC and 1800 BC boasted of an advanced and thriving economic system. Its citizens practised agriculture, domesticated animals, made sharp tools and weapons from copper, bronze and tin and traded with other cities.[8] Evidence of well laid streets, layouts, drainage system and water supply in the valley's major cities, Harappa, Lothal, Mohenjo-daro and Rakhigarhi reveals their knowledge of urban planning.
Ancient and medieval characteristics
Though ancient India had a significant urban population, much of India's population resided in villages, whose economy was largely isolated and self-sustaining. Agriculture was the predominant occupation of the populace and satisfied a village's food requirements besides providing raw materials for hand based industries like textile, food processing and crafts. Besides farmers, other classes of people were barbers, carpenters, doctors (Ayurvedic practitioners), goldsmiths, weavers etc.[9]
Religion
Religion, especially Hinduism and Jainism, played an influential role in shaping economic activities.
Pilgrimage towns like Allahabad, Benares, Nasik and Puri, mostly centred around rivers, developed into centres of trade and commerce. Religious functions, festivals and the practice of taking a pilgrimage resulted in a flourishing pilgrimage economy.[10]
Economics in Jainism is influenced by Mahavira and his principles and philosophies. His philosophies have been used to explain the economics behind it. He was the last of the 24 Tirthankars, who spread Jainism. In the Economics context he explains the importance of the concept of 'anekanta'(non-absolutism).[11]
Family business
In the joint family system, members of a family pooled their resources to maintain the family and invest in business ventures. The system ensured younger members were trained and employed in the family business and the older and disabled persons would be supported by the family. The system, by preventing the agricultural land from being split ensured higher yield because of the benefits of scale. Such sanctions curbed the spirit of rivality in junior members and made a peculiar sense of obedience.[12]
Organisational entities
Along with the family-run business and individually owned business enterprises, ancient India possessed a number of other forms of engaging in business or collective activity, including the gana, pani, puga, vrata, sangha, nigama and sreni. Nigama, pani and sreni refer most often to economic organisations of merchants, craftspeople and artisans, and perhaps even para-military entities. In particular, the sreni was a complex organisational entity that shares many similarities with modern corporations, which were being used in India from around the 8th century BC until around the 10th century AD. The use of such entities in ancient India was widespread including virtually every kind of business, political and municipal activity.[13]
The sreni was a separate legal entity which had the ability to hold property separately from its owners, construct its own rules for governing the behaviour of its members, and for it to contract, sue and be sued in its own name. Some ancient sources such as Laws of Manu VIII and Chanakya's Arthashastra have rules for lawsuits between two or more sreni and some sources make reference to a government official (Bhandagarika) who worked as an arbitrator for disputes amongst sreni from at least the 6th century BC onwards.[14] There were between 18 and 150 sreni at various times in ancient India covering both trading and craft activities. This level of specialisation of occupations is indicative of a developed economy in which the sreni played a critical role. Some sreni could have over 1000 members as there were apparently no upper limits on the number of members.
The sreni had a considerable degree of centralised management. The headman of the sreni represented the interests of the sreni in the king's court and in many official business matters. The headman could also bind the sreni in contracts, set the conditions of work within the sreni, often received a higher salary, and was the administrative authority within the sreni. The headman was often selected via an election by the members of the sreni, who could also be removed from power by the general assembly. The headman often ran the enterprise with two to five executive officers, who were also elected by the assembly.
Coinage
Punch marked silver ingots, in circulation around the 5th century BC and the first metallic coins were minted around the 6th century BC by the Mahajanapadas of the Gangetic plains were the earliest traces of coinage in India. While India's many kingdoms and rulers issued coins, barter was still widely prevalent.[15] Villages paid a portion of their agricultural produce as revenue while its craftsmen received a stipend out of the crops at harvest time for their services. Each village, as an economic unit, was mostly self-sufficient.[16]
GDP estimate
According to economic historian Angus Maddison in his book Contours of the world economy, 1–2030 AD: essays in macro-economic history, India had the world's largest economy during the years 1 AD and 1000 AD.[17]
During the Maurya Empire (c. 321–185 BC), there were a number of important changes and developments to the Indian economy. It was the first time most of India was unified under one ruler. With an empire in place, the trade routes throughout India became more secure thereby reducing the risk associated with the transportation of goods. The empire spent considerable resources building roads and maintaining them throughout India. The improved infrastructure combined with increased security, greater uniformity in measurements, and increasing usage of coins as currency enhanced trade.[18]
Mughal Empire
During the Mughal period (1526–1858) in the 16th century, the gross domestic product of India was estimated at about 25.1% of the world economy.
An estimate of India's pre-colonial economy puts the annual revenue of Emperor Akbar's treasury in 1600 at £17.5 million (in contrast to the entire treasury of Great Britain two hundred years later in 1800, which totaled £16 million). The gross domestic product of Mughal India in 1600 was estimated at about 24.3% the world economy, the second largest in the world.[19]
By the late 17th century, the Mughal Empire was as its peak and had expanded to include almost 90 per cent of South Asia, and enforced a uniform customs and tax-administration system. In 1700 the exchequer of the Emperor Aurangzeb reported an annual revenue of more than £100 million.
In the 18th century, Mughals were replaced by the Marathas as the dominant power in much of India, while the other small regional kingdoms who were mostly late Mughal tributaries such as the Nawabs in the north and the Nizams in the south, declared an autonomy. However, the efficient Mughal tax administration system was left largely intact.
By this time, India had fallen from the top rank to become the second-largest economy in the world.[19] A devastating famine broke out in the eastern coast in early 1770s killing 5 percent of the national population.[20]
Economic historians in the 21st century have found that in the 18th century real wages were falling in India, and were "far below European levels."[21]
British rule
After gaining the right to collect revenue in Bengal in 1765, the East India Company largely ceased importing gold and silver, which it had hitherto used to pay for goods shipped back to Britain.[22] In addition, as under Mughal rule, land revenue collected in the Bengal Presidency helped finance the Company's wars in other part of India.[22] Consequently, in the period 1760–1800, Bengal's money supply was greatly diminished; furthermore, the closing of some local mints and close supervision of the rest, the fixing of exchange rates, and the standardization of coinage, paradoxically, added to the economic downturn.[22] During the period, 1780–1860, India changed from being an exporter of processed goods for which it received payment in bullion, to being an exporter of raw materials and a buyer of manufactured goods.[22] More specifically, in the 1750s, mostly fine cotton and silk was exported from India to markets in Europe, Asia, and Africa; by the second quarter of the 19th century, raw materials, which chiefly consisted of raw cotton, opium, and indigo, accounted for most of India's exports.[23] Also, from the late 18th century British cotton mill industry began to lobby the government to both tax Indian imports and allow them access to markets in India.[23] Starting in the 1830s, British textiles began to appear in—and soon to inundate—the Indian markets, with the value of the textile imports growing from £5.2 million 1850 to £18.4 million in 1896.[24] The abolition of slavery encouraged New World plantations to organize the import of South Asian labor.[25]
The British colonial rule created an institutional environment that stabilized law and order to a large extent. The British foreign policies however stifled the trade with rest of the world. They created a well-developed system of railways, telegraphs and a modern legal system. The infrastructure the British created was mainly geared towards the exploitation of resources in the world and totally stagnant, with industrial development stalled, agriculture unable to feed a rapidly accelerating population. They were subject to frequent famines, had one of the world's lowest life expectancies, suffered from pervasive malnutrition and were largely illiterate.
Declining Share of World GDP
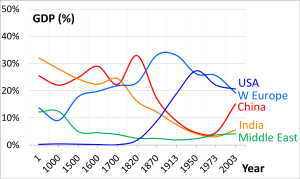
British economist, Angus Maddison argues that India's share of the world income went from 27% in 1700 (compared to Europe's share of 23%) to 3% in 1950.[19] Modern economic historians have blamed the colonial rule for the dismal state of India's economy, investment in Indian industries was limited since it was a colony.[27][28]
| Period | Price of Silver (in pence per Troy ounce) | Rupee exchange rate (in pence) |
|---|---|---|
| 1871–1872 | 60½ | 23 ⅛ |
| 1875–1876 | 56¾ | 21⅝ |
| 1879–1880 | 51¼ | 20 |
| 1883–1884 | 50½ | 19½ |
| 1887–1888 | 44⅝ | 18⅞ |
| 1890–1951 | 47 11/16 | 18⅛ |
| 1891–1892 | 45 | 16¾ |
| 1892–1893 | 39 | 15 |
| Source: B.E. Dadachanji. History of Indian Currency and Exchange, 3rd enlarged ed.
(Bombay: D.B. Taraporevala Sons & Co, 1934), p. 15 | ||
The fall of the Rupee
After its victory in the Franco-Prussian War (1870–71), Germany extracted a huge indemnity from France of £200,000,000, and then moved to join Britain on a gold standard for currency. France, the US and other industrialising countries followed Germany in adopting a gold standard throughout the 1870s. At the same time, countries, such as Japan, which did not have the necessary access to gold or those, such as India, which were subject to imperial policies that determined that they did not move to a gold standard, remained mostly on a silver standard. A huge divide between silver-based and gold-based economies resulted. The worst affected were economies with a silver standard that traded mainly with economies with a gold standard. With discovery of more and more silver reserves, those currencies based on gold continued to rise in value and those based on silver were declining due to demonetisation of silver. For India which carried out most of its trade with gold based countries, especially Britain, the impact of this shift was profound. As the price of silver continued to fall, so too did the exchange value of the rupee, when measured against sterling.
British East India Company rule
During this period, the East India Company began tax administration reforms in a fast expanding empire spread over 250 million acres (1,000,000 km2), or 35 per cent of Indian domain. Indirect rule was also established on protectorates and buffer states.
Ray (2009) raises three basic questions about the 19th-century cotton textile industry in Bengal: when did the industry begin to decay, what was the extent of its decay during the early 19th century, and what were the factors that led to this? Since there is no data on production, Ray uses the industry's market performance and its consumption of raw materials. Ray challenges the prevailing belief that the industry's permanent decline started in the late 18th century or the early 19th century. The decline actually started in the mid-1820s. The pace of its decline was, however, slow though steady at the beginning, but reached crisis point by 1860, when 563,000 workers lost their jobs. Ray estimates that the industry shrank by about 28% by 1850. However, it survived in the high-end and low-end domestic markets. Ray agrees that British discriminatory policies undoubtedly depressed the industry's export outlet, but suggests its decay is better explained by technological innovations in Britain.[29]
The absence of industrialisation during the colonial period
Historians have questioned why India did not undergo industrialisation in the 19th century in the way that Britain did. In the 17th century, India was a relatively urbanised and commercialised nation with a buoyant export trade, devoted largely to cotton textiles, but also including silk, spices, and rice. By the end of the century, India was the world’s main producer of cotton textiles and had a substantial export trade to Britain, as well as many other European countries, via the East India Company. Yet as British cotton industry underwent a technological revolution in the late 18th century, the Indian industry stagnated, and industrialisation in India was delayed until the 20th century. Historians have suggested that this was because India was still a largely agricultural nation with low wages levels. In Britain, wages were high, so cotton producers had the incentive to invent and purchase expensive new labour-saving technologies. In India, by contrast, wages levels were low, so producers preferred to increase output by hiring more workers rather than investing in technology.[30]
Comparative Indian and UK populations and GDP per capita: 1600–1871 (1990 international $)[31][32]
| Year | India ($) | UK ($) | Ratio (%) | Population India (m) | UK (m) |
|---|---|---|---|---|---|
| 1600 | 792 | 1,481 | 53.4 | 142 | 5 |
| 1650 | 746 | 1,463 | 51.0 | 142 | 5.8 |
| 1700 | 728 | 1,809 | 40.3 | 164 | 8.8 |
| 1751 | 669 | 1,842 | 36.3 | 190 | 9.2 |
| 1801 | 646 | 1,985 | 32.6 | 207 | 16.3 |
| 1811 | 617 | 2,083 | 29.6 | 215 | 18.5 |
| 1821 | 587 | 2,080 | 28.2 | 205 | 21.0 |
| 1831 | 592 | 2,228 | 26.6 | 216 | 24.1 |
| 1841 | 592 | 2,404 | 24.6 | 212 | 26.9 |
| 1851 | 594 | 2,718 | 21.9 | 232 | 27.5 |
| 1861 | 562 | 3,124 | 18.0 | 244 | 29.1 |
| 1871 | 533 | 3,676 | 14.5 | 256 | 31.6 |
British Raj
The formal dissolution of the declining Mughal Dynasty heralded a change in British treatment of Indian subjects. During the British Raj, massive railway projects were begun in earnest and government jobs and guaranteed pensions attracted a large number of upper caste Hindus into the civil service for the first time. British cotton exports reach 55 per cent of the Indian market by 1875.[33] Industrial production as it developed in European factories was unknown in India until the 1850s when the first cotton mills were opened in Bombay, posing a challenge to the cottage-based home production system based on family labour.[34]
The worldwide Great Depression of 1929 had a small direct impact on traditional India, with relatively little impact on the modern secondary sector. The government did little to alleviate distress, and was focused mostly on shipping gold to Britain.[35] The worst consequences involved deflation, which increased the burden of the debt on villagers while lowering the cost of living.[36] In terms of volume of total economic output, there was no decline between 1929 and 1934. Falling prices for jute (and also wheat) hurt larger growers. The worst hit sector was jute, based in Bengal, which was an important element in overseas trade; it had prospered in the 1920s but was hard hit in the 1930s.[37] In terms of employment, there was some decline, while agriculture and small-scale industry also exhibited gains.[38] The most successful new industry was sugar, which had meteoric growth in the 1930s.[39][40]
The newly independent but weak Union government's treasury reported annual revenue of £334 million in 1950. In contrast, Nizam Asaf Jah VII of south India was widely reported to have a fortune of almost £668 million then.[41] About one-sixth of the national population were urban by 1950.[42] A US Dollar was exchanged at 4.79 Rupees.
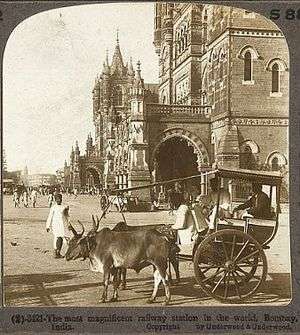
Railways
British investors built a modern railway system in the late 19th century—it was the fourth largest in the world and was renowned for quality of construction and service.[43] The government was supportive, realising its value for military use in case of another rebellion, as well as its value for economic growth. All the funding and management came from private British companies. The railways at first were privately owned and operated, and run by British administrators, engineers and skilled craftsmen. At first, only the unskilled workers were Indians.[44]
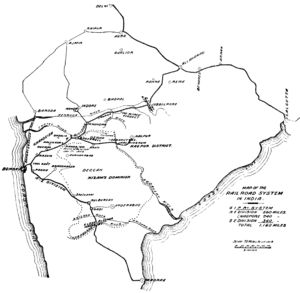
A plan for a rail system in India was first put forward in 1832. A few short lines were built in the 1830s, but they did not interconnect. 1844, Governor-General Lord Hardinge allowed private entrepreneurs to set up a rail system in India. The John Company (and later the colonial government) encouraged new railway companies backed by private investors under a scheme that would provide land and guarantee an annual return of up to five percent during the initial years of operation. The companies were to build and operate the lines under a 99-year lease, with the government having the option to buy them earlier.[45]
Two new railway companies, Great Indian Peninsular Railway (GIPR) and East Indian Railway (EIR) began in 1853–54 to construct and operate lines near Bombay and Calcutta.[45] In 1853, the first passenger train service was inaugurated between Bori Bunder in Bombay and Thane. Covering a distance of 34 km (21 mi).[46] The first passenger railway line in North India between Allahabad and Kanpur opened in 1859.
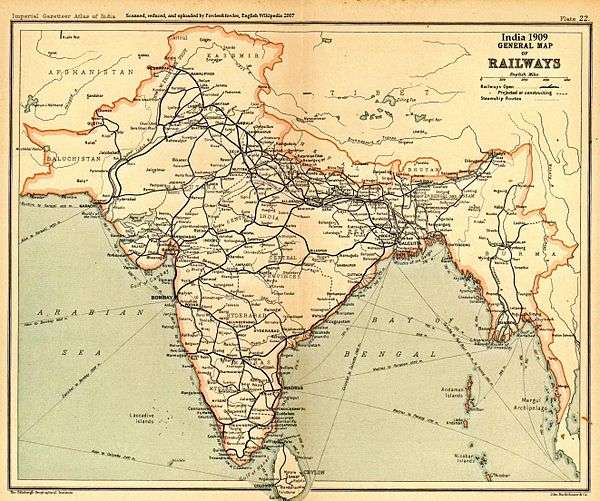
In 1854 Governor-General Lord Dalhousie formulated a plan to construct a network of trunk lines connecting the principal regions of India. Encouraged by the government guarantees, investment flowed in and a series of new rail companies were established, leading to rapid expansion of the rail system in India.[47] Soon several large princely states built their own rail systems and the network spread to the regions that became the modern-day states of Assam, Rajasthan and Andhra Pradesh. The route mileage of this network increased from 1,349 km (838 mi) in 1860 to 25,495 km (15,842 mi) in 1880 – mostly radiating inland from the three major port cities of Bombay, Madras, and Calcutta.[48] Most of the railway construction was done by Indian companies supervised by British engineers. The system was heavily built, in terms of sturdy tracks and strong bridges. By 1900 India had a full range of rail services with diverse ownership and management, operating on broad, metre and narrow gauge networks.[49] In 1900 the government took over the GIPR network, while the company continued to manage it.
In the First World War, the railways were used to transport troops and grains to the ports of Bombay and Karachi en route to Britain, Mesopotamia, and East Africa. With shipments of equipment and parts from Britain curtailed, maintenance became much more difficult; critical workers entered the army; workshops were converted to making artillery; some locomotives and cars were shipped to the Middle East. The railways could barely keep up with the increased demand.[50] By the end of the war, the railways had deteriorated badly.[51] In 1923, both GIPR and EIR were nationalised.[49]
Headrick argues that until the 1930s, both the Raj lines and the private companies hired only European supervisors, civil engineers, and even operating personnel, such as locomotive engineers. The government's Stores Policy required that bids on railway contracts be made to the India Office in London, shutting out most Indian firms. The railway companies purchased most of their hardware and parts in Britain. There were railway maintenance workshops in India, but they were rarely allowed to manufacture or repair locomotives. TISCO could not obtain orders for rails until the 1920s.[52]
The Second World War severely crippled the railways as rolling stock was diverted to the Middle East, and the railway workshops were converted into munitions workshops.[53]
India provides an example of the British Empire pouring its money and expertise into a very well built system designed for military purposes after the Mutiny of 1857, and with the hope that it would stimulate industry. The system was overbuilt and too expensive for the small amount of freight traffic it carried. However, it did capture the imagination of the Indians, who saw their railways as the symbol of an industrial modernity—but one that was not realized until after Independence. Christensen (1996) looks at of colonial purpose, local needs, capital, service, and private-versus-public interests. He concludes that making the railways a creature of the state hindered success because railway expenses had to go through the same time-consuming and political budgeting process as did all other state expenses. Railway costs could therefore not be tailored to the timely needs of the railways or their passengers.[54]
After independence in 1947, forty-two separate railway systems, including thirty-two lines owned by the former Indian princely states, were amalgamated to form a single unit named the Indian Railways. The existing rail networks were abandoned in favor of zones in 1951 and a total of six zones came into being in 1952.[49]
Agriculture and industry
The Indian economy grew at about 1% per year from 1880 to 1920, and the population also grew at 1%.[55] The result was, on average, no long-term change in income levels. Agriculture was still dominant, with most peasants at the subsistence level. Extensive irrigation systems were built, providing an impetus for growing cash crops for export and for raw materials for Indian industry, especially jute, cotton, sugarcane, coffee and tea.[56]
The entrepreneur Jamsetji Tata (1839–1904) began his industrial career in 1877 with the Central India Spinning, Weaving, and Manufacturing Company in Bombay. While other Indian mills produced cheap coarse yarn (and later cloth) using local short-staple cotton and cheap machinery imported from Britain, Tata did much better by importing expensive longer-stapled cotton from Egypt and buying more complex ring-spindle machinery from the United States to spin finer yarn that could compete with imports from Britain.[57]
In the 1890s, Tata launched plans to expand into heavy industry using Indian funding. The Raj did not provide capital, but aware of Britain's declining position against the U.S. and Germany in the steel industry, it wanted steel mills in India so it is did promise to purchase any surplus steel Tata could not otherwise sell.[58] The Tata Iron and Steel Company (TISCO), headed by his son Dorabji Tata (1859–1932), opened its plant at Jamshedpur in Bihar in 1908. It became the leading iron and steel producer in India, with 120,000 employees in 1945.[59] TISCO became an India's proud symbol of technical skill, managerial competence, entrepreneurial flair, and high pay for industrial workers.[60]
Economic impact of British imperialism
.png)
Debate continues about the economic impact of British imperialism on India. The issue was actually raised by conservative British politician Edmund Burke who in the 1780s vehemently attacked the East India Company, claiming that Warren Hastings and other top officials had ruined the Indian economy and society. Indian historian Rajat Kanta Ray (1998) continues this line of reasoning, saying the new economy brought by the British in the 18th century was a form of plunder and a catastrophe for the traditional economy of Mughal India. (Economic Drain Theory) Ray believes that British depleted the food and money stocks and imposed high taxes that helped cause the terrible famine of 1770, which killed a third of the people of Bengal.[61]
P. J. Marshall, a British historian known for his work on the British empire, has a reinterpretation of the view that the prosperity of the formerly being Mughal rule gave way to poverty and anarchy. Marshall argues the British takeover did not make any sharp break with the past. British control was delegated largely through regional rulers and was sustained by a generally prosperous economy for the rest of the 18th century, except the frequent famines with very high fatality rate (Famine in India). Marshall notes the British raised revenue through local tax administrators and kept the old Mughal rates of taxation. Instead of the Indian nationalist account of the British as alien aggressors, seizing power by brute force and impoverishing all of India, Marshall presents a British nationalist interpretation in which the British were not in full control but instead were controllers in what was primarily an Indian play and in which their ability to keep power depended upon excellent cooperation with Indian elites. Marshall admits that much of his interpretation is still rejected by almost all historians.[62]
Republic of India
After the independence India adopted a socialist-inspired economic model with elements of capitalism. India adopted a USSR-like centralized and nationalized economic programs called Five-Year Plans. This Nehruvian policy suppressed economic growth for several decades.
Socialist rate of growth
.png)
The "Nehruvian Socialist rate of growth" is used to refer to the low annual growth rate of the economy of India before 1991. It stagnated at around 3.5% from the 1950s to 1980s, while per capita income growth averaged extremely low 1.3% a year.[63] At the same time, South Korea grew by 10% and Taiwan by 12%.[64] This phenomenon was called the "Hindu rate of growth", by the leading Indian economist Raj Krishna.[65]
Socialist reforms (1950–1975)
In 1975 the GDP size (in 1990 US dollars) was $545 billion in India, $1561 billion in the USSR, $1266 billion in Japan, and $3517 billion in the US.[66]
Before independence a large share of tax revenue was generated by the land tax, which was in effect a lump sum tax on land. Since then land taxes have steadily declined as a share of revenues and completely replaced by sales taxes.[67]
Moreover, the structural economic problems inherited at independence were exacerbated by the costs associated with the partition of British India, which had resulted in about 2 to 4 million refugees fleeing past each other across the new borders between India and Pakistan. The settlement of refugees was a considerable financial strain. Partition also divided India into complementary economic zones. Under the British, jute and cotton were grown in the eastern part of Bengal, the area that became East Pakistan (after 1971, Bangladesh), but processing took place mostly in the western part of Bengal, which became the Indian state of West Bengal in 1947. As a result, after independence India had to employ land previously used for food production to cultivate cotton and jute in Bengal and for its mills.[68]
Government was assigned an important role in the process of alleviating poverty, and since 1951 a series of plans had guided the country's economic development. Although there was considerable growth in the 1950s, the long-term rates of real growth were less positive than India's politicians expected.[69]
Toward the end of Nehru's term as prime minister, India would continue to face serious food shortages despite hoped for progress and increases in agricultural production.
Since 1950, India ran into trade deficits that increased in magnitude in the 1960s. The Government of India had a budget deficit problem and therefore could not borrow money from abroad or from the private sector, which itself had a negative savings rate. As a result, the government issued bonds to the RBI, which increased the money supply, leading to inflation. In 1966, foreign aid, which was hitherto a key factor in preventing devaluation of the rupee was finally cut off and India was told it had to liberalise its restrictions on trade before foreign aid would again materialise. The response was the politically unpopular step of devaluation accompanied by liberalisation. The Indo-Pakistani War of 1965 led the US and other countries friendly towards Pakistan to withdraw foreign aid to India, which further necessitated devaluation. Defence spending in 1965/1966 was 24.06% of total expenditure, the highest in the period from 1965 to 1989. This, accompanied by the drought of 1965/1966, led to a severe devaluation of the rupee. Current GDP per capita grew 33% in the 1960s, reaching a peak growth of 142% in the 1970s, decelerating sharply back to 41% in the 1980s and 20% in the 1990s.[70]
From FY 1951 to FY 1979, the economy grew at an average rate of about 3.1 percent a year in constant prices, or at an annual rate of 1.0 percent per capita.[71] During this period, industry grew at an average rate of 4.5 percent a year, compared with an annual average of 3.0 percent for agriculture. They managed to tamp down on the natural business acumen and abilities of the population, yet some economists differed over the relative importance of those factors.[72]
This is a chart of trend of gross domestic product of India at market prices estimated by Ministry of Statistics and Programme Implementation[73] with figures in millions of Indian Rupees.
| Year | Gross Domestic Product | US Dollar Exchange | Per Capita Income (as % of USA) |
|---|---|---|---|
| 1950 | 100,850 | 4.79 Indian Rupees | 3.12 |
| 1955 | 110,300 | 4.79 Indian Rupees | 2.33 |
| 1960 | 174,070 | 4.77 Indian Rupees | 2.88 |
| 1965 | 280,160 | 4.78 Indian Rupees | 3.26 |
| 1970 | 462,490 | 7.56 Indian Rupees | 2.23 |
| 1975 | 842,210 | 8.39 Indian Rupees | 2.18 |
The Union government treasury reported annual revenue of £5–6 billion in 1975 thus registering an average annual growth of almost 12 per cent during the third quarter of the 20th century. Nevertheless, prime minister Indira proclaimed emergency and suspended the Constitution in 1975. About one-fifth of the national population were urban by 1975.[75]
Steel
Prime Minister Jawaharlal Nehru, a believer in socialism, decided that the technological revolution in India needed maximisation of steel production. He, therefore, formed a government-owned company, Hindustan Steel Limited (HSL) and set up three steel plants in the 1950s.[76]
1975–2000
Economic liberalisation in India in the 1990s and first decade of the 21st century led to large changes in the economy.
This is a chart of trend of gross domestic product and foreign trade of India at market prices estimated by Ministry of Statistics and Programme Implementation with figures in millions of Indian Rupees. See also the IMF database.
| Year | Gross Domestic Product | Exports | Imports | US Dollar Exchange | Inflation Index (2000=100) | Per Capita Income (as % of USA) |
|---|---|---|---|---|---|---|
| 1975 | 842,210 | 8.39 Indian Rupees | 2.18 | |||
| 1980 | 1,380,334 | 90,290 | 135,960 | 7.86 Indian Rupees | 18 | 2.08 |
| 1985 | 2,729,350 | 149,510 | 217,540 | 12.36 Indian Rupees | 28 | 1.60 |
| 1990 | 5,542,706 | 406,350 | 486,980 | 17.50 Indian Rupees | 42 | 1.56 |
| 1995 | 11,571,882 | 1,307,330 | 1,449,530 | 32.42 Indian Rupees | 69 | 1.32 |
| 2000 | 20,791,898 | 2,781,260 | 2,975,230 | 44.94 Indian Rupees | 100 | 1.26 |
[77] About one-fourth of the national population was urban by 2000.[78]
2000–present
The Indian steel industry began expanding into Europe in the 21st century. In January 2007 India's Tata Steel made a successful $11.3 billion offer to buy European steel maker Corus Group. In 2006 Mittal Steel (based in London but with Indian management) acquired Arcelor for $34.3 billion to become the world's biggest steel maker, ArcelorMittal, with 10% of the world's output.[79]
The gross domestic product of India in 2007 was estimated at about 8 per cent that of the USA. National Democratic Alliance led by Bharatiya Janata Party (BJP), was in helm of economic affairs from 1998 to 2004. One of the many economic achievements of the government was the universal license in telecommunication field, which allows CDMA license holders to provide GSM services and vice versa. The BJP led government started off the Golden Quadrilateral road network connecting main metros of Delhi, Chennai, Mumbai and Kolkata along with various Indian regions. The project, completed in January 2012, was the most ambitious infrastructure projects of independent India.[80][81] Simultaneously, North-South and East-West highway projects were planned and construction was started,[82] but the later plans were dropped by Congress government.
The top 3% of the population still contribute 50% of the GDP. Education was made a fundamental right by amending the constitution of India and huge amount of money was pumped into the project under the name of Sarva Shiksha Abhiyan.
Currently, the economic activity in India has taken on a dynamic character which is at once curtailed by creaky infrastructure, for example dilapidated roads and severe shortages of electricity, and cumbersome justice system[83] yet at the same time accelerated by the sheer enthusiasm and ambition of industrialists and the populace.
This is a chart of trend of gross domestic product and foreign trade of India at market prices estimated by Ministry of Statistics and Programme Implementation with figures in millions of Indian Rupees.
| Year | Gross Domestic Product | Exports | Imports | US Dollar Exchange | Inflation Index (2000=100) | Per Capita Income (as % of USA) |
|---|---|---|---|---|---|---|
| 2000 | 21,774,130 | 2,781,260 | 2,975,230 | 44.94 Indian Rupees | 100 | 1.26 |
| 2005 | 36,933,690 | 7,120,870 | 8,134,660 | 44.09 Indian Rupees | 121 | 1.64 |
| 2010 | 77,953,140 | 17,101,930 | 20,501,820 | 45.83 Indian Rupees | 185 | 2.01 |
| 2012 | 100,020,620 | 23,877,410 | 31,601,590 | 54.93 Indian Rupees | 219 | 2.90 |
For purchasing power parity comparisons, the US Dollar is exchanged at 9.46 Rupees only. Despite steady growth and continuous reforms since the Nineties, Indian economy is still mired in bureaucratic hurdles from coast to coast. This was confirmed by a World Bank report published in late 2006 ranking Pakistan (at 74th) well ahead of India (at 134th) based on ease of doing business.[84]
GDP history of India after Independence
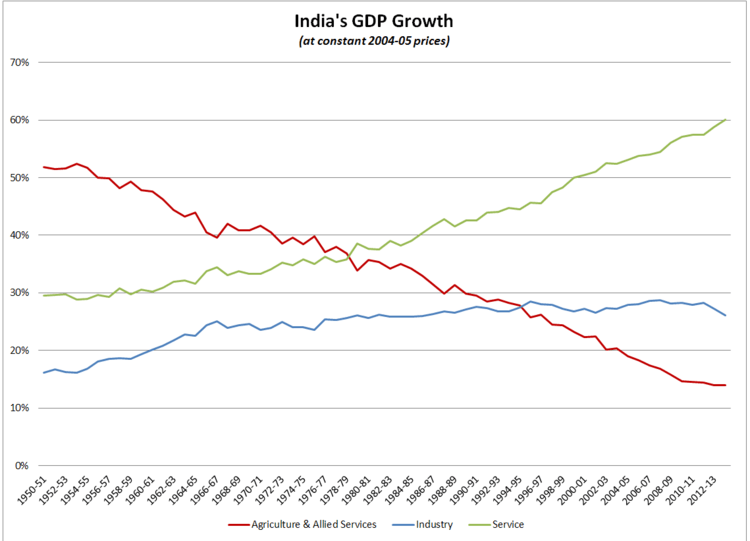
| Year | India's GDP at Current Prices (in crores INR) | India's GDP at Constant 2004–2005 Prices (in crores INR) | Real Growth Rate |
|---|---|---|---|
| 1950–51 | ₹10,036 | ₹279,618 | |
| 1951–52 | ₹10,596 | ₹286,147 | 2.33% |
| 1952–53 | ₹10,449 | ₹294,267 | 2.84% |
| 1953–54 | ₹11,378 | ₹312,177 | 6.09% |
| 1954–55 | ₹10,689 | ₹325,431 | 4.25% |
| 1955–56 | ₹10,861 | ₹333,766 | 2.56% |
| 1956–57 | ₹12,965 | ₹352,766 | 5.69% |
| 1957–58 | ₹13,255 | ₹348,500 | −1.21% |
| 1958–59 | ₹14,827 | ₹374,948 | 7.59% |
| 1959–60 | ₹15,574 | ₹383,153 | 2.19% |
| 1960–61 | ₹17,049 | ₹410,279 | 7.08% |
| 1961–62 | ₹17,992 | ₹423,011 | 3.10% |
| 1962–63 | ₹19,238 | ₹431,960 | 2.12% |
| 1963–64 | ₹21,986 | ₹453,829 | 5.06% |
| 1964–65 | ₹25,686 | ₹488,247 | 7.58% |
| 1965–66 | ₹26,895 | ₹470,402 | −3.65% |
| 1966–67 | ₹30,613 | ₹475,190 | 1.02% |
| 1967–68 | ₹35,976 | ₹513,860 | 8.14% |
| 1968–69 | ₹37,938 | ₹527,270 | 2.61% |
| 1969–70 | ₹41,722 | ₹561,630 | 6.52% |
| 1970–71 | ₹44,382 | ₹589,787 | 5.01% |
| 1971–72 | ₹47,221 | ₹595,741 | 1.01% |
| 1972–73 | ₹51,943 | ₹593,843 | −0.32% |
| 1973–74 | ₹63,658 | ₹620,872 | 4.55% |
| 1974–75 | ₹74,930 | ₹628,079 | 1.16% |
| 1975–76 | ₹79,582 | ₹684,634 | 9.00% |
| 1976–77 | ₹85,545 | ₹693,191 | 1.25% |
| 1977–78 | ₹97,633 | ₹744,972 | 7.47% |
| 1978–79 | ₹104,930 | ₹785,965 | 5.50% |
| 1979–80 | ₹114,500 | ₹745,083 | −5.20% |
| 1980–81 | ₹136,838 | ₹798,506 | 7.17% |
| 1981–82 | ₹160,214 | ₹843,426 | 5.63% |
| 1982–83 | ₹178,985 | ₹868,092 | 2.92% |
| 1983–84 | ₹209,356 | ₹936,270 | 7.85% |
| 1984–85 | ₹230,526 | ₹973,357 | 3.96% |
| 1985–86 | ₹262,717 | ₹1,013,866 | 4.16% |
| 1986–87 | ₹292,924 | ₹1,057,612 | 4.31% |
| 1987–88 | ₹332,068 | ₹1,094,993 | 3.53% |
| 1988–89 | ₹396,295 | ₹1,206,243 | 10.16% |
| 1989–90 | ₹456,540 | ₹1,280,228 | 6.13% |
| 1990–91 | ₹531,814 | ₹1,347,889 | 5.29% |
| 1991–92 | ₹613,528 | ₹1,367,171 | 1.43% |
| 1992–93 | ₹703,723 | ₹1,440,504 | 5.36% |
| 1993–94 | ₹805,486 | ₹1,522,344 | 5.68% |
| 1994–95 | ₹955,386 | ₹1,619,694 | 6.39% |
| 1995–96 | ₹1,118,586 | ₹1,737,741 | 7.29% |
| 1996–97 | ₹1,301,788 | ₹1,876,319 | 7.97% |
| 1997–98 | ₹1,447,613 | ₹1,957,032 | 4.30% |
| 1998–99 | ₹1,668,739 | ₹2,087,828 | 6.68% |
| 1999–00 | ₹1,858,205 | ₹2,254,942 | 8.00% |
| 2000–01 | ₹2,000,743 | ₹2,348,481 | 4.15% |
| 2001–02 | ₹2,175,260 | ₹2,474,962 | 5.39% |
| 2002–03 | ₹2,343,864 | ₹2,570,935 | 3.88% |
| 2003–04 | ₹2,625,819 | ₹2,775,749 | 7.97% |
| 2004–05 | ₹2,971,464 | ₹2,971,464 | 7.05% |
| 2005–06 | ₹3,390,503 | ₹3,253,073 | 9.48% |
| 2006–07 | ₹3,953,276 | ₹3,564,364 | 9.57% |
| 2007–08 | ₹4,582,086 | ₹3,896,636 | 9.32% |
| 2008–09 | ₹5,303,567 | ₹4,158,676 | 6.72% |
| 2009–10 | ₹6,108,903 | ₹4,516,071 | 8.59% |
| 2010–11 | ₹7,248,860 | ₹4,918,533 | 8.91% |
| 2011–12 | ₹8,391,691 | ₹5,247,530 | 6.69% |
| 2012–13 | ₹9,388,876 | ₹5,482,111 | 4.47% |
| 2013–14 | ₹10,472,807 | ₹5,741,791 | 4.74% |
See also
- Timeline of the economy of India
- Evolution of corporate social responsibility in India
- History of agriculture in India
- History of banking in India
- History of India
- List of regions by past GDP (PPP)
- List of regions by past GDP (PPP) per capita
- List of countries by past GDP (nominal)
References
- ↑ Baten, Jörg (2016). A History of the Global Economy. From 1500 to the Present. Cambridge University Press. p. 250. ISBN 9781107507180.
- ↑ "The World Economy (GDP) : Historical Statistics by Professor Angus Maddison" (PDF). World Economy. Retrieved 21 May 2013.
- ↑ Maddison, Angus (2006). The World Economy – Volume 1: A Millennial Perspective and Volume 2: Historical Statistics. OECD Publishing by Organisation for Economic Co-operation and Development. p. 656. ISBN 9789264022621.
- ↑ "Power of Data Visualisation".
- 1 2 3 "Economic survey of India 2007: Policy Brief" (PDF). OECD.
- ↑ "Industry passing through phase of transition". The Tribune.
- ↑ Ranjit V. Pandit (2005). "Why believe in India". McKinsey.
- ↑ Marshall, John (1996). Mohenjo-Daro and the Indus Civilization: Being an Official Account of Archaeological Excavations at Mohenjo-Daro Carried Out by the Government of India Between the Years 1922 and 1927. p. 481. ISBN 9788120611795.
- ↑ Chopra, Pran Nath (2003). A Comprehensive History Of Ancient India (3 Vol. Set). Sterling. p. 73. ISBN 9788120725034.
- ↑ Ārya, Samarendra Nārāyaṇa (2004). History of Pilgrimage in Ancient India: Ad 300–1200. Munshiram Manoharlal Publishers Pvt. Limited. p. 3,74.
- ↑ Anekant: Views And Issues (First ed.). Ladnun, India: Jain Vishwa Bharati University, Ladnun, India. 2001. p. 46.
|first1=missing|last1=in Authors list (help) - ↑ Sarien, R. G. (1973). Managerial styles in India: proceedings of a seminar. p. 19.
- ↑ Khanna (2005).
- ↑ Jataka IV.
- ↑ "The Chera Coins". Tamilartsacademy.com. Retrieved 2010-07-28.
- ↑ Ghosh, Amalananda. An Encyclopaedia of Indian Archaeology. BRILL. p. 12. ISBN 9789004092648.
- ↑ Madison, Angus (6 December 2007). Contours of the world economy, 1–2030 AD: essays in macro-economic history. Oxford University Press. p. 379. ISBN 0-19-922720-9.
- ↑ Ratan Lal Basu & Rajkumar Sen, Ancient Indian Economic Thought, Relevance for Today ISBN 81-316-0125-0, Rawat Publications, New Delhi, 2008.
- 1 2 3 Madison, Angus (2006). The world economy, Volumes 1–2. OECD Publishing. p. 638. doi:10.1787/456125276116. ISBN 92-64-02261-9. Retrieved 1 November 2011.
- ↑ Kumar, Dharma and Meghnad Desai, eds. The Cambridge Economic History of India: Volume 2, c.1751-c.1970 (1983).
- ↑ Jan de Vries, "Review," American Historical Review (2012) 117#5 p 1534
- 1 2 3 4 Robb 2004, pp. 131–134
- 1 2 Peers 2006, pp. 48–49
- ↑ Farnie 1979, p. 33
- ↑ Baten, Jörg (2016). A History of the Global Economy. From 1500 to the Present. Cambridge University Press. p. 252. ISBN 9781107507180.
- ↑ Data table in Maddison A (2007), Contours of the World Economy I-2030AD, Oxford University Press, ISBN 978-0199227204
- ↑ Booker, M. Keith (1997). Colonial Power, Colonial Texts: India in the Modern British Novel. University of Michigan. pp. 153–154. ISBN 9780472107803.
- ↑ T.R. Jain; V.K. Ohri. Statistics for Economics and indian economic development. VK publications. p. 15. ISBN 9788190986496.
- ↑ Indrajit Ray, "Identifying the woes of the cotton textile industry in Bengal: Tales of the nineteenth century," Economic History Review, Nov 5896, Vol. 62 Issue 4, pp 857–892
- ↑ Griffin, Emma. "Why was Britain first? The industrial revolution in global context". Retrieved 9 March 2013.
- ↑ Broadberry, Stephen; Gupta, Bishnupriya. "Indian gdp before 1870: some preliminary estimates and a comparison with britain" (PDF). Warwick University. Retrieved 12 October 2015.
- ↑ Hitchcock, John. "POPULATION OF GREAT BRITAIN & IRELAND 1570–1931". GenDocs. Retrieved 12 October 2015.
- ↑ B. R. Tomlinson, The economy of modern India, 1860–1970 (1996)
- ↑ Judith Brown, Modern India: The Origins of an Asian Democracy (Oxford University Press, 1994) p. 12
- ↑ K. A. Manikumar, A colonial economy in the Great Depression, Madras (1929–1937) (2003) p 138-9
- ↑ Dietmar Rothermund, An Economic History of India to 1991 (1993) p 95
- ↑ Omkar Goswami, "Agriculture in Slump: The Peasant Economy of East and North Bengal in the 1930s," Indian Economic & Social History Review, July 1984, Vol. 21 Issue 3, p335-364
- ↑ Colin Simmons, "The Great Depression and Indian Industry: Changing Interpretations and Changing Perceptions," Modern Asian Studies, May 1987, Vol. 21 Issue 3, pp 585–623
- ↑ Dietmar Rothermund, An Economic History of India to 1991 (1993) p 111
- ↑ Dietmar Rothermund, India in the Great Depression, 1929–1939 (New Delhi, 1992).
- ↑ "His Fortune on TIME". Time.com. 19 January 1959. Retrieved 2012-10-16.
- ↑ One-sixth of Indians were urban by 1950
- ↑ Ian J. Kerr (2007). Engines of change: the railroads that made India. Greenwood Publishing Group. ISBN 978-0-275-98564-6.
- ↑ I. D. Derbyshire, "Economic Change and the Railways in North India, 1860–1914," Modern Asian Studies, (1987), 21#3 pp. 521–545 in JSTOR
- 1 2 R.R. Bhandari (2005). Indian Railways: Glorious 150 years. Ministry of Information and Broadcasting, Government of India. pp. 1–19. ISBN 81-230-1254-3.
- ↑ Babu, T. Stanley (2004). "A shining testimony of progress". Indian Railways. Indian Railway Board. p. 101. Missing or empty
|title=(help) - ↑ Thorner, Daniel (2005). "The pattern of railway development in India". In Kerr, Ian J. Railways in Modern India. New Delhi: Oxford University Press. pp. 80–96. ISBN 0-19-567292-5.
- ↑ Hurd, John (2005). "Railways". In Kerr, Ian J. Railways in Modern India. New Delhi: Oxford University Press. pp. 147–172–96. ISBN 0-19-567292-5.
- 1 2 3 R.R. Bhandari (2005). Indian Railways: Glorious 150 years. Ministry of Information and Broadcasting, Government of India. pp. 44–52. ISBN 81-230-1254-3.
- ↑ Daniel R. Headrick, The tentacles of progress: technology transfer in the age of imperialism, 1850–1940, (1988) pp 78–79
- ↑ Awasthi, Aruna (1994). History and development of railways in India. New Delhi: Deep & Deep Publications. pp. 181–246.
- ↑ Daniel R. Headrick, The tentacles of progress: technology transfer in the age of imperialism, 1850–1940, (1988) pp 8–82
- ↑ Wainwright, A. Marin (1994). Inheritance of Empire. Westport, CT: Greenwood Publishing Group. p. 48. ISBN 978-0-275-94733-0.
- ↑ R. O. Christensen, "The State and Indian Railway Performance, 1870–1920: Part I, Financial Efficiency and Standards of Service," Journal of Transport History (Sept. 1981) 2#2, pp. 1–15
- ↑ B. R. Tomlinson, The Economy of Modern India, 1860–1970 (1996) p. 5
- ↑ B. H. Tomlinson, "India and the British Empire, 1880–1935," Indian Economic and Social History Review, (Oct 1975), 12#4 pp 337–380
- ↑ F. H. Brown and B. R. Tomlinson, "Tata, Jamshed Nasarwanji (1839–1904)", in Oxford Dictionary of National Biography (2004) accessed 28 Jan 2012 doi:10.1093/ref:odnb/36421
- ↑ Vinay Bahl, "The Emergence of Large-Scale Steel Industry in India Under British Colonial Rule, 1880–1907," Indian Economic and Social History Review, (Oct 1994) 31#4 pp 413–460
- ↑ Chikayoshi Nomura, "Selling steel in the 1920s: TISCO in a period of transition," Indian Economic and Social History Review (January/March 2011) 48: pp 83–116, doi:10.1177/001946461004800104
- ↑ Vinay Bahl, Making of the Indian Working Class: A Case of the Tata Iron & Steel Company, 1880–1946 (1995)
- ↑ Rajat Kanta Ray, "Indian Society and the Establishment of British Supremacy, 1765–1818," in The Oxford History of the British Empire: vol. 2, The Eighteenth Century" ed. by P. J. Marshall, (1998), pp 508–29
- ↑ P.J. Marshall, "The British in Asia: Trade to Dominion, 1700–1765," in The Oxford History of the British Empire: vol. 2, The Eighteenth Century" ed. by P. J. Marshall, (1998), pp 487–507
- ↑ Redefining The Hindu Rate Of Growth. The Financial Express
- ↑ "Industry passing through phase of transition". The Tribune India.
- ↑ Tripathi, Salil (13 June 2006). "Escaping the 'Hindu rate of growth'". The Guardian. London. Retrieved 4 May 2010.
- ↑ Angus Maddison, The World Economy: A Millennial Perspective (2001) pp 274, 275, 298
- ↑ "One Polity, Many Countries: Economic Growth in India, 1873–2000" (PDF). Retrieved 2012-10-16.
- ↑ Chatterji (2010). The Spoils of Partition. Cambridge University Press. ISBN 9781139468305.
- ↑ Philip A. Lawn; Matthew Clarke (2008). Sustainable Welfare in the Asia-Pacific: Studies Using the Genuine Progress Indicator. p. 195. ISBN 9781847205018.
Despite a considerable improvement in rate of growth of India's real GDP in the 1950s, the performance of the Indian economy did not meet the expectations of India's political leaders.
- ↑ Economics, Business, and the Environment — GDP: GDP per capita, current US dollars
- ↑ see table 16, Appendix
- ↑ A.P. Thakur; Sunil Pandey (2009). 21st Century India: View and Vision. Global Vision Publishing House. p. 52.
- ↑ http://mospi.nic.in/2_macro_agg_curr.pdf
- ↑ ^ Lawrence H. Officer, "Exchange rate between the United States dollar and forty other countries, 1913 -1999." Economic History Services, EH.Net, 2002. URL: http://eh.net/hmit/exchangerates/
- ↑ One-fifth of Indians were urban by 1975
- ↑ Sankar Ghose (1993). Jawaharlal Nehru: A Biography. Allied Publishers. p. 550. ISBN 9788170233695.
- ↑ ^ Lawrence H. Officer, "Exchange rate between the United States dollar and forty other countries, 1913 -1999." Economic History Services, EH.Net, 2002. URL: http://eh.net/hmit/exchangerates/
- ↑ One-fourth of Indians were urban by 2000
- ↑ Isobel Doole; Robin Lowe (2008). International Marketing Strategy: Analysis, Development and Implementation. Cengage Learning EMEA. p. 226.
- ↑ "Govt declares Golden Quadrilateral complete". The Indian Express. 7 January 2012.
- ↑ "National Highways Development Project Map". National Highways Institute of India.
- ↑ Ashutosh Kumar (2013-12-18). "National Highways Authority of India resumes toll road projects with IRB contract | Latest News & Updates at Daily News & Analysis". Dnaindia.com. Retrieved 2014-03-24.
- ↑ "businessanticorruption | Judicial System". Business-anti-corruption.com. Retrieved 2010-07-28.
- ↑ "Rankings – Doing Business – The World Bank Group". Doing Business. Retrieved 2010-07-28.
- ↑ "GDP at Factor Cost" (pdf). report. Planning Commission (Govt. of India). 31 May 2014. Retrieved 6 July 2016.
Bibliography
Pre 1947
- Anstey, Vera. The economic development of India (4th ed. 1952), 677pp; thorough scholarly coverage; focus on 20th century down to 1939
- Bowen, H. V. Business of Empire: The East India Company and Imperial Britain, 1756–1833 (2006), 304pp
- Balachandran, G., ed. India and the World Economy, 1850–1950 Oxford University Press, 2005. ISBN 0-19-567234-8.
- Chaudhuri, K. N.Trade and Civilization in the Indian Ocean: An Economic History from the Rise of Islam to 1750 (1985)
- Derbyshire, I. D. (1987), "Economic Change and the Railways in North India, 1860–1914", Population Studies, 21 (3): 521–545, doi:10.1017/s0026749x00009197, JSTOR 312641
- Dutt, Romesh C. The Economic History of India under early British Rule, first published 1902, 2001 edition by Routledge, ISBN 978-0-415-24493-0
- Farnie, DA (1979), The English Cotton Industry and the World Market, 1815–1896, Oxford, UK: Oxford University Press. Pp. 414, ISBN 0-19-822478-8
- Ludden, David, ed. New Cambridge History of India: An Agrarian History of South Asia (1999).
- Habib, Irfan. Agrarian System of Mughal India (1963, revised edition 1999).
- Habib, Irfan. Atlas of the Mughal Empire: Political and Economic Maps (1982).
- Habib, Irfan. Indian Economy, 1858–1914 (2006).
- Kazanas, Nicholas, Economic principles in the Vedic tradition (2010)
- Kumar, Dharma and Meghnad Desai, eds. The Cambridge Economic History of India: Volume 2, c.1757–2003 (2nd ed. 2005).
- Kumar, Prakash. Indigo Plantations and Science in Colonial India (Cambridge University Press, 2012) 334pp
- Lal, Deepak. The Hindu Equilibrium: India C.1500 B.C.-2000 A.D. (2nd ed. 2005).
- Lockwood, David. ‘’The Indian Bourgeoisie: A Political History of the Indian Capitalist Class in the Early Twentieth Century’’ (I.B. Tauris, 2012) 315 pages; focus on Indian entrepreneurs who benefited from the Raj, but ultimately sided with the Indian National Congress.
- Mahajan, Nupam P. (1999) India's First Coinage. Retrieved 24 Feb 2005.
- Micklethwait, John & Wooldridge, Adrian (2003). The Company: a short history of a revolutionary idea. Modern library chronicles. ISBN 0-679-64249-8.
- Jawaharlal Nehru, The Discovery of India (1946)
- Peers, Douglas M. (2006), India under Colonial Rule 1700–1885, Harlow and London: Pearson Longmans. Pp. xvi, 163, ISBN 978-0582317383.
- Raychaudhuri, Tapan and Irfan Habib, eds. The Cambridge Economic History of India: Volume 1, c. 1200-c. 1750 (1982).
- Roy, Tirthankar. The Economic History of India 1857–1947 (2002, 2006, 2011).
- Roy, Tirthankar. India in the World Economy from Antiquity to the Present (2012).
- Roy, Tirthankar (Summer 2002), "Economic History and Modern India: Redefining the Link", The Journal of Economic Perspectives, American Economic Association, 16 (3): 109–130, doi:10.1257/089533002760278749, JSTOR 3216953
- Simmons, Colin (1985), "'De-Industrialization', Industrialization and the Indian Economy, c. 1850–1947", Modern Asian Studies, 19 (3): 593–622, doi:10.1017/s0026749x00007745, JSTOR 312453
- Tomlinson, B. R. The Economy of Modern India, 1860–1970 (The New Cambridge History of India) (1996) excerpt and text search
- Tomlinson, B. H. "India and the British Empire, 1880–1935," Indian Economic and Social History Review, (Oct 1975), 12#4 pp 337–380
- Max Weber, The Religion of India: The Sociology of Hinduism and Buddhism
Gazetteers and statistics
- The Imperial Gazetteer of India (26 vol, 1908–31), highly detailed description of all of India in 1901. online edition
- Statistical abstract relating to British India, from 1895–96 to 1904–05 (London, 1906) full text online, 278pp
Since 1947
- Bardhan, Pranab. Awakening Giants, Feet of Clay: Assessing the Economic Rise of China and India by (Princeton University Press; 2010) 172 pages;
- Datt, Ruddar & Sundharam, K.P.M. (1965). Indian Economy (51st Revised ed. (2005)). S.Chand. ISBN 81-219-0298-3.
- Das, Gurcharan. India Unbound: The Social and Economic Revolution from Independence to the Global Information Age (2002).
- Frankel, Francine R. India's Political Economy, 1947–1977: The Gradual Revolution (1978).
- Kumar, Dharma and Meghnad Desai, eds. The Cambridge Economic History of India: Volume 2, c.1751-c.1970 (2nd ed. 2005) 1115pp; essays by scholars
- Lal, Deepak. The Hindu Equilibrium: India c.1500 B.C.-2000 A.D. (2nd ed. 2005).
- Larue, C. Steven. The India Handbook (1997) (Regional Handbooks of Economic Development).
- Majumdar, Sumit K. India's Late, Late Industrial Revolution: Democratizing Entrepreneurship (Cambridge University Press; 2012), 426 pages; focus on the entrepreneur-led revolution since 1990
- Myrdal, Gunnar. Asian Drama: An Inquiry into the Poverty of Nations (3 vol, 1968) 2284 pages; also 4th vol. on methodology (1970), focus on India and neighbors; by winner of Nobel prize in economics
- Robb, Peter (2004), A History of India (Palgrave Essential Histories), Houndmills, Hampshire: Palgrave Macmillan. Pp. xiv, 344, ISBN 0-333-69129-6.
- Roy, Tirthankar. Economic History of India 1857–1947 (3d ed., 2011).
- Rudolph, Lloyd I. In Pursuit of Lakshmi: The Political Economy of the Indian State (1987).
- Sabhlok, Sanjeev. Breaking Free of Nehru (2008), Anthem Press. ISBN 978-81-905835-8-9.
- Sankaran, S. Indian Economy: Problems, Policies and Development (Margham Publications, 7th ed. 1994).
- Tomlinson, B. R. et al. The Economy of Modern India, 1860–1970 (1996) (The New Cambridge History of India)
- Ravinder Kaur (2012). "India Inc. and its Moral Discontent". Economic and Political Weekly.
- Wolpert, Stanley, ed. Encyclopedia of India (4 vol. 2005) comprehensive coverage by scholars
External links
- Infographic: Share of world GDP throughout history | Infogram
- Agarwal, Ankit. (2012), "Development of Economic Organizations and their Role in Human Empowerment during the Gupta Period", History Today 13, New delhi, ISSN 2249-748X.
- Khanna, Vikramaditya S. (2005). The Economic History of the Corporate Form in Ancient India. University of Michigan.
- Pearce, H. Thomas (Spring 2003). Weber's study of the Hindu ethic and the caste system.
- "Manmohan Singh's address at the Oxford in July 2005". The Hindu. Chennai, India. 10 July 2005. Retrieved 10 December 2005.
- Limca Book of Records (1993). Bisleri Beverages Limited. ISBN 81-900115-6-1.
- Economic History of India Precolonial times to present.
- The IMF database.
-
 This article incorporates public domain material from the Library of Congress Country Studies website http://lcweb2.loc.gov/frd/cs/.
| |||||||||||||||||||||||||||||||||
| |||||||||||||||||||||||||||||||||
| |||||||||||||||||||||||||||||||||
| |||||||||||||||||||||||||||||||||
| Companies |
|
|---|---|
| Governance |
|
| Currency | |
| Financial services | |
| History | |
| People |
|
| States | |
| Sectors | |
| |