United States presidential election in Minnesota, 2004
| | ||||||||||||||||||||||||||||||||
| ||||||||||||||||||||||||||||||||
| ||||||||||||||||||||||||||||||||
|
| ||||||||||||||||||||||||||||||||
| County Results
Kerry—60-70%
Kerry—50-60%
Kerry—<50%
Bush—<50%
Bush—50-60%
Bush—60-70% | ||||||||||||||||||||||||||||||||
| ||||||||||||||||||||||||||||||||
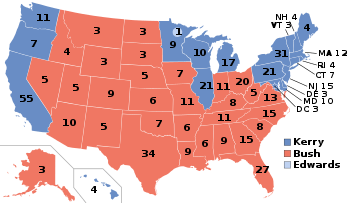
The 2004 United States presidential election in Minnesota took place on November 2, 2004 throughout all 50 states and the District of Columbia, which was part of the 2004 U.S. presidential election. Voters chose 10 representatives, or electors to the Electoral College, who voted for President and Vice President.
Minnesota was won by Democrat nominee John Kerry by a 3.5% margin of victory. Prior to the election, most news organizations considered it as a major swing state in 2004 based on pre-election polling. The state is historically a blue state, as the last Republican to carry the state in a presidential election was Richard Nixon in 1972. However, in 2000 Al Gore carried the state with just 48% of the vote, by a margin of just 2.5%. In 2004, Minnesota was the only state to split its electoral votes, as a faithless elector pledged to Kerry cast a ballot for John R. Edwards, his running mate.
Primaries
- Minnesota Democratic primary, 2004
Campaign
Predictions
There were 12 news organizations who made state by state predictions of the election. Here are their last predictions before election day.[1]
- D.C. Political Report: Slight Democrat
- Associated Press: Leans Kerry
- CNN: Kerry
- Cook Political Report: Toss Up
- Newsweek: Toss Up
- New York Times: Toss Up
- Rasmussen Reports: Toss Up
- Research 2000: Lean Kerry
- Washington Post: Battleground
- Washington Times: Battleground
- Zogby International: Kerry
- Washington Dispatch: Kerry
Polling
Minnesota was considered a swing state based on its tight poll numbers. In early 2004, Kerry was leading in every poll against Bush, sometimes even reaching 50%. However, in the summer, Kerry was still leading in most of the polls but the gap was very small. It wasn't until late October when Bush was leading him. In the last poll by Rasmussen Reports, Kerry won with 48% to 47%, but left a lot of undecided voters. In the last 3 polling average, Kerry lead 49% to 47%, but with Bush winning 2 of 3.[2] The last poll average by Real Clear Politics showed Kerry leading 49% to 45%.[3] Overall polls showed a lot of undecided voters. On election day, Kerry won with 51% of the vote.
Fundraising
Bush raised $2,507,181.[4] Kerry raised $2,635,150.[5]
Advertising and visits
Both tickets visited the state 7 times.[6] A total of $1 million to $3 million was spent each week.[7]
Analysis
Minnesota is the most consistent blue state in the nation, giving a Democrat its electors in presidential elections since 1976, even in Ronald Reagan's landslide victories. Although in 2000, Al Gore won Minnesota with barely 48% of the vote. Richard Nixon is the last Republican to carry the state in a presidential election. Nixon carried the state in the 1972 election with just 52% of the vote, his second weakest performance in the nation. Only in Massachusetts did Nixon perform weaker as he obtained just 45% in the only state he lost that election.
In 2004, the county results were fairly uniform across the state; only a handful of counties had either Bush or Kerry getting over 60% of the vote, and no county had either candidate with over 70% of the vote. Despite winning the state, Kerry won just three of eight congressional districts: Minnesota's 4th congressional district, Minnesota's 5th congressional district, and Minnesota's 8th congressional district.
Results
| United States presidential election in Minnesota, 2004 | |||||
|---|---|---|---|---|---|
| Party | Candidate | Votes | Percentage | Electoral votes | |
| Democratic Party | John Kerry | 1,445,014 | 51.09% | 9 | |
| Republican Party | George W. Bush (Inc.) | 1,346,695 | 47.61% | 0 | |
| Independent | Ralph Nader | 18,683 | 0.66% | 0 | |
| Libertarian Party | Michael Badnarik | 4,639 | 0.16% | 0 | |
| Green Party | David Cobb | 4,408 | 0.16% | 0 | |
| Constitution Party | Michael Peroutka | 3,074 | 0.11% | 0 | |
| Independent | Write Ins | 2,530 | 0.09% | 0 | |
| Christian Freedom Party | Thomas Harens | 2,387 | 0.08% | 0 | |
| Socialist Equality Party | Bill Van Auken | 539 | 0.02% | 0 | |
| Socialist Workers Party | Roger Calero | 416 | 0.01% | 0 | |
| Socialist Party USA (Write-in) | Walt Brown (Write-in) | 2 | 0.00% | 0 | |
| Democratic Party | John Edwards | 0 | 0.00% | 1 | |
| Totals | 2,828,387 | 100.00% | 10 | ||
| Voter Turnout (Voting Age Population) | 74.2% | ||||
Results breakdown
By county
| County | Kerry% | Kerry# | Bush% | Bush# | Others% | Others# |
|---|---|---|---|---|---|---|
| Aitkin | 48.0% | 4,539 | 50.4% | 4,768 | 1.5% | 145 |
| Anoka | 46.1% | 80,226 | 52.8% | 91,853 | 1.1% | 1,987 |
| Becker | 40.2% | 6,756 | 58.3% | 9,795 | 1.5% | 250 |
| Beltrami | 50.1% | 10,592 | 48.4% | 10,237 | 1.4% | 302 |
| Benton | 43.8% | 8,059 | 54.6% | 10,043 | 1.5% | 282 |
| Big Stone | 50.1% | 1,536 | 48.4% | 1,483 | 1.6% | 48 |
| Blue Earth | 50.9% | 16,865 | 47.5% | 15,737 | 1.6% | 517 |
| Brown | 37.4% | 5,158 | 60.8% | 8,395 | 1.6% | 225 |
| Carlton | 62.5% | 11,462 | 36.2% | 6,642 | 1.3% | 230 |
| Carver | 36.2% | 16,456 | 62.8% | 28,510 | 1.0% | 445 |
| Cass | 43.0% | 6,835 | 55.8% | 8,875 | 1.3% | 200 |
| Chippewa | 51.8% | 3,424 | 46.8% | 3,089 | 1.4% | 93 |
| Chisago | 43.2% | 12,219 | 55.6% | 15,705 | 1.2% | 336 |
| Clay | 46.8% | 12,989 | 51.8% | 14,365 | 1.4% | 383 |
| Clearwater | 42.9% | 1,871 | 55.9% | 2,438 | 1.2% | 52 |
| Cook | 52.5% | 1,733 | 45.1% | 1,489 | 2.5% | 81 |
| Cottonwood | 42.8% | 2,726 | 55.8% | 3,557 | 1.4% | 86 |
| Crow Wing | 41.7% | 14,005 | 57.0% | 19,106 | 1.3% | 434 |
| Dakota | 48.5% | 104,635 | 50.5% | 108,959 | 1.0% | 2,252 |
| Dodge | 41.7% | 4,117 | 56.7% | 5,593 | 1.6% | 158 |
| Douglas | 40.5% | 8,219 | 58.1% | 11,793 | 1.5% | 297 |
| Faribault | 43.4% | 3,767 | 55.2% | 4,794 | 1.4% | 120 |
| Fillmore | 49.8% | 5,825 | 48.7% | 5,694 | 1.5% | 179 |
| Freeborn | 55.1% | 9,733 | 43.5% | 7,681 | 1.4% | 252 |
| Goodhue | 47.3% | 12,103 | 51.3% | 13,134 | 1.4% | 371 |
| Grant | 48.6% | 1,856 | 49.6% | 1,893 | 1.8% | 70 |
| Hennepin | 59.3% | 383,841 | 39.4% | 255,133 | 1.2% | 8,007 |
| Houston | 47.6% | 5,276 | 50.8% | 5,631 | 1.6% | 175 |
| Hubbard | 41.8% | 4,741 | 56.8% | 6,444 | 1.4% | 155 |
| Isanti | 40.8% | 7,883 | 57.9% | 11,190 | 1.2% | 240 |
| Itasca | 54.5% | 13,290 | 43.9% | 10,705 | 1.5% | 372 |
| Jackson | 45.9% | 2,652 | 52.3% | 3,024 | 1.8% | 103 |
| Kanabec | 43.5% | 3,592 | 54.9% | 4,527 | 1.6% | 129 |
| Kandiyohi | 43.7% | 9,337 | 54.8% | 11,704 | 1.4% | 308 |
| Kittson | 49.7% | 1,333 | 48.7% | 1,307 | 1.6% | 42 |
| Koochiching | 50.1% | 3,662 | 48.4% | 3,539 | 1.5% | 108 |
| La Qui Parle | 52.6% | 2,390 | 46.1% | 2,093 | 1.3% | 58 |
| Lake | 59.6% | 4,212 | 39.2% | 2,769 | 1.3% | 90 |
| Lake of the Woods | 38.4% | 921 | 59.5% | 1,428 | 2.1% | 51 |
| Le Sueur | 44.8% | 6,466 | 53.7% | 7,746 | 1.5% | 212 |
| Lincoln | 46.6% | 1,558 | 51.9% | 1,736 | 1.4% | 48 |
| Lyon | 41.8% | 5,292 | 56.8% | 7,203 | 1.4% | 178 |
| McLeod | 36.5% | 6,712 | 62.0% | 11,407 | 1.6% | 293 |
| Mahnomen | 53.4% | 1,339 | 45.1% | 1,132 | 1.5% | 37 |
| Marshall | 41.5% | 2,308 | 57.3% | 3,187 | 1.2% | 67 |
| Martin | 41.5% | 4,590 | 57.1% | 6,311 | 1.3% | 146 |
| Meeker | 42.9% | 5,292 | 55.6% | 6,854 | 1.5% | 188 |
| Mille Lacs | 43.5% | 5,677 | 55.1% | 7,194 | 1.5% | 194 |
| Morrison | 40.5% | 6,794 | 57.9% | 9,698 | 1.6% | 266 |
| Mower | 61.0% | 12,334 | 37.5% | 7,591 | 1.5% | 297 |
| Murray | 44.4% | 2,218 | 54.4% | 2,719 | 1.2% | 61 |
| Nicollet | 49.6% | 8,797 | 49.0% | 8,689 | 1.4% | 255 |
| Nobles | 42.4% | 3,898 | 56.1% | 5,159 | 1.6% | 147 |
| Norman | 51.3% | 1,954 | 47.1% | 1,794 | 1.6% | 62 |
| Olmsted | 46.5% | 33,285 | 52.2% | 37,371 | 1.3% | 919 |
| Otter Tail | 37.4% | 12,038 | 61.3% | 19,734 | 1.3% | 406 |
| Pennington | 44.4% | 3,117 | 53.7% | 3,767 | 1.9% | 133 |
| Pine | 49.8% | 7,228 | 48.4% | 7,033 | 1.8% | 257 |
| Pipestone | 37.8% | 1,900 | 60.9% | 3,066 | 1.3% | 66 |
| Polk | 42.9% | 6,729 | 55.7% | 8,724 | 1.4% | 215 |
| Pope | 49.3% | 3,301 | 49.3% | 3,303 | 1.4% | 96 |
| Ramsey | 63.0% | 171,846 | 35.6% | 97,096 | 1.3% | 3,635 |
| Red Lake | 44.2% | 963 | 53.5% | 1,164 | 2.3% | 50 |
| Redwood | 38.1% | 3,104 | 60.2% | 4,898 | 1.7% | 137 |
| Renville | 45.4% | 3,787 | 53.1% | 4,430 | 1.6% | 132 |
| Rice | 53.4% | 16,425 | 45.1% | 13,881 | 1.4% | 439 |
| Rock | 38.5% | 2,000 | 59.9% | 3,111 | 1.5% | 80 |
| Roseau | 30.9% | 2,442 | 67.7% | 5,355 | 1.4% | 114 |
| St. Louis | 65.2% | 77,958 | 33.5% | 40,112 | 1.3% | 1,495 |
| Scott | 39.5% | 23,958 | 59.5% | 36,055 | 1.0% | 626 |
| Sherburne | 38.2% | 15,816 | 60.7% | 25,182 | 1.1% | 456 |
| Sibley | 39.1% | 3,109 | 58.7% | 4,669 | 2.2% | 171 |
| Stearns | 43.2% | 32,659 | 55.2% | 41,726 | 1.6% | 1,192 |
| Steele | 42.8% | 7,994 | 55.6% | 10,389 | 1.7% | 312 |
| Stevens | 47.4% | 2,821 | 50.9% | 3,030 | 1.6% | 98 |
| Swift | 55.2% | 3,165 | 43.3% | 2,481 | 1.6% | 89 |
| Todd | 41.2% | 5,034 | 56.9% | 6,945 | 1.9% | 235 |
| Traverse | 47.9% | 1,026 | 50.3% | 1,076 | 1.8% | 39 |
| Wabasha | 46.9% | 5,548 | 51.7% | 6,120 | 1.4% | 167 |
| Wadena | 39.3% | 2,791 | 59.4% | 4,214 | 1.2% | 88 |
| Waseca | 42.6% | 4,179 | 55.7% | 5,457 | 1.7% | 164 |
| Washington | 47.8% | 61,395 | 51.2% | 65,751 | 1.0% | 1,303 |
| Watonwan | 45.0% | 2,514 | 53.2% | 2,970 | 1.8% | 99 |
| Wilkin | 33.1% | 1,169 | 65.3% | 2,303 | 1.6% | 55 |
| Winona | 51.9% | 14,231 | 46.3% | 12,686 | 1.8% | 505 |
| Wright | 38.0% | 22,618 | 60.8% | 36,176 | 1.2% | 740 |
| Yellow Medicine | 48.6% | 2,799 | 50.0% | 2,878 | 1.4% | 81 |
By congressional district
Bush won 5 of 8 congressional districts.[8]
| District | Bush | Kerry | Representative |
|---|---|---|---|
| 1st | 51% | 47% | Gil Gutknecht |
| 2nd | 54% | 45% | John Kline |
| 3rd | 51% | 48% | Jim Ramstad |
| 4th | 37% | 62% | Betty McCollum |
| 5th | 28% | 71% | Martin Olav Sabo |
| 6th | 57% | 42% | Mark Kennedy |
| 7th | 55% | 43% | Collin Peterson |
| 8th | 46% | 53% | Jim Oberstar |
Electors
Technically the voters of Minnesota cast their ballots for electors: representatives to the Electoral College. Minnesota is allocated 10 electors because it has 8 congressional districts and 2 senators. All candidates who appear on the ballot or qualify to receive write-in votes must submit a list of 10 electors, who pledge to vote for their candidate and his or her running mate. Whoever wins the majority of votes in the state is awarded all 10 electoral votes. Their chosen electors then vote for President and Vice President. Although electors are pledged to their candidate and running mate, they are not obligated to vote for them. An elector who votes for someone other than his or her candidate is known as a faithless elector.
The electors of each state and the District of Columbia met on December 13, 2000 to cast their votes for President and Vice President. The Electoral College itself never meets as one body. Instead the electors from each state and the District of Columbia met in their respective capitols.
The following were the members of the Electoral College from the state. Nine were pledged for Kerry/Edwards, but one made a mistake and ended up voting for Edwards/Edwards, and thus became a faithless elector. Minnesota's electors cast secret ballots, so unless one of the electors claims responsibility, it is unlikely that the identity of the faithless elector will ever be known. As a result of this incident, Minnesota Statutes were amended to provide for public balloting of the electors' votes and invalidation of a vote cast for someone other than the candidate to whom the elector is pledged.[9]
- Sonja Berg
- Vi Grooms-Alban
- Matthew Little
- Michael Meuers
- Tim O'Brien
- Lil Ortendahl
- Everett Pettiford
- Jean Schiebel
- Frank Simon
- Chandler Harrison Stevens
Notes
- ↑ Although John Kerry won Minnesota's 10 electoral votes, 1 faithless elector voted for John Edwards instead of Kerry
References
- ↑ http://www.dcpoliticalreport.com/members/2004/Pred2.htm#NW[]
- ↑ http://uselectionatlas.org/USPRESIDENT/GENERAL/CAMPAIGN/2004/polls.php?fips=27
- ↑ http://www.realclearpolitics.com/Presidential_04/mn_polls.html
- ↑ http://www.campaignmoney.com/political/campaigns/george_w_bush.asp?cycle=04
- ↑ http://www.campaignmoney.com/political/campaigns/john_f_kerry.asp?cycle=04
- ↑ "CNN.com Specials". CNN.
- ↑ "CNN.com Specials". CNN.
- ↑ http://www.swingstateproject.com/diary/4161/
- ↑ "208.08, 2008 Minnesota Statutes". Revisor.leg.state.mn.us. Retrieved 2009-05-05.


