Cross-validation (statistics)
Cross-validation, sometimes called rotation estimation,[1][2][3] is a model validation technique for assessing how the results of a statistical analysis will generalize to an independent data set. It is mainly used in settings where the goal is prediction, and one wants to estimate how accurately a predictive model will perform in practice. In a prediction problem, a model is usually given a dataset of known data on which training is run (training dataset), and a dataset of unknown data (or first seen data) against which the model is tested (testing dataset).[4] The goal of cross validation is to define a dataset to "test" the model in the training phase (i.e., the validation dataset), in order to limit problems like overfitting, give an insight on how the model will generalize to an independent dataset (i.e., an unknown dataset, for instance from a real problem), etc.
One round of cross-validation involves partitioning a sample of data into complementary subsets, performing the analysis on one subset (called the training set), and validating the analysis on the other subset (called the validation set or testing set). To reduce variability, multiple rounds of cross-validation are performed using different partitions, and the validation results are averaged over the rounds.
One of the main reasons for using cross-validation instead of using the conventional validation (e.g. partitioning the data set into two sets of 70% for training and 30% for test) is that there is not enough data available to partition it into separate training and test sets without losing significant modelling or testing capability. In these cases, a fair way to properly estimate model prediction performance is to use cross-validation as a powerful general technique.[5]
In summary, cross-validation combines (averages) measures of fit (prediction error) to derive a more accurate estimate of model prediction performance.[5]
Purpose of cross-validation
Suppose we have a model with one or more unknown parameters, and a data set to which the model can be fit (the training data set). The fitting process optimizes the model parameters to make the model fit the training data as well as possible. If we then take an independent sample of validation data from the same population as the training data, it will generally turn out that the model does not fit the validation data as well as it fits the training data. This is called overfitting, and is particularly likely to happen when the size of the training data set is small, or when the number of parameters in the model is large. Cross-validation is a way to predict the fit of a model to a hypothetical validation set when an explicit validation set is not available.
Linear regression provides a simple illustration of overfitting. In linear regression we have real response values y1, ..., yn, and n p-dimensional vector covariates x1, ..., xn. The components of the vectors xi are denoted xi1, ..., xip. If we use least squares to fit a function in the form of a hyperplane y = a + βTx to the data (xi, yi)1≤i≤n, we could then assess the fit using the mean squared error (MSE). The MSE for given estimated parameter values a and β on the training set (xi, yi)1≤i≤n is

If the model is correctly specified, it can be shown under mild assumptions that the expected value of the MSE for the training set is (n − p − 1)/(n + p + 1) < 1 times the expected value of the MSE for the validation set (the expected value is taken over the distribution of training sets). Thus if we fit the model and compute the MSE on the training set, we will get an optimistically biased assessment of how well the model will fit an independent data set. This biased estimate is called the in-sample estimate of the fit, whereas the cross-validation estimate is an out-of-sample estimate.
Since in linear regression it is possible to directly compute the factor (n − p − 1)/(n + p + 1) by which the training MSE underestimates the validation MSE, cross-validation is not practically useful in that setting (however, cross-validation remains useful in the context of linear regression in that it can be used to select an optimally regularized cost function). In most other regression procedures (e.g. logistic regression), there is no simple formula to make such an adjustment. Cross-validation is, thus, a generally applicable way to predict the performance of a model on a validation set using computation in place of mathematical analysis.
Common types of cross-validation
Two types of cross-validation can be distinguished, exhaustive and non-exhaustive cross-validation.
Exhaustive cross-validation
Exhaustive cross-validation methods are cross-validation methods which learn and test on all possible ways to divide the original sample into a training and a validation set.
Leave-p-out cross-validation
Leave-p-out cross-validation (LpO CV) involves using p observations as the validation set and the remaining observations as the training set. This is repeated on all ways to cut the original sample on a validation set of p observations and a training set.
LpO cross-validation requires to learn and validate times, where n is the number of observations in the original sample and is the binomial coefficient. For p > 1 and n even moderately large, LpO can become impossible to calculate. For example, with n = 100 and p = 30 = 30 percent of 100 (as suggested above),


Leave-one-out cross-validation
Leave-one-out cross-validation (LOOCV) is a particular case of leave-p-out cross-validation with p = 1. The process looks similar to jackknife, however with cross-validation you compute a statistic on the left-out sample(s), while with jackknifing you compute a statistic from the kept samples only.
LOO cross-validation does not have the same problem of excessive compute time as general LpO cross-validation because .

Non-exhaustive cross-validation
Non-exhaustive cross validation methods do not compute all ways of splitting the original sample. Those methods are approximations of leave-p-out cross-validation.
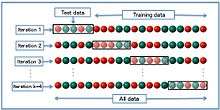
k-fold cross-validation
In k-fold cross-validation, the original sample is randomly partitioned into k equal sized subsamples. Of the k subsamples, a single subsample is retained as the validation data for testing the model, and the remaining k − 1 subsamples are used as training data. The cross-validation process is then repeated k times (the folds), with each of the k subsamples used exactly once as the validation data. The k results from the folds can then be averaged to produce a single estimation. The advantage of this method over repeated random sub-sampling (see below) is that all observations are used for both training and validation, and each observation is used for validation exactly once. 10-fold cross-validation is commonly used,[6] but in general k remains an unfixed parameter.
When k = n (the number of observations), the k-fold cross-validation is exactly the leave-one-out cross-validation.
In stratified k-fold cross-validation, the folds are selected so that the mean response value is approximately equal in all the folds. In the case of a dichotomous classification, this means that each fold contains roughly the same proportions of the two types of class labels.
2-fold cross-validation
This is the simplest variation of k-fold cross-validation, which is also called the holdout method.[7] For each fold, we randomly assign data points to two sets d0 and d1, so that both sets are equal size (this is usually implemented by shuffling the data array and then splitting it in two). We then train on d0 and test on d1, followed by training on d1 and testing on d0.
This has the advantage that our training and test sets are both large, and each data point is used for both training and validation on each fold.
Repeated random sub-sampling validation
This method, also known as Monte Carlo cross-validation,[8] randomly splits the dataset into training and validation data. For each such split, the model is fit to the training data, and predictive accuracy is assessed using the validation data. The results are then averaged over the splits. The advantage of this method (over k-fold cross validation) is that the proportion of the training/validation split is not dependent on the number of iterations (folds). The disadvantage of this method is that some observations may never be selected in the validation subsample, whereas others may be selected more than once. In other words, validation subsets may overlap. This method also exhibits Monte Carlo variation, meaning that the results will vary if the analysis is repeated with different random splits.
As the number of random splits approaches infinity, the result of repeated random sub-sampling validation tends towards that of leave-p-out cross-validation.
In a stratified variant of this approach, the random samples are generated in such a way that the mean response value (i.e. the dependent variable in the regression) is equal in the training and testing sets. This is particularly useful if the responses are dichotomous with an unbalanced representation of the two response values in the data.
Measures of fit
The goal of cross-validation is to estimate the expected level of fit of a model to a data set that is independent of the data that were used to train the model. It can be used to estimate any quantitative measure of fit that is appropriate for the data and model. For example, for binary classification problems, each case in the validation set is either predicted correctly or incorrectly. In this situation the misclassification error rate can be used to summarize the fit, although other measures like positive predictive value could also be used. When the value being predicted is continuously distributed, the mean squared error, root mean squared error or median absolute deviation could be used to summarize the errors.
Applications
Cross-validation can be used to compare the performances of different predictive modeling procedures. For example, suppose we are interested in optical character recognition, and we are considering using either support vector machines (SVM) or k nearest neighbors (KNN) to predict the true character from an image of a handwritten character. Using cross-validation, we could objectively compare these two methods in terms of their respective fractions of misclassified characters. If we simply compared the methods based on their in-sample error rates, the KNN method would likely appear to perform better, since it is more flexible and hence more prone to overfitting compared to the SVM method.
Cross-validation can also be used in variable selection.[9] Suppose we are using the expression levels of 20 proteins to predict whether a cancer patient will respond to a drug. A practical goal would be to determine which subset of the 20 features should be used to produce the best predictive model. For most modeling procedures, if we compare feature subsets using the in-sample error rates, the best performance will occur when all 20 features are used. However under cross-validation, the model with the best fit will generally include only a subset of the features that are deemed truly informative.
Statistical properties
Suppose we choose a measure of fit F, and use cross-validation to produce an estimate F* of the expected fit EF of a model to an independent data set drawn from the same population as the training data. If we imagine sampling multiple independent training sets following the same distribution, the resulting values for F* will vary. The statistical properties of F* result from this variation.
The cross-validation estimator F* is very nearly unbiased for EF . The reason that it is slightly biased is that the training set in cross-validation is slightly smaller than the actual data set (e.g. for LOOCV the training set size is n − 1 when there are n observed cases). In nearly all situations, the effect of this bias will be conservative in that the estimated fit will be slightly biased in the direction suggesting a poorer fit. In practice, this bias is rarely a concern.
The variance of F* can be large.[10][11] For this reason, if two statistical procedures are compared based on the results of cross-validation, it is important to note that the procedure with the better estimated performance may not actually be the better of the two procedures (i.e. it may not have the better value of EF). Some progress has been made on constructing confidence intervals around cross-validation estimates,[10] but this is considered a difficult problem.
Computational issues
Most forms of cross-validation are straightforward to implement as long as an implementation of the prediction method being studied is available. In particular, the prediction method can be a "black box" – there is no need to have access to the internals of its implementation. If the prediction method is expensive to train, cross-validation can be very slow since the training must be carried out repeatedly. In some cases such as least squares and kernel regression, cross-validation can be sped up significantly by pre-computing certain values that are needed repeatedly in the training, or by using fast "updating rules" such as the Sherman–Morrison formula. However one must be careful to preserve the "total blinding" of the validation set from the training procedure, otherwise bias may result. An extreme example of accelerating cross-validation occurs in linear regression, where the results of cross-validation have a closed-form expression known as the prediction residual error sum of squares (PRESS).
Limitations and misuse
Cross-validation only yields meaningful results if the validation set and training set are drawn from the same population and only if human biases are controlled.
In many applications of predictive modeling, the structure of the system being studied evolves over time. Both of these can introduce systematic differences between the training and validation sets. For example, if a model for predicting stock values is trained on data for a certain five-year period, it is unrealistic to treat the subsequent five-year period as a draw from the same population. As another example, suppose a model is developed to predict an individual's risk for being diagnosed with a particular disease within the next year. If the model is trained using data from a study involving only a specific population group (e.g. young people or males), but is then applied to the general population, the cross-validation results from the training set could differ greatly from the actual predictive performance.
In many applications, models also may be incorrectly specified and vary as a function of modeler biases and/or arbitrary choices. When this occurs, there may be an illusion that the system changes in external samples, whereas the reason is that the model has missed a critical predictor and/or included a confounded predictor. New evidence is that cross-validation by itself is not very predictive of external validity, whereas a form of experimental validation known as swap sampling that does control for human bias can be much more predictive of external validity.[12] As defined by this large MAQC-II study across 30,000 models, swap sampling incorporates cross-validation in the sense that predictions are tested across independent training and validation samples. Yet, models are also developed across these independent samples and by modelers who are blinded to one another. When there is a mismatch in these models developed across these swapped training and validation samples as happens quite frequently, MAQC-II shows that this will be much more predictive of poor external predictive validity than traditional cross-validation.
The reason for the success of the swapped sampling is a built-in control for human biases in model building. In addition to placing too much faith in predictions that may vary across modelers and lead to poor external validity due to these confounding modeler effects, these are some other ways that cross-validation can be misused:
- By performing an initial analysis to identify the most informative features using the entire data set – if feature selection or model tuning is required by the modeling procedure, this must be repeated on every training set. Otherwise, predictions will certainly be upwardly biased.[13] If cross-validation is used to decide which features to use, an inner cross-validation to carry out the feature selection on every training set must be performed.[14]
- By allowing some of the training data to also be included in the test set – this can happen due to "twinning" in the data set, whereby some exactly identical or nearly identical samples are present in the data set. Note that to some extent twinning always takes place even in perfectly independent training and validation samples. This is because some of the training sample observations will have nearly identical values of predictors as validation sample observations. And some of these will correlate with a target at better than chance levels in the same direction in both training and validation when they are actually driven by confounded predictors with poor external validity. If such a cross-validated model is selected from a k-fold set, human confirmation bias will be at work and determine that such a model has been validated. This is why traditional cross-validation needs to be supplemented with controls for human bias and confounded model specification like swap sampling and prospective studies.
Cross validation for time-series models
Since the order of the data is important, cross-validation might be problematic for Time-series models. A more appropriate approach might be to use forward chaining.
See also
| Wikimedia Commons has media related to Cross-validation (statistics). |
- Boosting (machine learning)
- Bootstrap aggregating (bagging)
- Bootstrapping (statistics)
- Model selection
- Resampling (statistics)
- Stability (learning theory)
- Validity (statistics)
Notes and references
- ↑ Geisser, Seymour (1993). Predictive Inference. New York, NY: Chapman and Hall. ISBN 0-412-03471-9.
- ↑ Kohavi, Ron (1995). "A study of cross-validation and bootstrap for accuracy estimation and model selection". Proceedings of the Fourteenth International Joint Conference on Artificial Intelligence. San Mateo, CA: Morgan Kaufmann. 2 (12): 1137–1143. CiteSeerX 10.1.1.48.529
 .
. - ↑ Devijver, Pierre A.; Kittler, Josef (1982). Pattern Recognition: A Statistical Approach. London, GB: Prentice-Hall.
- ↑ "Newbie question: Confused about train, validation and test data!". Retrieved 2013-11-14.
- 1 2 Grossman,, Robert; Seni, Giovanni; Elder, John; Agarwal, Nitin; Liu, Huan (2010). Ensemble Methods in Data Mining: Improving Accuracy Through Combining Predictions. Morgan & Claypool. doi:10.2200/S00240ED1V01Y200912DMK002.
- ↑ McLachlan, Geoffrey J.; Do, Kim-Anh; Ambroise, Christophe (2004). Analyzing microarray gene expression data. Wiley.
- ↑ "Cross Validation". Retrieved 11 November 2012.
- ↑ Dubitzky,, Werner; Granzow, Martin; Berrar, Daniel (2007). Fundamentals of data mining in genomics and proteomics. Springer Science & Business Media. p. 178.
- ↑ Picard, Richard; Cook, Dennis (1984). "Cross-Validation of Regression Models". Journal of the American Statistical Association. 79 (387): 575–583. doi:10.2307/2288403. JSTOR 2288403.
- 1 2 Efron, Bradley; Tibshirani, Robert (1997). "Improvements on cross-validation: The .632 + Bootstrap Method". Journal of the American Statistical Association. 92 (438): 548–560. doi:10.2307/2965703. JSTOR 2965703. MR 1467848.
- ↑ Stone, Mervyn (1977). "Asymptotics for and against cross-validation". Biometrika. 64 (1): 29–35. doi:10.1093/biomet/64.1.29. JSTOR 2335766. MR 0474601.
- ↑ Consortium, MAQC (2010). "The Microarray Quality Control (MAQC)-II study of common practices for the development and validation of microarray-based predictive models". Nature Biotechnology. London: Nature Publishing Group. 28: 827–838. doi:10.1038/nbt.1665.
- ↑ Bermingham, Mairead L.; Pong-Wong, Ricardo; Spiliopoulou, Athina; Hayward, Caroline; Rudan, Igor; Campbell, Harry; Wright, Alan F.; Wilson, James F.; Agakov, Felix; Navarro, Pau; Haley, Chris S. (2015). "Application of high-dimensional feature selection: evaluation for genomic prediction in man". Sci. Rep. 5.
- ↑ Varma, Sudhir; Simon, Richard (2006). "Bias in error estimation when using cross-validation for model selection". BMC Bioinformatics. 7: 91. doi:10.1186/1471-2105-7-91. PMC 1397873. PMID 16504092.
| |||||||||||||||||||||||||||||||||||||||||||||
| |||||||||||||||||||||||||||||||||||||||||||||
| |||||||||||||||||||||||||||||||||||||||||||||
| |||||||||||||||||||||||||||||||||||||||||||||
| |||||||||||||||||||||||||||||||||||||||||||||
| |||||||||||||||||||||||||||||||||||||||||||||
| |||||||||||||||||||||||||||||||||||||||||||||