General linear model
| Part of a series on Statistics |
| Regression analysis |
|---|
 |
| Models |
| Estimation |
| Background |
|
The general linear model is a statistical linear model. It may be written as[1]
where Y is a matrix with series of multivariate measurements, X is a matrix that might be a design matrix, B is a matrix containing parameters that are usually to be estimated and U is a matrix containing errors or noise. The errors are usually assumed to be uncorrelated across measurements, and follow a multivariate normal distribution. If the errors do not follow a multivariate normal distribution, generalized linear models may be used to relax assumptions about Y and U.
The general linear model incorporates a number of different statistical models: ANOVA, ANCOVA, MANOVA, MANCOVA, ordinary linear regression, t-test and F-test. The general linear model is a generalization of multiple linear regression model to the case of more than one dependent variable. If Y, B, and U were column vectors, the matrix equation above would represent multiple linear regression.
Hypothesis tests with the general linear model can be made in two ways: multivariate or as several independent univariate tests. In multivariate tests the columns of Y are tested together, whereas in univariate tests the columns of Y are tested independently, i.e., as multiple univariate tests with the same design matrix.
Multiple linear regression
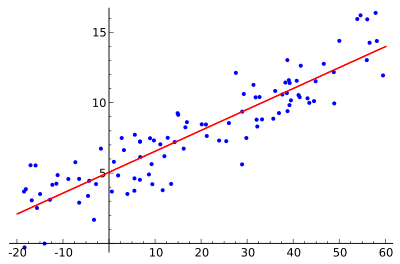
Multiple linear regression is a generalization of linear regression by considering more than one independent variable, and a specific case of general linear models formed by restricting the number of dependent variables to one. The basic model for linear regression is
In the formula above we consider n observations of one dependent variable and p independent variables. Thus, Yi is the ith observation of the dependent variable, Xij is ith observation of the jth independent variable, j = 1, 2, ..., p. The values βj represent parameters to be estimated, and εi is the ith independent identically distributed normal error.
Applications
An application of the general linear model appears in the analysis of multiple brain scans in scientific experiments where Y contains data from brain scanners, X contains experimental design variables and confounds. It is usually tested in a univariate way (usually referred to a mass-univariate in this setting) and is often referred to as statistical parametric mapping.[2]
See also
Notes
- ↑ K. V. Mardia, J. T. Kent and J. M. Bibby (1979). Multivariate Analysis. Academic Press. ISBN 0-12-471252-5.
- ↑ K.J. Friston; A.P. Holmes; K.J. Worsley; J.-B. Poline; C.D. Frith; R.S.J. Frackowiak (1995). "Statistical Parametric Maps in functional imaging: A general linear approach". Human Brain Mapping. 2 (4): 189–210. doi:10.1002/hbm.460020402.
References
- Christensen, Ronald (2002). Plane Answers to Complex Questions: The Theory of Linear Models (Third ed.). New York: Springer. ISBN 0-387-95361-2.
- Wichura, Michael J. (2006). The coordinate-free approach to linear models. Cambridge Series in Statistical and Probabilistic Mathematics. Cambridge: Cambridge University Press. pp. xiv+199. ISBN 978-0-521-86842-6. MR 2283455.
- Rawlings, John O.; Pantula, Sastry G.; Dickey, David A., eds. (1998). "Applied Regression Analysis". Springer Texts in Statistics. doi:10.1007/b98890. ISBN 0-387-98454-2.