United States presidential election in Ohio, 2004
| | ||||||||||||||||||||||||||||||||
| ||||||||||||||||||||||||||||||||
| ||||||||||||||||||||||||||||||||
|
| ||||||||||||||||||||||||||||||||
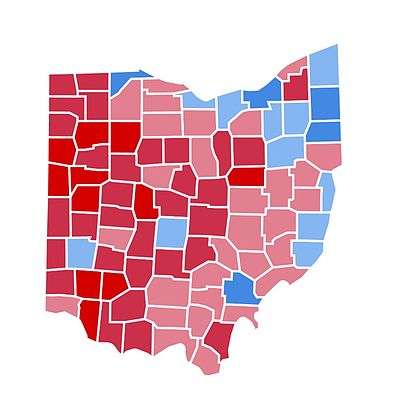
| County Results
Kerry—60-70%
Kerry—50-60%
Bush—50-60%
Bush—60-70%
Bush—70-80% | ||||||||||||||||||||||||||||||||
| ||||||||||||||||||||||||||||||||
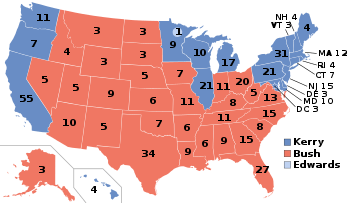
The 2004 United States presidential election in Ohio took place on November 2, 2004 and was part of the 2004 United States presidential election. Voters chose 20 representatives, or electors to the Electoral College, who voted for President and Vice President.
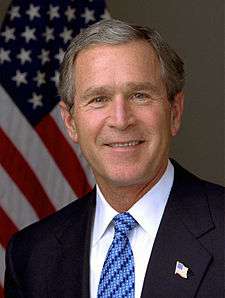
Ohio was won by incumbent President George W. Bush by a 2.1% margin of victory. Prior to the election, most news organizations considered the Buckeye state as a swing state. The state's economic situation gave hope for Senator Kerry. In the end, the state became the deciding factor of the entire election. Kerry conceded the state, as well as the entire election the morning following election night, as Bush won the state and its 20 electoral votes. The close contest was the subject of the documentary film ...So Goes the Nation, the title of which is a reference to Ohio's 2004 status as a crucial swing state.
Primaries
- Ohio Democratic primary, 2004
Campaign
Predictions
| Elections in Ohio | ||||||||||
|---|---|---|---|---|---|---|---|---|---|---|
.svg.png) | ||||||||||
|
||||||||||
|
|
||||||||||
There were 12 news organizations who made state by state predictions of the election. Here are their last predictions before election day.[1]
- D.C. Political Report: Slight Republican
- Associated Press: Toss Up
- CNN: Kerry
- Cook Political Report: Toss Up
- Newsweek: Toss Up
- New York Times: Toss Up
- Rasmussen Reports: Toss Up
- Research 2000: Toss Up
- Washington Post: Battleground
- Washington Times: Battleground
- Zogby International: Tied
- Washington Dispatch: Kerry
Polling
Pre-election polling showed a lot of volatility throughout the general election. In September, Bush was gaining momentum here reaching over 50% in several polls and even reaching double digit margins in some. But in October, Kerry gained back momentum as he started winning many of the polls, leading between 48% to as high as 50%. The last 3 polls averaged Kerry leading 49% to 48%.[2]
Fundraising
Bush raised $7,349,944.[3] Kerry raised $3,428,504.[4]
Advertising and visits
Both candidates campaigned heavily. Bush visited the state 18 times to Kerry's 23 times.[5] Almost every week, over $10 million was spent on television advertising.[6]
Analysis
CNN Exit polling showed that Bush barely won the state. Among male voters, he won with 52%. Among female voters, it was tied 50-50. Also, 53% of the voters approved of Bush's job as president.[7]
Bush dominated in the rural areas, while Kerry dominated and won most of the counties with large populations. Overall, Bush won most of the counties and congressional districts in the state. All the congressional districts Kerry won were in the northern section of the state.[8]
Results
| United States presidential election in Ohio, 2004[9] | |||||
|---|---|---|---|---|---|
| Party | Candidate | Votes | Percentage | Electoral votes | |
| Republican | George W. Bush | 2,858,727 | 50.8% | 20 | |
| Democratic | John Kerry | 2,739,952 | 48.7% | 0 | |
| Independent | Michael Badnarik | 14,695 | 0.3% | 0 | |
| Independent | Michael Peroutka | 11,939 | 0.2% | 0 | |
| Totals | 5,625,613 | 100.00% | 20 | ||
| Voter turnout (Voting age population) | 65.3% | ||||
Results breakdown
By county
| County | Kerry% | Kerry# | Bush% | Bush# | Others% | Others# |
|---|---|---|---|---|---|---|
| Adams | 35.7% | 4,280 | 63.8% | 7,653 | 0.6% | 66 |
| Allen | 33.5% | 16,483 | 66.1% | 32,585 | 0.4% | 206 |
| Ashland | 34.3% | 8,555 | 64.9% | 16,171 | 0.8% | 194 |
| Ashtabula | 53.0% | 24,061 | 46.3% | 21,039 | 0.7% | 309 |
| Athens | 63.2% | 18,997 | 36.1% | 10,847 | 0.7% | 200 |
| Auglaize | 25.6% | 5,904 | 73.9% | 17,012 | 0.5% | 115 |
| Belmont | 52.7% | 17,574 | 46.8% | 15,589 | 0.5% | 157 |
| Brown | 35.9% | 7,140 | 63.6% | 12,647 | 0.5% | 105 |
| Butler | 33.7% | 56,234 | 65.9% | 109,866 | 0.4% | 702 |
| Carroll | 44.6% | 6,298 | 54.5% | 7,695 | 0.8% | 117 |
| Champaign | 37.1% | 6,967 | 62.4% | 11,718 | 0.5% | 90 |
| Clark | 48.7% | 33,534 | 50.8% | 34,938 | 0.5% | 331 |
| Clermont | 29.1% | 25,885 | 70.7% | 62,946 | 0.2% | 211 |
| Clinton | 29.4% | 5,417 | 70.3% | 12,938 | 0.3% | 59 |
| Columbiana | 47.4% | 23,426 | 52.1% | 25,754 | 0.6% | 283 |
| Coshocton | 42.3% | 6,878 | 57.1% | 9,277 | 0.5% | 87 |
| Crawford | 35.7% | 7,773 | 63.7% | 13,885 | 0.7% | 143 |
| Cuyahoga | 66.6% | 448,486 | 32.9% | 221,606 | 0.5% | 3,674 |
| Darke | 29.8% | 7,849 | 69.6% | 18,307 | 0.6% | 161 |
| Defiance | 37.7% | 6,975 | 61.5% | 11,393 | 0.8% | 144 |
| Delaware | 33.6% | 27,048 | 66.1% | 53,142 | 0.3% | 265 |
| Erie | 53.4% | 21,408 | 46.4% | 18,601 | 0.2% | 67 |
| Fairfield | 36.5% | 24,774 | 62.9% | 42,697 | 0.6% | 384 |
| Fayette | 36.9% | 4,334 | 62.7% | 7,375 | 0.4% | 47 |
| Franklin | 54.4% | 285,800 | 45.1% | 237,252 | 0.5% | 2,772 |
| Fulton | 37.5% | 8,224 | 62.1% | 13,639 | 0.4% | 90 |
| Gallia | 38.3% | 5,364 | 61.3% | 8,577 | 0.4% | 51 |
| Geauga | 39.4% | 19,840 | 60.2% | 30,358 | 0.4% | 221 |
| Greene | 38.5% | 30,530 | 61.0% | 48,377 | 0.5% | 365 |
| Guernsey | 43.5% | 7,768 | 55.8% | 9,961 | 0.6% | 111 |
| Hamilton | 47.1% | 199,499 | 52.5% | 222,404 | 0.4% | 1,731 |
| Hancock | 29.0% | 10,343 | 70.5% | 25,101 | 0.5% | 162 |
| Hardin | 36.5% | 4,889 | 63.0% | 8,436 | 0.4% | 60 |
| Harrison | 46.6% | 3,780 | 52.7% | 4,274 | 0.7% | 55 |
| Henry | 33.8% | 5,110 | 65.6% | 9,901 | 0.6% | 92 |
| Highland | 33.5% | 6,194 | 66.1% | 12,212 | 0.4% | 76 |
| Hocking | 46.8% | 6,173 | 52.6% | 6,935 | 0.7% | 88 |
| Holmes | 24.0% | 2,695 | 75.5% | 8,466 | 0.5% | 57 |
| Huron | 41.4% | 10,585 | 58.0% | 14,834 | 0.7% | 173 |
| Jackson | 39.8% | 5,699 | 59.9% | 8,585 | 0.3% | 49 |
| Jefferson | 52.3% | 19,019 | 47.3% | 17,184 | 0.4% | 163 |
| Knox | 36.3% | 9,828 | 63.1% | 17,081 | 0.6% | 157 |
| Lake | 48.5% | 59,049 | 51.1% | 62,193 | 0.5% | 581 |
| Lawrence | 43.7% | 12,111 | 55.8% | 15,457 | 0.5% | 138 |
| Licking | 37.8% | 30,051 | 61.7% | 49,014 | 0.4% | 351 |
| Logan | 31.9% | 6,825 | 67.6% | 14,471 | 0.5% | 102 |
| Lorain | 56.1% | 78,965 | 43.5% | 61,196 | 0.4% | 569 |
| Lucas | 60.2% | 132,536 | 39.6% | 87,106 | 0.2% | 547 |
| Madison | 35.6% | 6,200 | 63.9% | 11,120 | 0.4% | 78 |
| Mahoning | 62.6% | 83,069 | 36.7% | 48,712 | 0.7% | 950 |
| Marion | 40.8% | 11,930 | 58.7% | 17,171 | 0.5% | 157 |
| Medina | 42.7% | 36,264 | 56.8% | 48,183 | 0.5% | 420 |
| Meigs | 41.2% | 4,437 | 58.2% | 6,273 | 0.6% | 61 |
| Mercer | 24.5% | 5,117 | 74.9% | 15,649 | 0.6% | 122 |
| Miami | 34.0% | 17,611 | 65.7% | 34,005 | 0.3% | 164 |
| Monroe | 54.9% | 4,243 | 44.3% | 3,424 | 0.8% | 62 |
| Montgomery | 50.6% | 142,977 | 49.0% | 138,361 | 0.4% | 1,215 |
| Morgan | 42.9% | 2,873 | 56.1% | 3,757 | 1.0% | 70 |
| Morrow | 35.4% | 5,775 | 64.1% | 10,475 | 0.5% | 79 |
| Muskingum | 42.3% | 16,421 | 57.3% | 22,251 | 0.5% | 191 |
| Noble | 40.6% | 2,654 | 58.7% | 3,841 | 0.7% | 45 |
| Ottawa | 47.8% | 11,114 | 51.9% | 12,075 | 0.3% | 68 |
| Paulding | 36.5% | 3,610 | 62.8% | 6,205 | 0.6% | 64 |
| Perry | 47.8% | 7,257 | 51.7% | 7,855 | 0.5% | 76 |
| Pickaway | 37.5% | 8,578 | 62.0% | 14,160 | 0.5% | 112 |
| Pike | 47.6% | 5,989 | 51.8% | 6,519 | 0.5% | 67 |
| Portage | 53.1% | 40,674 | 46.4% | 35,583 | 0.5% | 389 |
| Preble | 34.4% | 7,274 | 65.0% | 13,733 | 0.6% | 119 |
| Putnam | 23.3% | 4,392 | 76.2% | 14,370 | 0.5% | 87 |
| Richland | 39.8% | 24,645 | 59.6% | 36,892 | 0.5% | 330 |
| Ross | 44.1% | 13,977 | 54.4% | 17,229 | 1.5% | 463 |
| Sandusky | 43.7% | 12,653 | 55.9% | 16,198 | 0.4% | 104 |
| Scioto | 47.8% | 16,823 | 51.9% | 18,257 | 0.3% | 117 |
| Seneca | 40.6% | 10,958 | 58.9% | 15,885 | 0.5% | 148 |
| Shelby | 28.6% | 6,534 | 70.9% | 16,204 | 0.5% | 116 |
| Stark | 50.6% | 95,338 | 48.9% | 92,211 | 0.5% | 907 |
| Summit | 56.7% | 156,578 | 42.9% | 118,553 | 0.4% | 1,173 |
| Trumbull | 61.7% | 66,673 | 37.9% | 40,976 | 0.5% | 495 |
| Tuscarawas | 43.9% | 18,854 | 55.5% | 23,825 | 0.5% | 225 |
| Union | 29.5% | 6,665 | 70.1% | 15,869 | 0.4% | 96 |
| Van Wert | 27.6% | 4,094 | 72.0% | 10,678 | 0.4% | 54 |
| Vinton | 44.7% | 2,651 | 54.8% | 3,251 | 0.5% | 28 |
| Warren | 27.6% | 26,043 | 72.1% | 68,035 | 0.4% | 341 |
| Washington | 41.4% | 12,475 | 58.1% | 17,480 | 0.5% | 146 |
| Wayne | 38.2% | 19,786 | 61.5% | 31,879 | 0.4% | 183 |
| Williams | 34.8% | 6,481 | 64.6% | 12,040 | 0.6% | 118 |
| Wood | 46.4% | 29,401 | 53.0% | 33,592 | 0.6% | 353 |
| Wyandot | 33.6% | 3,707 | 65.7% | 7,256 | 0.7% | 81 |
| John Kerry | George W. Bush | Total | |
|---|---|---|---|
| Counties won | 16 | 72 | 88 |
| Best score | Cuyahoga County (66.6%) | Putnam County (76.2%) | . |
| Counties won under statewide margin (2.12%) | 1 | 1 | 2 |
| Stark County (1.7%) | Clark County (2.1%) | . | |
| Counties won under nationwide margin (2.46%) | 1 | 1 | 2 |
| Stark County (1.7%) | Clark County (2.1%) | . |
By congressional district
Bush won 13 of 18 congressional districts.[10]
| District | Bush | Kerry | Representative |
|---|---|---|---|
| 1st | 51% | 49% | Steve Chabot |
| 2nd | 64% | 36% | Rob Portman |
| Jean Schmidt | |||
| 3rd | 54% | 46% | Mike Turner |
| 4th | 65% | 34% | Mike Oxley |
| 5th | 61% | 39% | Paul Gillmor |
| 6th | 51% | 49% | Ted Strickland |
| 7th | 57% | 43% | David Hobson |
| 8th | 64% | 35% | John Boehner |
| 9th | 42% | 58% | Marcy Kaptur |
| 10th | 41% | 58% | Dennis Kucinich |
| 11th | 18% | 81% | Stephanie Tubbs Jones |
| 12th | 51% | 49% | Pat Tiberi |
| 13th | 44% | 56% | Sherrod Brown |
| 14th | 53% | 47% | Steven LaTourette |
| 15th | 50% | 50% | Deborah Pryce |
| 16th | 54% | 46% | Ralph Regula |
| 17th | 37% | 63% | Tim Ryan |
| 18th | 57% | 43% | Bob Ney |
Electors
Technically the voters of Ohio cast their ballots for electors: representatives to the Electoral College. Ohio is allocated 20 electors because it has 18 congressional districts and 2 senators. All candidates who appear on the ballot or qualify to receive write-in votes must submit a list of 20 electors, who pledge to vote for their candidate and his or her running mate. Whoever wins the majority of votes in the state is awarded all 20 electoral votes. Their chosen electors then vote for President and Vice President. Although electors are pledged to their candidate and running mate, they are not obligated to vote for them. An elector who votes for someone other than his or her candidate is known as a faithless elector.
The electors of each state and the District of Columbia met on December 13, 2004 to cast their votes for President and Vice President. The Electoral College itself never meets as one body. Instead the electors from each state and the District of Columbia met in their respective capitols.
The following were the members of the Electoral College from the state. All 20 were pledged for Bush/Cheney.
- Spencer R. Raleigh
- Joyce M. Houck
- Betty Jo Sherman
- Gary C. Suhadolnik
- Randy Law
- Leslie J. Spaeth
- David Whipple Johnson
- Robert S. Frost
- Alex R. Arshinkoff
- Phil A. Bowman
- Jon Allison
- Katharina Hooper
- Pernel Jones
- Henry M. Butch O'Neill
- William O. Dewitt
- Karyle Mumper
- Owen V. Hall
- Merom Brachman
- Kirk Schuring
- Billie Jean Fiore
Objection to certification of Ohio's electoral votes
On January 6, 2005, Senator Barbara Boxer joined Representative Stephanie Tubbs Jones of Ohio in filing a Congressional objection to the certification of Ohio's Electoral College votes due to alleged irregularities including disqualification of provisional ballots, alleged misallocation of voting machines, and disproportionally long waits in poor and predominantly African-American communities.[11][12] The Senate voted the objection down 1–74; the House voted the objection down 31–267.[11] It was only the second Congressional objection to an entire State's electoral delegation in U.S. history; the first instance was in 1877, when all the electors from three southern states were challenged, and one from Oregon.[11][13] (An objection to a single faithless elector was filed in 1969.)[11]
References
- ↑ http://www.dcpoliticalreport.com/members/2004/Pred2.htm#NW[]
- ↑ http://uselectionatlas.org/USPRESIDENT/GENERAL/CAMPAIGN/2004/polls.php?fips=39
- ↑ http://www.campaignmoney.com/political/campaigns/george_w_bush.asp?cycle=04
- ↑ http://www.campaignmoney.com/political/campaigns/john_f_kerry.asp?cycle=04
- ↑ http://www.cnn.com/ELECTION/2004/special/president/showdown/OH/
- ↑ http://www.cnn.com/ELECTION/2004/special/president/campaign.ads/
- ↑ http://www.cnn.com/ELECTION/2004/pages/results/states/OH/P/00/epolls.0.html
- ↑ http://uselectionatlas.org/RESULTS/
- ↑ http://uselectionatlas.org/RESULTS/
- ↑ http://www.swingstateproject.com/diary/4161/
- 1 2 3 4 Ted, Barrett (January 6, 2005), "Bush carries Electoral College after delay", CNN, archived from the original on April 23, 2009, retrieved May 23, 2009
- ↑ Barbara, Boxer (January 6, 2005), Press Release of Senator Boxer: Statement On Her Objection To The Certification Of Ohio's Electoral Votes, archived from the original on June 7, 2008, retrieved May 23, 2009
- ↑ "Electoral Commission Deliberation", Hayes vs. Tilden: The Electoral College Controversy of 1876–1877, HarpWeek, retrieved May 23, 2009


