United States presidential election in South Dakota, 2008
| | ||||||||||||||||||||||||||||||||
| ||||||||||||||||||||||||||||||||
| ||||||||||||||||||||||||||||||||
|
| ||||||||||||||||||||||||||||||||
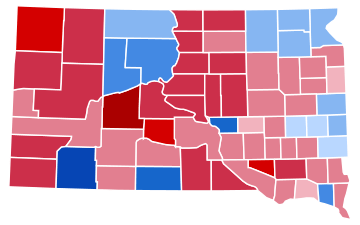
| County Results
Obama—80-90%
Obama—70-80%
Obama—60-70%
Obama—50-60%
Obama—<50%
McCain—<50%
McCain—50-60%
McCain—60-70%
McCain—70-80%
McCain—80-90% | ||||||||||||||||||||||||||||||||
| ||||||||||||||||||||||||||||||||

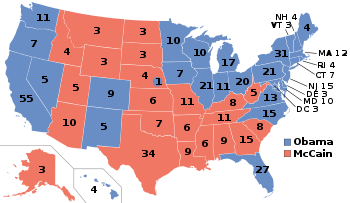
The 2008 United States presidential election in South Dakota took place on November 4, 2008 throughout all 50 states and D.C., which was part of the 2008 United States presidential election. Voters chose 3 representatives, or electors to the Electoral College, who voted for President and Vice President.
South Dakota was won by Republican nominee John McCain by an 8.4% margin of victory. Prior to the election, all 17 news organizations considered this a state McCain would win, or otherwise considered as a red state. Like the other states located in the Great Plains region, South Dakota is a predominantly rural and sparsely populated state with conservative voting tendencies which favors the Republicans, who dominate elections at the state and federal level in the state. South Dakota stayed in the GOP column in 2008 as Republican John McCain carried the state with 53.16%.
Primaries
Campaign
Predictions
| Elections in South Dakota |
|---|
 |
There were 17 news organizations who made state by state predictions of the election. Here are their last predictions before election day:
- D.C. Political Report: Republican[1]
- Cook Political Report: Toss Up[2]
- Takeaway: Solid McCain[3]
- Election Projection: Leaning McCain[4]
- Electoral-vote.com: Leaning Republican[5]
- Washington Post: Leaning McCain[6]
- Politico: Solid McCain[7]
- Real Clear Politics: Leaning McCain[8]
- FiveThirtyEight.com: Solid McCain[9]
- CQ Politics: Safe Republican[10]
- New York Times: Solid Republican[11]
- CNN: Safe Republican[12]
- NPR: Solid McCain[13]
- MSNBC: Leaning McCain[14]
- Fox News: Republican[15]
- Associated Press: Republican[16]
- Rasmussen Reports: Safe Republican[17]
Polling
McCain won every single pre-election poll, and never polled less than 47%. The highest Obama ever polled was 43%. The final 3 polls showed McCain leading 50% to 42%.[18]
Fundraising
John McCain raised a total of $287,533 in the state. Barack Obama raised $337,053.
Advertising and visits
Obama and his interest groups spent $639,435. McCain and his interest groups spent just $1,531.[19] Obama didn't visit the state, as McCain visited the state once, in Sturgis, South Dakota.[20]
Analysis
South Dakota, a predominantly Republican state, has not voted for a Democratic presidential nominee since Lyndon B. Johnson won the state in the landslide Election of 1964. A sparsely populated state with a rural and conservative lifestyle of many of the state's inhabitants, since then, the state has been won handily by the Republicans.
McCain was able to keep South Dakota in the GOP column in 2008, taking in 53.16% of the total statewide vote over Obama who received 44.75%, an 8.41-percent margin of victory. This margin of victory was considerably smaller compared to 2004 when George W. Bush carried South Dakota with 59.91% of the vote over John Kerry who received 38.44%, a 21.47% margin of victory, resulting in a 13.06-percent swing to the Democrats in 2008.
While McCain did well throughout the state, his main strength was in Western South Dakota, where he often won by landslide margins.[21] He was able to carry Pennington County, South Dakota, which contains the state's second largest city of Rapid City. In contrast, Obama ran best in Eastern South Dakota, losing most counties by fairly close margins. He also did well among Native Americans; in Western South Dakota, the only counties Obama won were majority Native American.
Obama was able to substantially improve upon John Kerry's showing in South Dakota in 2004 by a number of factors. First, it helped that South Dakota received media attention during the course of the 2008 Democratic Primary, being the last state to vote in the historic and contentious primary that gave Hillary Rodham Clinton an 11-point victory over Obama; it was Clinton's last victory in the primary. In the general election, Obama was able to cut the margin significantly by narrowly carrying Minnehaha County, which contains the state's largest city of Sioux Falls. He was also able to win Brown County, which contains Aberdeen, as well as Brookings County which contains Brookings, home of South Dakota State University. He did much better than Kerry in Eastern South Dakota, which is where most of the people live, but McCain's margins throughout the state were too large to overcome.
During the same election, incumbent Democratic U.S. Senator Tim Johnson was soundly reelected over Republican State Senator Jim Dykstra by a two-to-one margin, receiving 62.49% of the vote to Dykstra's 37.51%. At the state level, Democrats made gains in the South Dakota Legislature, picking up four seats in the South Dakota House of Representatives.
Results
| United States presidential election in South Dakota, 2008 | ||||||
|---|---|---|---|---|---|---|
| Party | Candidate | Running mate | Votes | Percentage | Electoral votes | |
| Republican | John McCain | Sarah Palin | 203,054 | 53.16% | 3 | |
| Democratic | Barack Obama | Joe Biden | 170,924 | 44.75% | 0 | |
| Independent | Ralph Nader | Matt Gonzalez | 4,267 | 1.12% | 0 | |
| Constitution | Chuck Baldwin | Darrell Castle | 1,895 | 0.50% | 0 | |
| Libertarian | Bob Barr | Wayne Allyn Root | 1,835 | 0.48% | 0 | |
| Totals | 381,975 | 100.00% | 3 | |||
| Voter turnout (Voting age population) | 64.7% | |||||
Results breakdown
By county
| County | Obama percent | Obama votes | McCain percent | McCain votes |
| Aurora | 45.20% | 655 | 54.80% | 794 |
| Beadle | 46.28% | 3493 | 53.72% | 4054 |
| Bennett | 47.57% | 557 | 52.43% | 614 |
| Bon Homme | 44.40% | 1367 | 55.60% | 1712 |
| Brookings | 52.84% | 7207 | 47.16% | 6431 |
| Brown | 52.85% | 9041 | 47.15% | 8067 |
| Brule | 40.68% | 965 | 59.32% | 1407 |
| Buffalo | 74.43% | 454 | 25.57% | 156 |
| Butte | 31.65% | 1306 | 68.35% | 2821 |
| Campbell | 29.14% | 243 | 70.86% | 591 |
| Charles Mix | 46.14% | 1807 | 53.86% | 2109 |
| Clark | 43.80% | 830 | 56.20% | 1065 |
| Clay | 62.39% | 3808 | 37.61% | 2296 |
| Codington | 46.75% | 5595 | 53.25% | 6374 |
| Corson | 61.01% | 837 | 38.99% | 535 |
| Custer | 33.65% | 1475 | 66.35% | 2909 |
| Davison | 42.90% | 3554 | 57.10% | 4731 |
| Day | 56.54% | 1785 | 43.46% | 1372 |
| Deuel | 49.21% | 1054 | 50.79% | 1088 |
| Dewey | 66.83% | 1326 | 33.17% | 658 |
| Douglas | 24.69% | 424 | 75.31% | 1293 |
| Edmunds | 40.31% | 819 | 59.69% | 1213 |
| Fall River | 36.30% | 1338 | 63.70% | 2348 |
| Faulk | 36.57% | 426 | 63.43% | 739 |
| Grant | 47.79% | 1786 | 52.21% | 1951 |
| Gregory | 35.14% | 771 | 64.86% | 1423 |
| Haakon | 16.55% | 186 | 83.45% | 938 |
| Hamlin | 38.57% | 1043 | 61.43% | 1661 |
| Hand | 36.54% | 718 | 63.46% | 1247 |
| Hanson | 40.26% | 961 | 59.74% | 1426 |
| Harding | 19.01% | 135 | 80.99% | 575 |
| Hughes | 36.44% | 3037 | 63.56% | 5298 |
| Hutchinson | 35.21% | 1242 | 64.79% | 2285 |
| Hyde | 29.24% | 226 | 70.76% | 547 |
| Jackson | 39.44% | 435 | 60.56% | 668 |
| Jerauld | 50.00% | 535 | 50.00% | 535 |
| Jones | 24.10% | 147 | 75.90% | 463 |
| Kingsbury | 47.09% | 1277 | 52.91% | 1435 |
| Lake | 50.33% | 3033 | 49.67% | 2993 |
| Lawrence | 42.09% | 4932 | 57.91% | 6787 |
| Lincoln | 42.27% | 8642 | 57.73% | 11803 |
| Lyman | 44.26% | 710 | 55.74% | 894 |
| Marshall | 58.35% | 1261 | 41.65% | 900 |
| McCook | 42.55% | 1219 | 57.45% | 1646 |
| McPherson | 32.52% | 441 | 67.48% | 915 |
| Meade | 33.28% | 3749 | 66.72% | 7515 |
| Mellette | 45.60% | 373 | 54.40% | 445 |
| Miner | 51.18% | 605 | 48.82% | 577 |
| Minnehaha | 50.37% | 39831 | 49.63% | 39241 |
| Moody | 52.44% | 1663 | 47.56% | 1508 |
| Pennington | 39.20% | 17787 | 60.80% | 27592 |
| Perkins | 31.17% | 499 | 68.83% | 1102 |
| Potter | 33.97% | 482 | 66.03% | 937 |
| Roberts | 60.00% | 2672 | 40.00% | 1781 |
| Sanborn | 42.77% | 500 | 57.23% | 669 |
| Shannon | 89.99% | 2967 | 10.01% | 330 |
| Spink | 48.29% | 1550 | 51.71% | 1660 |
| Stanley | 33.40% | 510 | 66.60% | 1017 |
| Sully | 28.62% | 233 | 71.38% | 581 |
| Todd | 79.45% | 2208 | 20.55% | 571 |
| Tripp | 32.96% | 914 | 67.04% | 1859 |
| Turner | 39.84% | 1681 | 60.16% | 2538 |
| Union | 42.94% | 3244 | 57.06% | 4310 |
| Walworth | 35.62% | 923 | 64.38% | 1668 |
| Yankton | 48.98% | 4838 | 51.02% | 5039 |
| Ziebach | 63.97% | 554 | 36.03% | 312 |
By congressional district
South Dakota has only one congressional district because of its low population compared to other states. This district, called the At-Large district because it covers the entire state, is equivalent to the statewide election results.
| District | McCain | Obama | Representative |
|---|---|---|---|
| At-large | 53.2% | 44.8% | Stephanie Herseth Sandlin |
Electors
Technically the voters of South Dakota cast their ballots for electors, representatives to the Electoral College. The state is allocated 3 electors because it has 1 congressional district and 2 senators. All candidates who appear on the ballot or qualify to receive write-in votes must submit a list of 3 electors, who pledge to vote for their candidate and the candidate's running mate. In the state's First Past the Post (plurality voting) system, the winner of the majority of votes in the state is awarded all 3 electoral votes. Their chosen electors then vote for President and Vice President. Although electors are pledged to their candidate and running mate, they are not obligated to vote for them.[22] An elector who votes for someone other than his or her candidate is known as a faithless elector.
The electors of each state and the District of Columbia met on December 15, 2008, to cast their votes for President and Vice President. The Electoral College itself never meets as one body. Instead the electors from each state and the District of Columbia met in their respective capitals.
The following were the members of the Electoral College from the state. All 3 were pledged to John McCain and Sarah Palin:[23]
References
- ↑ "D.C.'s Political Report: The complete source for campaign summaries". Dcpoliticalreport.com. Retrieved 2015-05-04.
- ↑ "Presidential". Cookpolitical.com. Archived from the original on May 5, 2015. Retrieved 2015-05-04.
- ↑ Archived May 9, 2011, at the Wayback Machine.
- ↑ "Election Projection : 2008". Electionprojection.com. Retrieved 2015-05-04.
- ↑ "President, Senate, House Updated Daily". Electoral-vote.com. Retrieved 2015-05-04.
- ↑ Based on Takeaway
- ↑ "POLITICO's 2008 Swing State Map". Politico.Com. Retrieved 2015-05-04.
- ↑ "RealClearPolitics Electoral College". Realclearpolitics.com. Retrieved 2015-05-04.
- ↑ Based on Takeaway
- ↑ Archived June 14, 2009, at the Wayback Machine.
- ↑ "Who's Ahead". The New York Times. Retrieved May 26, 2010.
- ↑ "October – 2008 – CNN Political Ticker - CNN.com Blogs". CNN. October 31, 2008. Retrieved May 26, 2010.
- ↑ Based on Takeaway
- ↑ Based on Takeaway
- ↑ "Winning The Electoral College". Fox News. April 27, 2010.
- ↑ "roadto270". Hosted.ap.org. Retrieved 2015-05-04.
- ↑ "Election 2008: Electoral College Update - Rasmussen Reports™". Rasmussenreports.com. 2008-11-03. Retrieved 2015-05-04.
- ↑ Archived November 28, 2008, at the Wayback Machine.
- ↑ "Map: Campaign Ad Spending - Election Center 2008 from CNN.com". CNN. Retrieved May 26, 2010.
- ↑ "Map: Campaign Candidate Visits - Election Center 2008 from CNN.com". CNN. Retrieved May 26, 2010.
- ↑ "Election Results 2008". New York Times. Archived from the original on November 3, 2004. Retrieved 2009-05-17.
- ↑ "Electoral College". California Secretary of State. Archived from the original on October 30, 2008. Retrieved 2008-11-01.
- ↑ "U. S. Electoral College 2008 Election - Certificates". Archives.gov. Retrieved 2015-05-04.