United States presidential election in Washington (state), 2008
| | ||||||||||||||||||||||||||||||||
| ||||||||||||||||||||||||||||||||
| ||||||||||||||||||||||||||||||||
|
| ||||||||||||||||||||||||||||||||
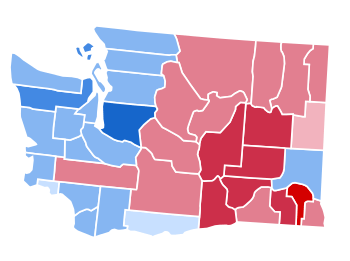
| County Results
Obama—70-80%
Obama—60-70%
Obama—50-60%
Obama—<50%
McCain—<50%
McCain—50-60%
McCain—60-70%
McCain—70-80% | ||||||||||||||||||||||||||||||||
| ||||||||||||||||||||||||||||||||

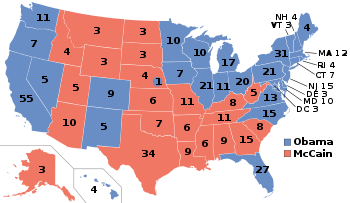
The 2008 United States presidential election in Washington took place on November 4, 2008 throughout all 50 states and D.C., which was part of the 2008 United States presidential election. Voters chose 11 representatives, or electors to the Electoral College, who voted for President and Vice President.
Washington was won by Democratic nominee Barack Obama by a 17.1% margin of victory. Prior to the election, all 17 news organizations considered this a state Obama would win, or otherwise considered as a safe blue state. No Republican presidential nominee had won the State of Washington in 20 years. Continuing on that trend, Washington stayed in the Democratic column as Obama carried the state with over 57% of the vote.
Democratic primary
The Democratic caucuses were a series of events held by the Washington State Democratic Party to determine the delegates that the Party sent to the 2008 Democratic National Convention. Delegates were selected in a four-tier process that began with precinct caucuses, was further refined in legislative district caucuses and/or county conventions, concluded for some delegates in the congressional district caucuses, and finally concluded for the remaining delegates at the state convention.
Washington also held a Democratic primary on February 19, 2008, but the Washington State Democratic Party did not use the results of the primary to determine its delegates.[1]
Delegate breakdown
The Washington State Democratic Party sent a total of 97 delegates to the 2008 Democratic National Convention. Of those delegates, 78 were pledged and 19 were unpledged. The 78 pledged delegates were allocated (pledged) to vote for a particular candidate at the National Convention according to the results of Washington's four-step caucus process. The 19 unpledged delegates were popularly called "superdelegates" because their vote represented their personal decisions, whereas the regular delegates' votes represented the collective decision of many voters. The superdelegates were free to vote for any candidate at the National Convention and were selected by the Washington State Democratic Party's officials and the pledged delegates.[2][3]
The 78 pledged delegates were further divided into 51 district delegates and 27 statewide delegates. The 51 district delegates were divided among Washington's 9 Congressional Districts and were allocated to the presidential candidates based on the caucus results in each District. The 27 statewide delegates were divided into 17 at-large delegates and 10 Party Leaders and Elected Officials (abbreviated PLEOs). They were allocated to the presidential candidates at the State Convention based on the preference of the 51 district delegates on June 13–15.[2][3]
Of the 19 unpledged delegates, 17 were selected in advance and 2 were selected at the State Convention. The delegates selected in advance were 7 Democratic National Committee members, the 2 Democratic U.S. Senators from Washington, Maria Cantwell and Patty Murray, the 6 Democratic U.S. Representatives from Washington, and the Democratic Governor of Washington, Christine Gregoire.[2][3]
Delegate selection process
Precinct caucuses
The precinct caucuses took place on February 9, 2008. Washington's two senators, Patty Murray and Maria Cantwell, endorsed Senator Hillary Clinton earlier in the nomination season.[4] The week before the caucuses, Washington's governor, Christine Gregoire, endorsed Senator Barack Obama.[5]
The caucuses were open to all voters who would be 18 years old by November 4, 2008. To vote, participants completed a form with their contact information and candidate preference. The form also asked voters to sign an oath stating: "I declare that I consider myself to be a DEMOCRAT and I will not participate in the nomination process of any other political party for the 2008 Presidential election." In some caucus groups, members split into smaller groups according to the candidate they supported. Voters supporting non-viable candidates had the option of moving into viable groups, and voters in viable groups could change their preference.[6] Unlike other state Democratic Party caucuses, Washington does not require a 15% threshold for allocation of delegates at the precinct level. Rules state that any fractional delegates remaining are awarded to the candidate with the most votes that do not have delegates.
Legislative District caucuses and County conventions

The second tier of the delegate selection process involved choosing 2,000 Legislative District delegates (and 1,000 alternates) to send to the Congressional District conventions on May 17 and the State Convention on June 13–15.[7] There are 49 Legislative Districts in Washington State. Each district was allocated a certain number of delegates.[8] Delegates were elected at either Legislative District caucuses or County conventions. Each of Washington's 39 counties has a local Democratic Party organization that determined the event at which delegate selection would take place. Most counties chose to select delegates at Legislative District caucuses on April 5. The remaining counties selected delegates at sub-caucuses during their County Conventions, most of which were held on either April 12 or April 19. The breakdown of events by date is listed below.[9][10]
April 5
Legislative District caucuses:
- 1st through 6th
- 8th
- 11th
- 12th
- 16th (Benton County portion only, held at the 8th LD caucus)
- 21st
- 25th through 34th
- 36th through 39th
- 40th (San Juan County portion only)
- 41st through 48th
County Convention:
- Whatcom (40th LD)
April 12
County Conventions:
- Clallam (24th LD)
- Franklin (9th & 16th LDs)
- Grays Harbor (19th, 24th & 35th LDs)
- Kitsap (23rd & 35th LDs)
- Kittitas (13th LD)
- Pend Oreille (7th LD)
- Skagit (10th & 40th LDs)
April 13
County Convention:
- Snohomish (10th LD)
April 19
County Conventions:
- Asotin (9th LD)
- Chelan (13th LD)
- Clark (15th, 17th, 18th & 49th LDs)
- Cowlitz (18th & 19th LDs)
- Ferry (7th LD)
- Grant (13th LD)
- Island (10th LD)
- Klickitat (15th LD)
- Lewis (20th LD)
- Lincoln (7th LD)
- Mason (35th LD)
- Okanogan (7th LD)
- Pacific (19th LD)
- Skamania (15th LD)
- Spokane (7th & 9th LDs)
- Stevens (7th LD)
- Thurston (20th, 22nd & 35th LDs)
- Wahkiakum (19th LD)
- Whitman (9th LD)
- Yakima (13th, 14th & 15th LDs)
April 20
County Convention:
- Walla Walla (16th LD)
April 26
County Convention:
- Jefferson (24th LD)
Unknown date
County Conventions:
- Adams (9th LD)
- Garfield (9th LD)
- Columbia (16th LD)
Congressional district caucuses
Fifty-one delegates were chosen at the nine congressional district caucuses. Each district was allotted a different number of delegates:
- CD 1: 6
- CD 2: 6
- CD 3: 5
- CD 4: 3
- CD 5: 5
- CD 6: 6
- CD 7: 9
- CD 8: 6
- CD 9: 5
State convention
Twenty-nine delegates were chosen at the state convention, twenty-seven of which were pledged to vote for a particular candidate. Seventeen of these pledged delegates were "at-large" delegates that did not represent a specific Washington congressional district, and ten were party leaders and elected officials (PLEOs).
Polls
Results
Precinct caucuses
Caucus date: February 9, 2008
National pledged delegates determined: 0 (of 78)
| Washington Democratic presidential precinct caucuses, 2008 96.4% of precincts reporting[11] | |||
|---|---|---|---|
| Candidate | Precinct delegates | Percentage | Estimated national delegates[12] |
| Barack Obama | 21,768 | 67.56% | 52 |
| Hillary Clinton | 10,038 | 31.15% | 26 |
| Other | 50 | 0.16% | 0 |
| Uncommitted | 364 | 1.13% | 0 |
| Totals | 32,220 | 100.00% | 78 |
Primary
The Washington State Democratic Party did not use the results of the primary to determine its delegates.[1]
Primary date: February 19, 2008
National pledged delegates determined: 0 (of 78)
| Key: | Withdrew prior to contest |
| Washington Democratic presidential primary, 2008[13] | |||
|---|---|---|---|
| Candidate | Votes | Percentage | |
| Barack Obama | 354,112 | 51.22% | |
| Hillary Clinton | 315,744 | 45.67% | |
| John Edwards | 11,892 | 1.72% | |
| Dennis Kucinich | 4,021 | 0.58% | |
| Bill Richardson | 2,040 | 0.30% | |
| Joe Biden | 1,883 | 0.27% | |
| Mike Gravel | 1,071 | 0.15% | |
| Christopher Dodd | 618 | 0.09% | |
| Totals | 691,381 | 100.00% | |
Legislative district caucuses and county conventions
Dashes indicate districts for which results are unavailable.
Caucus/Convention dates: April 5–26, 2008
National pledged delegates determined: 0 (of 78)
| Washington Democratic Legislative District Caucuses and County Conventions, 2008 61% of districts reporting | |||
|---|---|---|---|
| Legislative District |
Barack Obama |
Hillary Clinton |
Total State Delegates from this LD[8] |
| LD1[14] | 32 | 12 | 44 |
| LD2[15] | 26 | 14 | 40 |
| LD3 | – | – | 33 |
| LD4 | – | – | 38 |
| LD5[16] | 36 | 12 | 48 |
| LD6[17] | 29 | 15 | 44 |
| LD7 | – | – | 34 |
| LD8 | – | – | 33 |
| LD9 | – | – | 33 |
| LD10 | – | – | 43 |
| LD11[18] | 26 | 10 | 36 |
| LD12 | – | – | 31 |
| LD13 | – | – | 28 |
| LD14 | – | – | 27 |
| LD15 | – | – | 26 |
| LD16 | – | – | 28 |
| LD17 | – | – | 39 |
| LD18 | – | – | 44 |
| LD19 | – | – | 38 |
| LD20[19] | 25 | 13 | 38 |
| LD21 | – | – | 40 |
| LD22[20] | 36 | 13 | 49 |
| LD23[21] | 34 | 11 | 45 |
| LD24[22] | 28 | 10 | 47 |
| LD25[23] | 26 | 15 | 41 |
| LD26[24] | 28 | 14 | 42 |
| LD27[25] | 27 | 12 | 39 |
| LD28 | – | – | 34 |
| LD29 | – | – | 30 |
| LD30 | – | – | 35 |
| LD31[26] | 22 | 16 | 38 |
| LD32[27] | 36 | 14 | 50 |
| LD33[28] | 23 | 12 | 35 |
| LD34[29] | 38 | 13 | 51 |
| LD35[30] | 15 | 8 | 41 |
| LD36[31] | 52 | 15 | 67 |
| LD37[31] | 38 | 9 | 47 |
| LD38[32] | 23 | 11 | 34 |
| LD39[33] | 27 | 12 | 39 |
| LD40[34] | 36 | 9 | 47 |
| LD41[35] | 36 | 13 | 49 |
| LD42[36] | 33 | 10 | 43 |
| LD43[37] | 53 | 14 | 67 |
| LD44[38] | 30 | 13 | 43 |
| LD45[39] | 33 | 12 | 45 |
| LD46[40] | 45 | 15 | 60 |
| LD47[41] | 27 | 11 | 38 |
| LD48[42] | 30 | 11 | 41 |
| LD49 | – | – | 38 |
| Totals | 950 | 369 | 2,000 |
| Estimated national delegates |
0 | 0 | 78 |
Congressional district caucuses
Caucus date: May 17, 2008
National pledged delegates determined: 51 (of 78)
| Washington Democratic Congressional District Caucuses, 2008 0% of districts reporting | |||||
|---|---|---|---|---|---|
| Congressional District | National Delegates Obama[43] | National Delegates Clinton[44] | National Delegates Total | ||
| CD1[45] | 4 | 2 | 6 | ||
| CD2 | 4 | 2 | 6 | ||
| CD3 | 3 | 2 | 5 | ||
| CD4 | 2 | 1 | 3 | ||
| CD5 | 3 | 2 | 5 | ||
| CD6 | 4 | 2 | 6 | ||
| CD7[46] | 7 | 2 | 9 | ||
| CD8 | 4 | 2 | 6 | ||
| CD9 | 3 | 2 | 5 | ||
| Totals | 34 | 17 | 51 | ||
State convention
Convention date: June 13–15, 2008
National pledged delegates determined: 27 (of 78)
| Washington Democratic State Convention, 2008[3] | |||
|---|---|---|---|
| Candidate | At-Large and PLEO delegates | Percentage | National delegates |
| Barack Obama | 18 | 66.67% | 52 |
| Hillary Clinton | 9 | 33.33% | 26 |
| Totals | 27 | 100.00% | 78 |
Republican caucuses and primary
| | |||||||||||||||||||||||||||||||||||||||||||||||||||||
| |||||||||||||||||||||||||||||||||||||||||||||||||||||
| |||||||||||||||||||||||||||||||||||||||||||||||||||||
|
| |||||||||||||||||||||||||||||||||||||||||||||||||||||
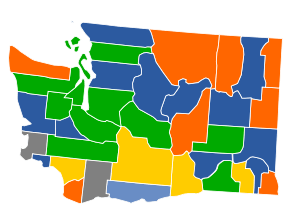
| Results by county. John McCain Mike Huckabee Ron Paul Mitt Romney Uncommited | |||||||||||||||||||||||||||||||||||||||||||||||||||||

The Republican caucuses were held on Saturday February 9 and the primary on February 19, 2008 to compete 40 total delegates, of which 18 tied to the caucuses, 19 tied to the primary, and 3 unpledged RNC member delegates.[47]
Candidates
All following candidates appeared on the ballot for voters in Washington:
- Mike Huckabee
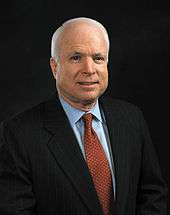
- John McCain
- Ron Paul
- Mitt Romney (candidate suspended his campaign)
Caucuses
Voting in Washington's caucuses closed at 9:00 pm EST February 9.
The Washington Republican Party declared John McCain the winner on the night of the election, after 87% of the votes were counted. Mike Huckabee disputed the results and accused the state party of calling the election prematurely. He demanded a statewide caucus recount.[48] However, by Tuesday, February 12, the Washington Republicans again declared McCain the winner after 96% of the votes were tallied,[49] and never counted the rest of the votes.[50]
| Candidate | State delegate | Percentage | Delegates | Counties carried |
|---|---|---|---|---|
| John McCain | 3,228 | 25.9% | 16 | 11 |
| Mike Huckabee | 2,959 | 23.52% | 8 | 11 |
| Ron Paul | 2,740 | 21.64% | 5 | 9 |
| Mitt Romney | 1,903 | 15.45% | 0 | 4 |
| Uncommitted | 1,662 | 13.49% | 0 | 2 |
| Total | 12,320 | 100% | 29 | 37 |
Primary
The primary took place on February 19, 2008.
| Candidate | Votes | Percentage | Delegates |
|---|---|---|---|
| John McCain | 262,304 | 49.50% | 16 |
| Mike Huckabee | 127,657 | 24.09% | 8 |
| Mitt Romney* | 86,140 | 16.25% | 0 |
| Ron Paul | 40,539 | 7.65% | 5 |
| Rudy Giuliani* | 5,145 | 0.97% | 0 |
| Fred Thompson* | 4,865 | 0.92% | 0 |
| Alan Keyes | 2,226 | 0.42% | 0 |
| Duncan Hunter* | 799 | 0.19% | 0 |
| Total | 529,932 | 100% | 29 |
* Candidate stopped campaign before primary
Money raised
The following table shows the amount of money each Republican Party candidate raised in the state of Washington.[52]
| Candidate | Money raised |
|---|---|
| Mitt Romney | $689,329 |
| Ron Paul | $531,471 |
| John McCain | $308,074 |
| Rudy Giuliani | $264,788 |
| Fred Thompson | $81,208 |
| Mike Huckabee | $81,208 |
| Duncan Hunter | $15,378 |
Campaign
Predictions
| Elections in Washington |
|---|
 |
|
General elections
Gubernatorial elections
Attorney General elections Secretary of State elections State Senate elections State House elections State Supreme Court elections Other judicial elections |
|
|
There were 17 news organizations who made state by state predictions of the election. Here are their last predictions before election day:
- D.C. Political Report: Democrat[53]
- Cook Political Report: Solid Democrat[54]
- Takeaway: Solid Obama[55]
- Election Projection: Solid Obama[56]
- Electoral-vote.com: Strong Democrat[57]
- Washington Post: Solid Obama[58]
- Politico: Solid Obama[59]
- Real Clear Politics: Solid Obama[60]
- FiveThirtyEight.com: Solid Obama[58]
- CQ Politics: Safe Democrat[61]
- New York Times: Solid Democrat[62]
- CNN: Safe Democrat[63]
- NPR: Solid Obama[58]
- MSNBC: Solid Obama[58]
- Fox News: Democrat[64]
- Associated Press: Democrat[65]
- Rasmussen Reports: Safe Democrat[66]
Polling
Since February 28, Obama won every pre-election poll. Since September 22, he won each poll with a double digit margin of victory. The final 3 polls averaged Obama leading 54% to 40%.
Fundraising
McCain raised a total of $2,697,999 in the state. Obama raised $16,518,208.[67]
Advertising and visits
Obama and his interest groups spent $312,869. McCain and his interest groups spent just $2,264.[68] The Democratic ticket visited the state once, while the Republican ticket did not visit at all.[69]
Analysis
Washington once leaned Republican, like most of the Pacific Northwest. From 1952 to 1984, it only went Democratic twice—in 1968 and 1964. However, it has voted for the Democratic presidential nominee in every presidential election since 1988. Neither candidate seriously contested the state as it was viewed as a safe blue state. Like Oregon, the state is divided politically by the urban/rural divide and geographically by the Cascade Mountains. The two are related in that nearly all of the major cities lie west of the Cascades. Most of the state's population resides in Western Washington along the Pacific Coast and in highly urbanized areas like Seattle. The Seattle area, home to almost two-thirds of the state's population, is overwhelmingly Democratic. The rest of Western Washington leans Democratic as well, though the lean is not as pronounced as in the greater Seattle area. In contrast, Eastern Washington is very rural, and in many ways more similar to Idaho than Seattle. Republicans have had an edge here for many years, in part to its strong tinge of social conservatism. As a result, while Republicans typically win more counties, the overwhelming Democratic trend in the more-heavily populated western portion is enough to swing the whole state to the Democrats.
On Election Day, Obama won the state by 17.08%. He swept the more urban counties along the Western Seaboard, which compose the Democratic base. More than two-thirds of the state's population lives in this area; this makes it very difficult for a Republican to win the state because of this region's liberal tilt. Obama would have been assured a victory in any event due to his performance in the Seattle area. He carried King County, home to Seattle itself and its close suburbs and just over a third of the state's population, with 69.97 percent of the vote—almost three-fifths of his statewide majority. Obama also swept the two other big counties in Western Washington, Pierce (home to Tacoma) and Snohomish (home to Everett) by decisive margins. His combined majority in King, Pierce and Snohomish counties would have been more than enough to carry the state. McCain only won one county in the western part of the state, Lewis County, traditionally the most socially conservative county west of the Cascades.
On the other hand, McCain did extremely well in Eastern Washington. Neither Al Gore or John Kerry was able to take a single county in Eastern Washington; in 2008, Obama only won one small county, Whitman County, home to Washington State University in Pullman. Nevertheless, as with Oregon, McCain's margins in the eastern part of the state were far outweighed by Obama's landslides in the more populated coastal regions and cities in the western part of the state. Obama did, however, improve substantially in Eastern Washington, especially in the region's largest county, Spokane County, home to the city of Spokane.
During the same election, incumbent Democratic Governor Christine Gregoire was reelected to a second term with 53.72% of the vote over Republican Dino Rossi who took 46.28%. At the state level, Democrats picked up one seat in the Washington House of Representatives while Republicans picked up a seat in the Washington Senate.
Results
| United States presidential election in Washington, 2008 | ||||||
|---|---|---|---|---|---|---|
| Party | Candidate | Running mate | Votes | Percentage | Electoral votes | |
| Democratic | Barack Obama | Joe Biden | 1,750,848 | 57.34% | 11 | |
| Republican | John McCain | Sarah Palin | 1,229,216 | 40.26% | 0 | |
| Independent | Ralph Nader | Matt Gonzalez | 29,489 | 0.97% | 0 | |
| Write-ins | Write-ins | 14,880 | 0.49% | 0 | ||
| Libertarian | Bob Barr | Wayne Allyn Root | 12,728 | 0.42% | 0 | |
| Constitution | Chuck Baldwin | Darrell Castle | 9,432 | 0.31% | 0 | |
| Green | Cynthia McKinney | Rosa Clemente | 3,819 | 0.13% | 0 | |
| Others | Others | 6,642 | 0.22% | 0 | ||
| Totals | 3,057,054 | 100.00% | 11 | |||
| Voter turnout (Voting age population) | 62.2% | |||||
Results breakdown
By congressional district
Barack Obama carried seven of the state’s nine congressional districts, including one district held by a Republican.
| District | McCain | Obama | Representative |
|---|---|---|---|
| 1st | 35.93% | 62.44% | Jay Inslee |
| 2nd | 42.00% | 55.60% | Rick Larsen |
| 3rd | 45.66% | 52.37% | Brian Baird |
| 4th | 57.84% | 40.30% | Doc Hastings |
| 5th | 51.54% | 45.97% | Cathy McMorris Rodgers |
| 6th | 40.51% | 57.43% | Norman D. Dicks |
| 7th | 14.96% | 83.54% | Jim McDermott |
| 8th | 41.83% | 56.62% | Dave Reichert |
| 9th | 39.47% | 58.72% | Adam Smith |
Electors
Technically the voters of Washington cast their ballots for electors: representatives to the Electoral College. Washington is allocated 11 electors because it has 9 congressional districts and 2 senators. All candidates who appear on the ballot or qualify to receive write-in votes must submit a list of 11 electors, who pledge to vote for their candidate and his or her running mate. Whoever wins the majority of votes in the state is awarded all 11 electoral votes. Their chosen electors then vote for President and Vice President. Although electors are pledged to their candidate and running mate, they are not obligated to vote for them.[70] An elector who votes for someone other than his or her candidate is known as a faithless elector.
The electors of each state and the District of Columbia met on December 15, 2008 to cast their votes for President and Vice President. The Electoral College itself never meets as one body. Instead the electors from each state and the District of Columbia met in their respective capitols.
The following were the members of the Electoral College from the state. All 11 were pledged to Barack Obama and Joe Biden:[71]
- Jeff Siddiqui[72]
- Maggie Hanson
- Jane Buchanan‐Banks
- Pat M. Notter
- Marcus Riccelli[73]
- Bradford Donovan
- Lesley Ahmed[74]
- Di A. Irons [75]
- Calvin Edwards
- Kristine Fallstone
- John Daniels
References
- 1 2 Yardley, William (2008-02-18). "In Washington State Vote, Relevance Is an Issue". The New York Times.
- 1 2 3 "Washington State Delegate Selection Plan For The 2008 Democratic National Convention" (PDF). Washington State Democratic Party. 2007-08-23. Archived from the original (PDF) on 2008-04-23. Retrieved 2008-04-29.
- 1 2 3 4 Berg-Andersson, Richard (2008-03-01). "Washington Democrat Presidential Nominating Process". The Green Papers. Retrieved 2008-03-05.
- ↑ "Murray endorses Clinton". Seattle Times Company. 2008-01-31. Retrieved 2008-02-08.
|first1=missing|last1=in Authors list (help) - ↑ McGann, Chris (2008-02-08). "Gregoire endorses Obama". Seattle PI. Retrieved 2008-02-08.
- ↑ Washington State Democrats - Caucuses FAQ
- ↑ "The 2008 Washington State Democratic Caucus-Convention Cycle" (PDF). 46th District Democrats. 2007-12-02. Retrieved 2008-04-25.
- 1 2 Ravens, Jaxon. "Delegates and Alternates Allocated to each County and Legislative District for the Congressional District Caucuses and the State Convention" (PDF). 34th District Democrats. Retrieved 2008-04-25.
- ↑ "Washington State Democrats - Legislative District Caucuses". Washington State Democratic Party. Retrieved 2008-04-25.
- ↑ "Washington State Democrats - County Conventions". Washington State Democratic Party. Retrieved 2008-04-25.
- ↑ "Caucus Results by Jurisdiction". Washington State Democratic Party. 2008-02-12. Retrieved 2008-02-12.
- ↑ Washington State Democrats
- ↑ "President - Democratic Party Federal (Statewide)". Washington Secretary of State. 2008-03-07. Retrieved 2008-03-08.
- ↑ DeGolier, Cheryl (2008-04-06). "LD Caucus Results and Observations". Snohomish County Democrats. Retrieved 2008-04-27.
- ↑ "Yelm Starts Democrat Caucuses". The Olympian Online. Retrieved 2008-04-26.
- ↑ "2008 Legislative District Caucuses". 5th District Democrats. Archived from the original on 2008-04-10. Retrieved 2008-04-26.
- ↑ Brewer, Andrew. "Final Credentials Report April 5th 6th LD Caucus". 6th Legislative District Democrats. Retrieved 2008-04-28.
- ↑ Brede, Alene. "April 5th 11th LD Preliminary Caucus Results". 11th Legislative District Democrats. Retrieved 2008-04-28.
- ↑ "Caucus Results". Thurston County Democrats. Archived from the original on May 10, 2008. Retrieved 2008-05-10.
- ↑ "Caucus Results". Thurston County Democrats. Retrieved 2008-04-27.
- ↑ "LD Caucus Results were". Retrieved 2008-05-10.
- ↑ The 24th LD met at 3 different places: the Clallam, Grays Harbor, and Jefferson County Conventions. Clallam County portion "2008 Elected Delegates". Clallam Democrats. Archived from the original on 2008-06-24. Retrieved 2008-05-15. Jefferson County Portion "Results of the Jefferson County Convention, April 26, 2008". Jefferson County Democrats. Retrieved 2008-05-15. Grays Harbor portion (still waiting)
- ↑ Stokes, Charley. "HUNDREDS OF ENTHUSIASTIC DEMOCRATS FILL PHS AUDITORIUM" (PDF). 25th Legislative District Democrats. Retrieved 2008-05-10.
- ↑ "http://www.26dems.org/Pages/caucus.htm". External link in
|title=(help) - ↑ "27th LD CD Caucus and WS Convention Del and Alt 2008" (PDF). 27th Legislative District Democrats. Archived from the original (PDF) on September 9, 2008. Retrieved 2008-05-15.
- ↑ "http://www.31stdistrictdemocrats.org/LDcaucusdelegates.htm". External link in
|title=(help) - ↑ "http://32ld.snohomishdemocrats.org/?q=2008_LD_Caucus". External link in
|title=(help) - ↑ "http://www.33rddems.org/caucus2008.php". External link in
|title=(help) - ↑ "http://www.34dems.org/news_caucus-2008-ldresults.htm". External link in
|title=(help) - ↑ The 35th LD met at 4 different places: the Mason, Thurston, Grays Harbor, and Kitsap County Conventions. Mason County portion "Results". Mason County Democratic Central Committee. Retrieved 2008-04-28. Thurston County portion: "Caucus Results". Thurston County Democrats. Retrieved 2008-04-28.
- 1 2 "http://www.37dems.org/". External link in
|title=(help) - ↑ "http://www.snohomishdemocrats.org/?q=node/462". External link in
|title=(help) - ↑ "http://wa-democrats-39ld.org/". External link in
|title=(help) - ↑ The 40th LD met at 3 different places: the Whatcom County Convention, the Skagit County Convention, and San Juan county's 40th LD caucus. Skagit County portion: "Delegates by the Numbers". Skagit Valley Herald. 2008-04-13. pp. A–6. Whatcom County portion: McClendon, Natalie (2008-04-12). "Local Democrats Elect Delegates to Congressional District Caucus". Whatcom County Democrats. Retrieved 2008-04-28. San Juan portion: "San Juan 2008 Results of the 40th Legislative District Caucus". Democrats of San Juan County Washington. Retrieved 2008-04-28.
- ↑ "41st Legislative District Caucus Results". 41st District Democrats. 2008-04-11. Retrieved 2008-04-28.
- ↑ McClendon, Natalie (2008-04-12). "Local Democrats Elect Delegates to Congressional District Caucus". Whatcom County Democrats. Retrieved 2008-04-28.
- ↑ "Caucus Results". 43rd District Democrats of Washington. Retrieved 2008-04-28.
- ↑ DeWitt, Rick. "Legislative District Caucus". 44th Legislative District Democrats of Washington State. Archived from the original on August 19, 2008. Retrieved 2008-04-28.
- ↑ "45th LD Democrats - Caucus Information". 45th District Democrats. Retrieved 2008-04-28.
- ↑ "WA46Dems - LD Caucus Results". 46th District Democrats. Retrieved 2008-04-25.
- ↑ "LD Caucus Results". 47th District Democrats. Retrieved 2008-05-15.
- ↑ "LD Caucus Results". 48th District Democrats. Retrieved 2008-04-26.
- ↑ "WA National Delegate List". Obama Campaign. Retrieved 2008-05-20.
- ↑ Derived by deducting reported Obama numbers from total delegates for each CD.
- ↑ DeGolier, Cheryl (2008-05-19). "1st Congressional District Caucus Results". 1st District Democrats. Retrieved 2008-05-20.
- ↑ "CD Caucus Results". 46th District Democrats. Retrieved 2008-05-20.
- 1 2 3 "RESULTS: Washington". CNN. February 9, 2008. Retrieved February 9, 2008.
- ↑ "Mike Huckabee wants retraction, caucus recount". The Seattle Times. February 11, 2008.
- ↑ "Washington Caucus Updates Show McCain is Still GOP Winner, Despite Huckabee Challenge". FoxNews.com. February 12, 2008. Retrieved January 10, 2009.
- ↑ Nate Silver (March 2, 2012). "In Washington Caucus, Expect the Unexpected". FiveThirtyEight. Retrieved March 3, 2012.
- ↑ "President - Republican Party". Washington Secretary of State. 2008-03-07. Retrieved 2008-05-24.
- ↑ "CNN Map: Campaign money race".
- ↑ http://www.dcpoliticalreport.com/Predictions.html
- ↑ "Archived copy". Archived from the original on May 5, 2015. Retrieved May 4, 2015.
- ↑ Adnaan (2008-09-20). "Track the Electoral College vote predictions". The Takeaway. Archived from the original on April 22, 2009. Retrieved 2009-11-14.
- ↑ "Election Projection: 2008 Elections - Polls, Projections, Results". www.electionprojection.com. Retrieved 2016-09-22.
- ↑ "Electoral-vote.com: President, Senate, House Updated Daily". electoral-vote.com. Retrieved 2016-09-22.
- 1 2 3 4 Based on Takeaway
- ↑ "POLITICO's 2008 Swing State Map - POLITICO.com". www.politico.com. Retrieved 2016-09-22.
- ↑ http://www.realclearpolitics.com/epolls/maps/obama_vs_mccain/?map=5
- ↑ "CQ Presidential Election Maps, 2008". CQ Politics. Archived from the original on June 14, 2009. Retrieved December 20, 2009.
- ↑ Nagourney, Adam; Zeleny, Jeff; Carter, Shan (2008-11-04). "The Electoral Map: Key States". The New York Times. Retrieved May 26, 2010.
- ↑ "October – 2008 – CNN Political Ticker - CNN.com Blogs". CNN. 2008-10-31. Retrieved May 26, 2010.
- ↑ "Winning The Electoral College". Fox News. April 27, 2010.
- ↑ "roadto270". hosted.ap.org. Retrieved 2016-09-22.
- ↑ "Election 2008: Electoral College Update - Rasmussen Reports™". www.rasmussenreports.com. Retrieved 2016-09-22.
- ↑ http://www.fec.gov/DisclosureSearch/MapAppState.do?stateName=WA&cand_id=P00000001
- ↑ "Map: Campaign Ad Spending - Election Center 2008 from CNN.com". CNN. Retrieved May 26, 2010.
- ↑ "Map: Campaign Candidate Visits - Election Center 2008 from CNN.com". CNN. Retrieved May 26, 2010.
- ↑ "Electoral College". California Secretary of State. Archived from the original on October 30, 2008. Retrieved 2008-11-01.
- ↑ http://www.secstate.wa.gov/_assets/elections/Electoral%20College%20Democratic%20Pres%20Electors.pdf 2008 Democratic Electors and Alternate Electors in Washington State
- ↑ http://www.seattlepi.com/local/373598_elector05.html Lynnwood man may become one of first Muslim presidential electors in U.S.
- ↑ http://www.legistorm.com/person/Marcus_M_Riccelli/51077.html
- ↑ http://blog.seattlepi.nwsource.com/thebigblog/archives/145260.asp Washington's Muslim electors could help make history
- ↑ Roberts, Gregory; Modie, Neil (October 20, 2005). "Irons family feud airs on the Web". Seattle Post-Intelligencer.