United States presidential election in New Jersey, 2008
| | ||||||||||||||||||||||||||||||||
| ||||||||||||||||||||||||||||||||
| ||||||||||||||||||||||||||||||||
|
| ||||||||||||||||||||||||||||||||
| County Results
Obama—70-80%
Obama—60-70%
Obama—50-60%
McCain—50-60% | ||||||||||||||||||||||||||||||||
| ||||||||||||||||||||||||||||||||


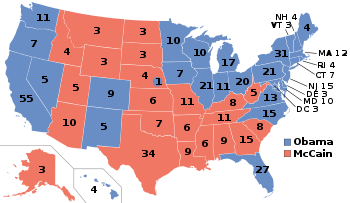
The 2008 United States presidential election in New Jersey took place on November 4, 2008 throughout all 50 states and D.C., which was part of the 2008 United States presidential election. Voters chose 15 representatives, or electors to the Electoral College, who voted for President and Vice President.
New Jersey was won by Democratic nominee Barack Obama with a 15.53% margin of victory. Prior to the election, all 17 news organizations considered this a state Obama would win, or otherwise considered as a safe blue state. No fundraising money was spent by either campaign, as the state has trended towards the Democratic Party in recent years. A highly affluent and predominantly urban state with an ethnically diverse population, New Jersey has become a reliably blue state, and this was evident again when Democrat Barack Obama comfortably won the state's 15 electoral votes with 57.14% of the vote.
Democratic primary
| | |||||||||||||||||||||||||
| |||||||||||||||||||||||||
| |||||||||||||||||||||||||

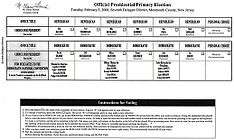
The Democratic primary took place February 5, 2008, also known as Super Tuesday. Hillary Clinton won this primary.
| Key: | Withdrew prior to contest |
| New Jersey Democratic presidential primary, 2008[1] | |||
|---|---|---|---|
| Candidate | Votes | Percentage | National delegates[2] |
| Hillary Clinton | 613,500 | 53.76% | 59 |
| Barack Obama | 501,372 | 43.93% | 48 |
| John Edwards | 15,728 | 1.38% | 0 |
| Joe Biden | 4,081 | 0.36% | 0 |
| Bill Richardson | 3,366 | 0.29% | 0 |
| Dennis Kucinich | 3,152 | 0.28% | 0 |
| Totals | 1,141,199 | 100.00% | 107 |
Republican primary
| | |||||||||||||||||||||||||||||||
| |||||||||||||||||||||||||||||||
| |||||||||||||||||||||||||||||||

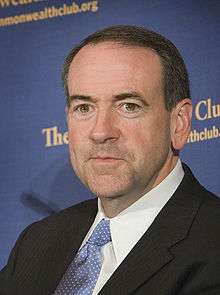
The Republican primary took place on February 5, 2008, with 52 national delegates.[3]
| Candidate | Votes | Percentage | Delegates |
|---|---|---|---|
| John McCain | 313,459 | 55.36% | 52 |
| Mitt Romney | 160,388 | 28.33% | 0 |
| Mike Huckabee | 46,284 | 8.17% | 0 |
| Ron Paul | 27,184 | 4.06% | 0 |
| Rudy Giuliani* | 15,516 | 2.74% | 0 |
| Fred Thompson* | 3,253 | 0.57% | 0 |
| Total | 566,201 | 100% | 52 |
* Candidate dropped out of the race before the primary
Predictions
| Elections in New Jersey | ||||||||
|---|---|---|---|---|---|---|---|---|
 | ||||||||
|
||||||||
|
||||||||
There were 17 news organizations who made state by state predictions of the election. Here are their last predictions before election day:
- D.C. Political Report: Democrat[5]
- Cook Political Report: Solid Democrat[6]
- Takeaway: Solid Obama[7]
- Election Projection: Solid Obama[8]
- Electoral-vote.com: Strong Democrat[9]
- Washington Post: Solid Obama[10]
- Politico: Solid Obama[11]
- Real Clear Politics: Solid Obama[12]
- FiveThirtyEight.com: Solid Obama[10]
- CQ Politics: Safe Democrat[13]
- New York Times: Solid Democrat[14]
- CNN: Safe Democrat[15]
- NPR: Solid Obama[10]
- MSNBC: Solid Obama[10]
- Fox News: Democrat[16]
- Associated Press: Democrat[17]
- Rasmussen Reports: Safe Democrat[18]
Polling
Pre-election polling was tight early on. However, since October 12, Obama won each poll with a double digit margin of victory and with at least 52%. McCain didn't reach over 42% in that stretch. The final 3 polls found Obama leading with 55% to 39%.[19]
Fundraising
John McCain raised a total of $4,761,251 in the state. Barack Obama raised $13,624,081.[20]
Advertising and visits
Neither candidate spent anything here.[21] The Republican ticket visited the state twice. Obama visited the state once.[22]
Analysis
New Jersey was once one of the most reliably Republican states in the Northeast. From 1948 to 1988, it voted Republican in all but two elections: John F. Kennedy in his narrow victory over Richard Nixon in 1960, and Lyndon Johnson's 44-state landslide of 1964. However, the brand of Republicanism practiced in New Jersey has historically been a moderate one. As the national party tilted more to the right, the state's voters became more friendly to Democrats. The state narrowly went for Bill Clinton in 1992 and has voted Democratic in every election since then. In all but one election since 1996, the Democrats have carried it by double digits. While Republicans remain competitive at the state and local level, at the presidential level New Jersey is now reckoned as part of the solid bloc of blue states in the Northeast.
Democrats have several structural advantages in New Jersey during presidential elections. The northeastern portion, including Newark, Jersey City, Elizabeth and Paterson, contains more than half the state's population and is heavily Democratic. The southwestern portion, including Camden and Cherry Hill, is also heavily Democratic. These regions have a total of over two million voters between them, making it extremely difficult for a Republican to carry the state. For instance, in 2004 George W. Bush held John Kerry to only a seven-point margin of victory, but was completely shut out in the northeast and southwest. Additionally, the state is split almost down the middle between the largest and fourth-largest markets in the country, New York City and Philadelphia. As a result, statewide races often feature some of the most expensive advertising budgets in the country.
In 2008, unlike in 2004, New Jersey was called for Obama almost as soon as the polls closed.[23] Obama dominated the urban areas of the state, winning Essex County by over 50%, Hudson County by 47%, Camden and Mercer counties by 35%. Obama also won Somerset County, which had voted Republican in every election from 1968 to 2004. Most of the southern portion of the state voted Democratic.
McCain won most of Northwestern New Jersey, winning in Republican strongholds like Morris County and Sussex County (which McCain won by 21%). McCain also won most of the Jersey Shore counties.
At the same time, incumbent Democratic U.S. Senator Frank Lautenberg was reelected over Republican Dick Zimmer by a 14.08-percent margin of victory. Lautenberg received 56.03% of the total vote while Zimmer took in 41.95%. Democrats also picked up a vacant U.S. House seat in New Jersey's 3rd congressional district that was previously held by a Republican; Democrat John Adler defeated Republican Chris Myers by a 3.30-percent margin of victory. Adler received 51.65% of the vote while Myers took in 48.35%.
Results
| United States presidential election in New Jersey, 2008 | ||||||
|---|---|---|---|---|---|---|
| Party | Candidate | Running mate | Votes | Percentage | Electoral votes | |
| Democratic | Barack Obama | Joe Biden | 2,215,422 | 57.14% | 15 | |
| Republican | John McCain | Sarah Palin | 1,613,207 | 41.61% | 0 | |
| Independent | Ralph Nader | Matt Gonzalez | 21,298 | 0.55% | 0 | |
| Libertarian | Bob Barr | Wayne Allyn Root | 8,441 | 0.22% | 0 | |
| Write-ins | Write-ins | 7,718 | 0.20% | 0 | ||
| Constitution | Chuck Baldwin | Darrell Castle | 3,956 | 0.10% | 0 | |
| Green | Cynthia McKinney | Rosa Clemente | 3,636 | 0.09% | 0 | |
| Socialist | Brian Moore | Stewart Alexander | 669 | 0.02% | 0 | |
| Vote Here | Jeffrey Boss | Andrea Maria Boss | 639 | 0.02% | 0 | |
| Socialist Workers | Róger Calero | Alyson Kennedy | 523 | 0.01% | 0 | |
| Socialism and Liberation | Gloria La Riva | Eugene Puryear | 416 | 0.01% | 0 | |
| Totals | 3,877,323 | 100.00% | 15 | |||
| Voter Turnout (Voting age/Registered) | 60%/73% | |||||
By county

-Blue municipalities won by Obama
-Red municipalities won by McCain
-Purple municipality (only Andover Borough) tied by Obama and McCain

| County | Obama % | Obama # | McCain % | McCain # | Others % | Others # |
| Atlantic | 56.9% | 67,830 | 41.8% | 49,902 | 1.3% | 1,157 |
| Bergen | 54.2% | 225,367 | 44.7% | 186,118 | 1.1% | 4,424 |
| Burlington | 58.6% | 131,219 | 40.1% | 89,626 | 1.3% | 2,930 |
| Camden | 67.2% | 159,259 | 31.2% | 68,317 | 1.4% | 3,304 |
| Cape May | 44.9% | 22,893 | 53.5% | 27,288 | 1.6% | 802 |
| Cumberland | 60.0% | 34,919 | 38.4% | 22,360 | 1.6% | 915 |
| Essex | 75.9% | 240,306 | 23.4% | 73,975 | 0.7% | 2,181 |
| Gloucester | 55.2% | 77,267 | 43.1% | 60,315 | 1.7% | 2,364 |
| Hudson | 72.8% | 154,140 | 26.2% | 52,354 | 1.0% | 2,116 |
| Hunterdon | 42.5% | 29,776 | 55.8% | 39,092 | 1.6% | 1,147 |
| Mercer | 67.3% | 107,926 | 31.3% | 50,397 | 1.4% | 2,229 |
| Middlesex | 60.2% | 193,812 | 38.4% | 122,586 | 1.4% | 4,367 |
| Monmouth | 47.5% | 148,737 | 51.2% | 160,433 | 1.4% | 4,244 |
| Morris | 45.4% | 112,275 | 53.5% | 132,331 | 1.2% | 2,913 |
| Ocean | 40.1% | 110,189 | 58.4% | 160,677 | 1.5% | 4,111 |
| Passaic | 60.3% | 113,257 | 38.7% | 71,850 | 1.0% | 1,904 |
| Salem | 50.9% | 16,044 | 47.0% | 14,816 | 2.1% | 672 |
| Somerset | 52.4% | 79,321 | 46.3% | 70,085 | 1.3% | 2,024 |
| Sussex | 38.8% | 28,840 | 59.4% | 44,184 | 1.9% | 1,393 |
| Union | 63.6% | 141,417 | 35.4% | 78,768 | 1.0% | 2,241 |
| Warren | 42.0% | 20,628 | 56.0% | 27,500 | 2.0% | 980 |
By congressional district
Barack Obama carried 10 of the state’s 13 congressional districts in New Jersey, including two districts held by Republicans. .
| District | McCain | Obama | Representative |
|---|---|---|---|
| 1st | 34.00% | 64.80% | Rob Andrews |
| 2nd | 44.71% | 54.00% | Frank LoBiondo |
| 3rd | 46.76% | 52.14% | H. James Saxton (110th Congress) |
| John Adler (111th Congress) | |||
| 4th | 52.30% | 46.49% | Chris Smith |
| 5th | 53.55% | 45.43% | Scott Garrett |
| 6th | 39.40% | 59.49% | Frank Pallone, Jr. |
| 7th | 47.69% | 51.16% | Mike Ferguson (110th Congress) |
| Leonard Lance (111th Congress) | |||
| 8th | 35.89% | 63.31% | Bill Pascrell |
| 9th | 38.08% | 61.05% | Steve Rothman |
| 10th | 12.61% | 86.95% | Donald M. Payne |
| 11th | 53.68% | 45.36% | Rodney Frelinghuysen |
| 12th | 40.86% | 58.09% | Rush D. Holt, Jr. |
| 13th | 24.32% | 74.84% | Albio Sires |
Electors
Technically the voters of NJ cast their ballots for electors: representatives to the Electoral College. NJ is allocated 15 electors because it has 13 congressional districts and 2 senators. All candidates who appear on the ballot or qualify to receive write-in votes must submit a list of 15 electors, who pledge to vote for their candidate and his or her running mate. Whoever wins the majority of votes in the state is awarded all 15 electoral votes. Their chosen electors then vote for President and Vice President. Although electors are pledged to their candidate and running mate, they are not obligated to vote for them.[24] An elector who votes for someone other than his or her candidate is known as a faithless elector.
The electors of each state and the District of Columbia met on December 15, 2008 to cast their votes for President and Vice President. The Electoral College itself never meets as one body. Instead the electors from each state and the District of Columbia met in their respective capitols.
The following were the members of the Electoral College from the state. All 15 were pledged to Barack Obama and Joe Biden:[25]
- Jose Colon
- William Fontanez
- Gina Genovese
- Wilma Grey
- Kevin Halpern
- Victor Herlinsky
- Stacy Lubrecht
- Salaheddin Mustafa
- Peter Nichols
- William W. Northgrave
- Ken Saunders
- Ginger Gold Schnitzer
- Carl Styles
- Shavonda Sumter
- Stephen Weinstein
See also
References
- ↑ The Green Papers
- ↑ New York Times Election Guide 2008
- ↑ "New Jersey Republican Delegation 2008". The Green Papers. Retrieved 2008-01-28.
- ↑ "Official Presidential Primary Election Results" (PDF). New Jersey Department of State. Retrieved 2008-05-24.
- ↑ D.C.'s Political Report: The complete source for campaign summaries
- ↑ Presidential | The Cook Political Report Archived May 5, 2015, at the Wayback Machine.
- ↑ Adnaan (September 20, 2008). "Track the Electoral College vote predictions". The Takeaway. Archived from the original on April 22, 2009. Retrieved November 14, 2009.
- ↑ Election Projection: 2008 Elections - Polls, Projections, Results
- ↑ Electoral-vote.com: President, Senate, House Updated Daily
- 1 2 3 4 Based on Takeaway
- ↑ POLITICO's 2008 Swing State Map - POLITICO.com
- ↑ RealClearPolitics - Electoral Map
- ↑ CQ Politics | CQ Presidential Election Maps, 2008 Archived October 29, 2008, at the Wayback Machine.
- ↑ "Electoral College Map". The New York Times. Retrieved May 26, 2010.
- ↑ "October – 2008 – CNN Political Ticker - CNN.com Blogs". CNN. Retrieved May 26, 2010.
- ↑ "Winning the Electoral College". Fox News. April 27, 2010.
- ↑ roadto270
- ↑ Election 2008: Electoral College Update - Rasmussen Reports™
- ↑ Election 2008 Polls - Dave Leip's Atlas of U.S. Presidential Elections
- ↑ Presidential Campaign Finance
- ↑ "Map: Campaign Ad Spending - Election Center 2008 from CNN.com". CNN. Retrieved May 26, 2010.
- ↑ "Map: Campaign Candidate Visits - Election Center 2008 from CNN.com". CNN. Retrieved May 26, 2010.
- ↑ http://uselectionatlas.org/INFORMATION/ARTICLES/ElectionNight2008/pe2008elecnighttime.php
- ↑ "Electoral College". California Secretary of State. Archived from the original on October 30, 2008. Retrieved November 1, 2008.
- ↑ U. S. Electoral College 2008 Election - Certificates