United States presidential election in New Mexico, 2008
| | ||||||||||||||||||||||||||||||||
| ||||||||||||||||||||||||||||||||
| ||||||||||||||||||||||||||||||||
|
| ||||||||||||||||||||||||||||||||
| County Results
Obama—80-90%
Obama—70-80%
Obama—60-70%
Obama—50-60%
McCain—50-60%
McCain—60-70%
McCain—70-80% | ||||||||||||||||||||||||||||||||
| ||||||||||||||||||||||||||||||||

| Elections in New Mexico |
|---|
 |
|
General elections |
|
|
|
|
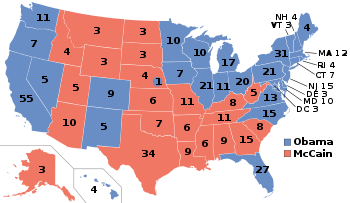
The 2008 United States presidential election in New Mexico took place on November 4, 2008 throughout all 50 states and D.C., which was part of the 2008 United States presidential election. Voters chose 5 representatives, or electors to the Electoral College, who voted for President and Vice President.
New Mexico was won by the Democratic nominee, Senator Barack Obama of Illinois, by a 15.13% margin of victory. Obama took 56.91% of the vote while his Republican opponent, Senator John McCain of Arizona, took 41.78%. Prior to the election, all 17 news organizations considered this a state Obama would win, or otherwise considered as a safe blue state. Due to the extremely narrow margins of victory in the past two presidential elections, it started out as a swing state, but hypothetical general election match-up polls taken in the state continued to show a big lead for Democrat Barack Obama. Obama's leads in the polls in New Mexico increased so much that Republican presidential nominee John McCain did not campaign nearly as much in the Land of Enchantment as he did elsewhere, despite it neighboring his home state of Arizona. A large Hispanic and Native American as well as trending Democratic population put Barack Obama over the top.[1]
Primaries
Campaign
Predictions
There were 17 news organizations who made state by state predictions of the election. Here are their last predictions before election day:
- D.C. Political Report: Democrat[2]
- Cook Political Report: Leaning Democrat[3]
- Takeaway: Solid Obama[4]
- Election Projection: Solid Obama[5]
- Electoral-vote.com: Leaning Democrat[6]
- Washington Post: Leaning Obama[7]
- Politico: Leaning Obama[8]
- Real Clear Politics: Leaning Obama[9]
- FiveThirtyEight.com: Solid Obama[7]
- CQ Politics: Safe Democrat[10]
- New York Times: Solid Democrat[11]
- CNN: Safe Democrat[12]
- NPR: Solid Obama[7]
- MSNBC: Solid Obama[7]
- Fox News: Democrat[13]
- Associated Press: Democrat[14]
- Rasmussen Reports: Safe Democrat[15]
Polling
Obama won a majority of the pre-election polls taken in the state, including sweeping all them taken after September 14. The final 3 polls averaged the Democrat leading 55% to 43%.[16]
Fundraising
John McCain raised a total of $1,016,376 in the state. Barack Obama raised $3,987,438.[17]
Advertising and visits
Obama and his interest groups spent $4,535,378. McCain and his interest groups spent $3,606,796.[18] The Democrat ticket visited the state 5 times to the Republican's 8 times.[19]
Analysis
The key voting bloc in this state is Hispanics, which makes up a plurality of the state's total population with 45%. George W. Bush enjoyed good popularity with Hispanic voters and received over 40% of the Hispanic vote nationally in 2004. This support was enough for Bush to nip John Kerry by approximately 6,000 votes in New Mexico in 2004. In the previous election, New Mexico had been a very close swing state. Al Gore won the state by only 300 votes in 2000, which was even narrower than the controversial results in Florida. However, after the 2004 presidential election, support for Bush in the Hispanic community collapsed. During the 2008 election, New Mexico was regarded as an Obama-leaning state despite the fact that John McCain was from neighboring Arizona and held similar views on illegal immigration to those of Bush. Ultimately, McCain was only able to obtain 30% of the Hispanic vote.
Native Americans also represent a key voting demographic in New Mexico.[20] Obama won the Native American vote 78-21 and carried most of the counties within the confines of the Navajo Nation.[21]
The Republican base in New Mexico consists of the more rural southeastern part of the state which, while thinly populated, votes heavily Republican. Democrats are strongest in the state capital, Santa Fe and its close-in suburbs. The city of Albuquerque and the southwestern part of the state both lean Democratic, but not as overwhelmingly as does Santa Fe. On a larger context, Southern New Mexico is typically more Republican while Northern New Mexico is traditionally more Democratic, while Albuquerque and other areas in the center tend to swing both ways.
In 2008, Obama carried the state by a robust 15-point margin, largely by dominating the Albuquerque area. He won Bernalillo County, home to Albuquerque himself, by 21 points; Kerry had only won it by four points in 2004. While McCain dominated the southeastern part of the state, it was not nearly enough to overcome Obama's edge in the Albuquerque area.[22]
During the same election, former Democratic U.S. Representative Tom Udall, who had represented New Mexico's 3rd Congressional District in the U.S. House of Representatives, defeated former Republican U.S. Representative Steve Pearce, who had represented New Mexico's 2nd congressional district, for an open U.S. Senate seat that was vacated by Republican Pete Domenici once it was discovered that he had brain cancer. Former Republican U.S. Representative Heather Wilson, who represented New Mexico's 1st Congressional District, vacated her seat to challenge Pearce in the GOP senatorial primary only to inevitably lose the nomination to him. As a result, all three of New Mexico's U.S. House seats were up for grabs, and Democrats captured all three of them. At the state level, Democrats increased their majorities in both houses of the New Mexico Legislature, picking up three seats in both the New Mexico House of Representatives and New Mexico Senate.
Results
| United States presidential election in New Mexico, 2008 | ||||||
|---|---|---|---|---|---|---|
| Party | Candidate | Running mate | Votes | Percentage | Electoral votes | |
| Democratic | Barack Obama | Joe Biden | 472,422 | 56.91% | 5 | |
| Republican | John McCain | Sarah Palin | 346,832 | 41.78% | 0 | |
| Independent | Ralph Nader | Matt Gonzalez | 5,327 | 0.64% | 0 | |
| Libertarian | Bob Barr | Wayne Allyn Root | 2,428 | 0.29% | 0 | |
| Constitution | Chuck Baldwin | Darrell Castle | 1,597 | 0.19% | 0 | |
| Green | Cynthia McKinney | Rosa Clemente | 1,552 | 0.19% | 0 | |
| Totals | 830,158 | 100.00% | 5 | |||
| Voter turnout (Voting age population) | 56.4% | |||||
Results breakdown

By county
| County | Obama% | Obama# | McCain% | McCain# | Total |
|---|---|---|---|---|---|
| Bernalillo | 60.66% | 168,406 | 39.34% | 109,212 | 277,618 |
| Catron | 32.07% | 659 | 67.93% | 1,396 | 2,055 |
| Chaves | 37.45% | 8,160 | 62.55% | 13,630 | 21,790 |
| Cibola | 64.91% | 3,176 | 35.09% | 1,717 | 4,893 |
| Colfax | 55.31% | 3,465 | 44.69% | 2,800 | 6,265 |
| Curry | 32.69% | 4,655 | 67.31% | 9,585 | 14,240 |
| DeBaca | 34.62% | 358 | 65.38% | 676 | 1,034 |
| Doña Ana | 58.64% | 38,574 | 41.36% | 27,211 | 65,785 |
| Eddy | 36.89% | 7,289 | 63.11% | 12,468 | 19,757 |
| Grant | 60.06% | 8,092 | 39.94% | 5,381 | 13,473 |
| Guadalupe | 71.47% | 1,541 | 28.53% | 615 | 2,156 |
| Harding | 41.76% | 256 | 58.24% | 357 | 613 |
| Hidalgo | 51.46% | 990 | 48.54% | 934 | 1,924 |
| Lea | 27.65% | 5,084 | 72.35% | 13,301 | 18,385 |
| Lincoln | 37.09% | 3,482 | 62.91% | 5,906 | 9,388 |
| Los Alamos | 53.38% | 5,709 | 46.62% | 4,986 | 10,695 |
| Luna | 52.65% | 4,289 | 47.35% | 3,857 | 8,146 |
| McKinley | 72.12% | 15,993 | 27.88% | 6,183 | 22,176 |
| Mora | 79.24% | 2,156 | 20.76% | 565 | 2,721 |
| Otero | 40.21% | 8,602 | 59.79% | 12,791 | 21,393 |
| Quay | 39.55% | 1,546 | 60.45% | 2,363 | 3,909 |
| Rio Arriba | 75.51% | 11,245 | 24.49% | 3,648 | 14,893 |
| Roosevelt | 34.63% | 2,270 | 65.37% | 4,285 | 6,555 |
| San Juan | 39.16% | 17,645 | 60.84% | 27,418 | 45,063 |
| San Miguel | 80.71% | 10,128 | 19.29% | 2,421 | 12,549 |
| Sandoval | 56.33% | 32,102 | 43.67% | 24,887 | 56,989 |
| Santa Fe | 77.70% | 53,802 | 22.30% | 15,443 | 69,245 |
| Sierra | 43.85% | 2,351 | 56.15% | 3,011 | 5,362 |
| Socorro | 60.66% | 4,643 | 39.34% | 3,011 | 7,654 |
| Taos | 82.56% | 13,384 | 17.44% | 2,827 | 16,211 |
| Torrance | 45.19% | 3,068 | 54.81% | 3,721 | 6,789 |
| Union | 28.77% | 492 | 71.23% | 1,218 | 1,710 |
| Valencia | 53.74% | 15,142 | 46.26% | 13,033 | 28,175 |
By congressional district
Barack Obama carried two of the state’s three congressional districts in New Mexico, while John McCain just narrowly carried the other congressional district that simultaneously elected a Democrat to the U.S. House of Representatives.
| District | McCain | Obama | Representative |
|---|---|---|---|
| 1st | 39.64% | 60.07% | Heather Wilson (110th Congress) |
| Martin Heinrich (111th Congress) | |||
| 2nd | 49.97% | 48.64% | Steve Pearce (110th Congress) |
| Harry Teague (111th Congress) | |||
| 3rd | 37.79% | 61.01% | Tom Udall (110th Congress) |
| Ben R. Luján (111th Congress) |
Electors
Technically the voters of New Mexico cast their ballots for electors: representatives to the Electoral College. New Mexico is allocated five electors because it has three congressional districts and two senators. All candidates who appear on the ballot or qualify to receive write-in votes must submit a list of five electors, who pledge to vote for their candidate and his or her running mate. Whoever wins the majority of votes in the state is awarded all five electoral votes. Their chosen electors then vote for President and Vice President. Although electors are pledged to their candidate and running mate, they are not obligated to vote for them.[23] An elector who votes for someone other than his or her candidate is known as a faithless elector.
The electors of each state and the District of Columbia met on December 15, 2008 to cast their votes for President and Vice President. The Electoral College itself never meets as one body. Instead the electors from each state and the District of Columbia met in their respective capitols.
The following were the members of the Electoral College from the state. All five were pledged to Barack Obama and Joe Biden:[24]
- Brian Colon
- Annadelle Sanchez
- Tom Buckner
- Christy French
- Alvin Warren
References
- ↑ Cost, Jay; Sean Trende (2009-01-18). "Election Review, Part 3: The West". RealClearPolitics. Retrieved 2009-05-11.
- ↑ D.C.'s Political Report: The complete source for campaign summaries
- ↑ Presidential | The Cook Political Report Archived May 5, 2015, at the Wayback Machine.
- ↑ Adnaan (2008-09-20). "Track the Electoral College vote predictions". The Takeaway. Archived from the original on April 22, 2009. Retrieved 2009-11-14.
- ↑ Election Projection: 2008 Elections - Polls, Projections, Results
- ↑ Electoral-vote.com: President, Senate, House Updated Daily
- 1 2 3 4 Based on Takeaway
- ↑ POLITICO's 2008 Swing State Map - POLITICO.com
- ↑ RealClearPolitics - Electoral Map
- ↑ CQ Politics | CQ Presidential Election Maps, 2008 Archived October 29, 2008, at the Wayback Machine.
- ↑ "Electoral College Map". The New York Times. Retrieved 2010-05-26.
- ↑ "October – 2008 – CNN Political Ticker - CNN.com Blogs". CNN. Retrieved 2010-05-26.
- ↑ "Winning the Electoral College". Fox News. 2010-04-27.
- ↑ roadto270
- ↑ Election 2008: Electoral College Update - Rasmussen Reports™
- ↑ Election 2008 Polls - Dave Leip's Atlas of U.S. Presidential Elections
- ↑ Presidential Campaign Finance
- ↑ "Map: Campaign Ad Spending - Election Center 2008 from CNN.com". CNN. Retrieved 2010-05-26.
- ↑ "Map: Campaign Candidate Visits - Election Center 2008 from CNN.com". CNN. Retrieved 2010-05-26.
- ↑ "Paying Attention to the Native American Vote".
- ↑ "New Mexico - Election Results 2008 - The New York Times". elections.nytimes.com. Retrieved 2016-08-31.
- ↑ "Election Results 2008". New York Times. Archived from the original on November 3, 2004. Retrieved 2009-05-11.
- ↑ "Electoral College". California Secretary of State. Archived from the original on October 30, 2008. Retrieved 2008-11-01.
- ↑ New Mexico Secretary of State's office Archived November 29, 2008, at the Wayback Machine.