United States presidential election in South Carolina, 2008
| | ||||||||||||||||||||||||||||||||
| ||||||||||||||||||||||||||||||||
| ||||||||||||||||||||||||||||||||
|
| ||||||||||||||||||||||||||||||||
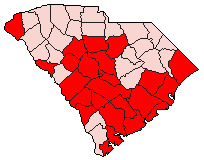
| County Results
Obama—70-80%
Obama—60-70%
Obama—50-60%
Obama—<50%
McCain—<50%
McCain—50-60%
McCain—60-70%
McCain—70-80% | ||||||||||||||||||||||||||||||||
| ||||||||||||||||||||||||||||||||


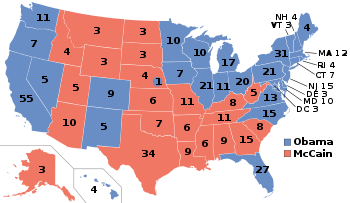
The 2008 United States presidential election in South Carolina took place on November 4, 2008 throughout all 50 states and D.C., which was part of the 2008 United States presidential election. Voters chose 8 representatives, or electors to the Electoral College, who voted for President and Vice President.
South Carolina was won by Republican nominee John McCain by a 9.0% margin of victory. Prior to the election, all 17 news organizations considered this a state McCain would win, or otherwise considered as a safe red state. Despite the significant proportion of African Americans in the state, South Carolina still remains, like most other states throughout the South, a GOP stronghold at the state and federal levels. Republican John McCain kept South Carolina in the GOP column in 2008, clinching 53.87% of the vote.
Primaries
For both parties in 2008, South Carolina's was the first primary in a Southern state and the first primary in a state in which African Americans make up a sizable percentage of the electorate. For Democrats, it was also the last primary before 22 states hosted their primaries or caucuses on February 5, 2008 (Super Tuesday).
Democratic primary
| | |||||||||||||||||||||||||||||||
| |||||||||||||||||||||||||||||||
| |||||||||||||||||||||||||||||||
|
| |||||||||||||||||||||||||||||||
| Election results by county. Light Blue denotes counties won by Obama, Dodger Blue denotes those won by Clinton, and Dark Blue denotes those won by Edwards. | |||||||||||||||||||||||||||||||

The 2008 South Carolina Democratic presidential primary took place on January 26, 2008. Senator Barack Obama of Illinois won the primary's popular vote by a 28.9% margin.
South Carolina's 45 delegates to the 2008 Democratic National Convention were awarded proportionally based on the results of the primary. The state also sent nine superdelegates.[1]
Candidates
Remaining
- New York Senator Hillary Clinton
- Former North Carolina Senator John Edwards
- Former Alaska Senator Mike Gravel
- Illinois Senator Barack Obama
Eliminated
- Delaware Senator Joe Biden Dropped out on January 4, 2008[2]
- Connecticut Senator Chris Dodd Dropped out on January 4, 2008
- New Mexico Governor Bill Richardson Dropped out on January 10, 2008[3]
- Ohio Representative Dennis Kucinich Dropped out on January 25, 2008[4]
- New York Comedian Stephen Colbert Denied Ballot (13-3) on November 1, 2007[5] and dropped out November 5, 2007[6]
Campaign Finances
On the day of the South Carolina primary, Senator John Edwards led in fund raising from the state of South Carolina, followed by Barack Obama and Bill Richardson.
Obtained from CNN as of January 26, 2008[7]
| Candidate | Money raised (US$) |
|---|---|
| John Edwards | $316,319 |
| Barack Obama | $257,118 |
| Bill Richardson | $196,850 |
| Hillary Clinton | $131,950 |
| Joe Biden | $55,350 |
| Chris Dodd | $22,750 |
| Dennis Kucinich | $3,750 |
Polling leading up to primary
All monthly averages were retrieved from RealClearPolitics.[8]
| Candidate | November | December | January | Final 3 Polls Averages |
|---|---|---|---|---|
| Hillary Clinton | 40% | 34% | 27% | 28% |
| Barack Obama | 27% | 33% | 41% | 48% |
| John Edwards | 11% | 15% | 17% | 23% |
- Denotes Leader during Poll Average
Despite maintaining a major early lead in the polls, Senator Clinton rapidly fell after the Iowa Caucuses, as Barack Obama skyrocketed and John Edwards began to receive a gradual increase in the polling.
However, in the last three polls taken before the South Carolina Primary, Barack Obama took a commanding lead over both Edwards and Clinton. Also, Former Senator John Edwards had come into the margin of error with Senator Clinton for second place in the South Carolina Primary.
Final Campaigning
Obama Campaign
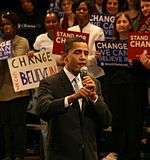
Throughout the South Carolina campaign, most pundits had predicted Barack Obama the winner, primarily because of the state's large African-American population. For this reason, Obama was shown to be significantly ahead of his two rivals, John Edwards, who carried the state in 2004, and Hillary Clinton, whose husband was popular in the African-American community. In early polls taken in the weeks leading up to the primary, Clinton had a double-digit lead over both Edwards and Obama (see poll averages above).
During a majority of the final campaigning, the attacks between the Clinton campaign and the Obama campaign highly intensified by the candidates as well as the media coverage. Barack Obama began to attack former President Bill Clinton for his comments which were taken as racist. These comments are considered by analyst and historians alike as the turning point of the South Carolina primary and ultimately the cause of Clinton's loss of support from the black community.
Despite the increasing tensions between the Clinton and Obama camps, Obama continued to widely lead in the polls (despite a surge by Edwards). Into the final days of the campaign in South Carolina, it became apparent that Obama would win by a rather wide margin. The final tally had Obama winning by 28.9% over his closest rival, Hillary Clinton.
Clinton Campaign
In the early months of the campaign, Clinton enjoyed a steep lead over Senator Obama, and a 30-point lead over former Senator John Edwards. However, after Obama's win in Iowa, Clinton's campaign in South Carolina began to fall apart by the Obama political machine rolling into South Carolina with force.
For Clinton, despite winning the popular vote in Nevada, the fact that she had lost Nevada's National Delegates, receiving 12 compared to Obama's 13 still lingered in the media. This, combined with the fact of Bill Clinton's continuing negative publicity from "injecting race into the campaign" as several people called Bill Clinton's actions in his wife's campaign.
Between battling media scrutiny on Bill Clinton, constant attacks between the Obama and Clinton campaigns, and a surging John Edwards which threatened a Clinton second-place finish, poll number began to plunge, with a poll taken by Reuters-Cspan-Zogby showing Clinton in the margin of error for second place with Edwards, with Edwards at 21% and Clinton at 25%. This was also combined with the fact of Edwards's constant barrage of attacks claiming Clinton (and Obama's) big city politics were "too good for the people of South Carolina".
However, despite the attacks from opponents that Bill Clinton's attacks largely alienated African-Americans, Clinton was able to keep a 35% support amongst that key constituency, while losing the white vote to Edwards, In the end, Clinton's African-American support was able to place her in a clear second-place finish, finishing 9 points ahead of John Edwards despite losing to Obama by 29 points.
Edwards Campaign
After the terrible results for the Edwards Campaign during the Nevada caucuses, in which Edwards finished in third with 4% of the state delegation and received no national delegates, South Carolina began to look as a state where he needed a strong finish, after finishing in third in the last three primaries which took place, and trailing in the number of total national delegates.
South Carolina was the state in which Edwards was born and raised. In 2004, Edwards won the South Carolina Primary, with 45% of the vote to John Kerry's 30% and Al Sharpton's 10%. While entering South Carolina, it become apparent that he needed a first-place finish, which seemed impossible, or a second-place finish, which seemed more within grasp.
Before the CNN South Carolina Debate in Myrtle Beach on Monday, January 21, 2008, John Edwards was placing a distant third in a poll taken before the debates on January 19, in which he placed third with 15% compared to Hillary Clinton's second place with 27%.[9] However, after the South Carolina debates, the tone of the campaign severely shifted.
During the South Carolina Democratic Debate in Myrtle Beach, Edwards sought to distinguish himself from Senators Obama and Clinton, and criticized them for their attacks and "big city" politics. As soon as he began to question how the attacks helped, he was widely cheered by the audience for in what many people thought was what distinguished Edwards from negative campaigning. Saying "This kind of squabbling, how many children are going to get healthcare? How many people are going to get an education from this? How many kids are going to be able to go to college because of this? We have got to understand and I respect both of my fellow candidates, but we have got to understand that this is not about us personally, it is about what we are trying to do for this country and what we believe in", Edwards began to get applause from several members of the audience.[10]
After the debate, John Edwards began to see a major influx of money and in turn, poll numbers began to rise rapidly in Edwards's favor. Along with the debate performance, Bill Clinton's remarks began to alienate black supporters from Clinton, and white supporters from Obama. As a result, Edwards won amongst white voters ages 30 to 50, while receiving the same amount of support from white 60+ year olds as Hillary Clinton according to CNN Exit Polls[11]
However, Edwards was not able to get much support from non-whites, and according to Exit Polls, received only 2% of the non-white support, while receiving 40% of the white support.
Results
Barack Obama won the primary, taking 44 of the 46 counties; Edwards won in his native Oconee County, while Clinton won in Horry County, which contains Myrtle Beach.[12]
| Key: | Withdrew prior to contest |
| South Carolina Democratic presidential primary, 2008[13] | ||||
|---|---|---|---|---|
| Candidate | Results[14] | Estimated national delegates[14][15] | ||
| Votes | Percentage | National delegates | ||
| Barack Obama | 295,214 | 55.44% | 25 | 33 |
| Hillary Clinton | 141,217 | 26.52% | 12 | 12 |
| John Edwards | 93,576 | 17.57% | 8 | 0 |
| Bill Richardson | 727 | 0.14% | 0 | 0 |
| Joe Biden | 694 | 0.13% | 0 | 0 |
| Dennis Kucinich | 552 | 0.1% | 0 | 0 |
| Christopher Dodd | 247 | 0.05% | 0 | 0 |
| Mike Gravel | 241 | 0.05% | 0 | 0 |
| Totals | 532,468 | 100.00% | 45 | 45 |
Republican primary
| | |||||||||||||||||||||||||||||||
| |||||||||||||||||||||||||||||||
| |||||||||||||||||||||||||||||||
|
| |||||||||||||||||||||||||||||||
| Election results by county. Red denotes counties won by McCain, and Pink denotes those won by Huckabee. | |||||||||||||||||||||||||||||||
The South Carolina Republican primary, 2008 was held on January 19, with 24 delegates at stake.[16] The Republican National Committee took half of South Carolina's 47 delegates away from them because the state committee moved its Republican primary before February 5.[16][17] It was held on the same day as the Nevada Republican caucuses, 2008.
The primary has become one of several key early state nominating contests in the process of choosing the nominee of the Republican party for the November 2008 election for President of the United States. It has historically been more important for the Republican Party than for the Democratic Party; from its inception in 1980 through the election of 2000, the winner of the Republican presidential primary has gone on to win the nomination.[18] As of 2008, the primary has cemented its place as the "First in the South" primary for both parties.[19]
This states 24 delegates would be awarded on a "Winner-Takes-All" basis. 12 Delegates for the Statewide winner and 12 delegates awarded on a District-winner basis awarding 2 delegates for each of the states then 6 Congressional districts.[20]
Polling
As of January 19, RealClearPolitics reported that the average support from polls placed McCain in the lead with 26.9%, followed by Huckabee with 25.9%, Romney with 14.7%, Thompson with 14.6%, Paul with 4.4%, and Giuliani with 3.4%.[21]
Results
Huckabee was for weeks leading in the state but lost by a 14,743 vote margin. He did manage to win Congressional districts 3, 4 and 5 in the North of the state earning him a total of 6 delegates.[20]

John McCain won the statewide primary earning him 12 Delegates[22][23][24] as well as Congressional Districts 1, 2 and 6. earning him an additional 6 delegates for a total of 18.[20]
| Candidate | Votes | Percentage | Delegates |
|---|---|---|---|
| John McCain | 147,733 | 33.15% | 18 |
| Mike Huckabee | 132,990 | 29.84% | 6 |
| Fred Thompson | 69,681 | 15.63% | 0 |
| Mitt Romney | 68,177 | 15.3% | 0 |
| Ron Paul | 16,155 | 3.62% | 0 |
| Rudy Giuliani | 9,575 | 2.15% | 0 |
| Duncan Hunter* | 1,051 | 0.24% | 0 |
| Tom Tancredo* | 121 | 0.03% | 0 |
| Hugh Cort | 88 | 0.02% | 0 |
| John H. Cox | 83 | 0.02% | 0 |
| Cap Fendig | 23 | 0.01% | 0 |
| Total | 445,677 | 100% | 24 |
* Candidate withdrew his bid for the nomination prior to the reporting of the primary. On January 22, 2008 after a poor showing Fred Thompson dropped out of the race. Duncan Hunter did so too.
Results of prior primaries
- 1980: Ronald Reagan won with 54%, defeating runner-up John Connally.[26]
- 1984: Uncontested (Reagan was the incumbent president and was re-nominated).[26]
- 1988: George H. W. Bush won with 49%, defeating runner-up Bob Dole.[26]
- 1992: George H. W. Bush won with 68%, defeating runner-up Pat Buchanan.[26]
- 1996: Bob Dole won with 45%, defeating runner-up Pat Buchanan.[26]
- 2000: George W. Bush won with 53%, defeating runner-up John McCain.[26]
- 2004: Uncontested (Bush was the incumbent president and was re-nominated).
Campaign
Predictions
There were 17 news organizations who made state by state predictions of the election. Here are their last predictions before election day:
- D.C. Political Report: Republican[27]
- Cook Political Report: Solid Republican[28]
- Takeaway: Solid McCain[29]
- Election Projection: Solid McCain[30]
- Electoral-vote.com: Strong Republican[31]
- Washington Post: Solid McCain[32]
- Politico: Solid McCain[33]
- Real Clear Politics: Solid McCain[34]
- FiveThirtyEight.com: Solid McCain[32]
- CQ Politics: Safe Republican[35]
- New York Times: Solid Republican[36]
- CNN: Safe Republican[37]
- NPR: Solid McCain[32]
- MSNBC: Solid McCain[32]
- Fox News: Republican[38]
- Associated Press: Republican[39]
- Rasmussen Reports: Safe Republican[40]
Polling
McCain won every single pre-election poll. The final 3 polls averaged McCain leading with 53% to 43%.[41]
Fundraising
John McCain raised a total of $2,574,332 in the state. Barack Obama raised $2,227,877.[42]
Advertising and visits
Obama spent $967,640. McCain and his interest groups spent $587,645.[43] Neither campaign visited the state.[44]
Analysis
South Carolina, historically part of the Solid South, has become a Republican stronghold in the past few presidential elections. Since Barry Goldwater carried the state in 1964, the only Democratic presidential nominee to win it was Jimmy Carter of neighboring Georgia in 1976. Since then, the Palmetto State has been a safe bet for the Republicans. This trend continued in 2008, even though South Carolina has one of the highest African-American populations in the country. Neither Obama nor McCain seriously contested the state, as it was viewed by both campaigns as a safe GOP/McCain/red state.
On Election Day, McCain captured South Carolina with 53.87% of the vote. McCain dominated the populous northwest, while Obama did best in the cities of Columbia and Charleston, as well as the rural, heavily African American areas. In comparison to the past two elections where the margin was much larger, Obama's relative closeness can be attributed to the large turnout of African American voters in the state who cast their votes 96% for Obama.[45] McCain's margin of victory in South Carolina was much less than that of George W. Bush who carried the Palmetto State in 2004 with 57.98% of the vote to John Kerry's 40.90%, a 17.08-percent margin of victory compared to McCain's 8.97% in 2008, resulting in an 8.11-percent swing to the Democrats in 2008.
During the same election, incumbent Republican U.S. Senator Lindsey Graham was reelected over Democrat Bob Conley. Graham received 57.52% of the vote while Conley took in 42.25%. At the state level, however, Democrats picked up two seats in the South Carolina House of Representatives.
Results
| United States presidential election in South Carolina, 2008 | ||||||
|---|---|---|---|---|---|---|
| Party | Candidate | Running mate | Votes | Percentage | Electoral votes | |
| Republican | John McCain | Sarah Palin | 1,034,896 | 53.87% | 8 | |
| Democratic | Barack Obama | Joe Biden | 862,449 | 44.90% | 0 | |
| Libertarian | Bob Barr | Wayne Allyn Root | 7,283 | 0.38% | 0 | |
| Constitution | Chuck Baldwin | Darrell Castle | 6,287 | 0.36% | 0 | |
| Petition | Ralph Nader | Matt Gonzalez | 5,053 | 0.26% | 0 | |
| Green | Cynthia McKinney | Rosa Clemente | 4,461 | 0.23% | 0 | |
| Totals | 1,920,969 | 100.00% | 8 | |||
| Voter turnout (Voting age population) | 58.0% | |||||
Results breakdown
By county
| County | McCain% | McCain# | Obama% | Obama# | Others% | Others | Total |
|---|---|---|---|---|---|---|---|
| Abbeville | 56.9% | 6,264 | 41.8% | 4,593 | 1.3% | 144 | 11,001 |
| Aiken | 61.4% | 42,849 | 37.4% | 26,101 | 1.2% | 820 | 69,770 |
| Allendale | 23.5% | 947 | 75.3% | 3,029 | 1.2% | 48 | 4,024 |
| Anderson | 66.0% | 48,690 | 32.7% | 24,132 | 1.3% | 965 | 73,787 |
| Bamberg | 33.9% | 2,309 | 65.0% | 4,426 | 1.2% | 79 | 6,814 |
| Barnwell | 48.7% | 4,769 | 50.3% | 4,931 | 1.0% | 98 | 9,798 |
| Beaufort | 54.9% | 37,821 | 44.1% | 30,396 | 0.9% | 653 | 68,870 |
| Berkeley | 55.9% | 36,205 | 42.8% | 27,755 | 1.3% | 821 | 64,781 |
| Calhoun | 47.8% | 3,695 | 51.3% | 3,970 | 0.9% | 73 | 7,738 |
| Charleston | 45.2% | 69,822 | 53.5% | 82,698 | 1.2% | 1,914 | 154,434 |
| Cherokee | 64.1% | 13,305 | 34.7% | 7,215 | 1.2% | 246 | 20,766 |
| Chester | 45.2% | 6,318 | 53.5% | 7,478 | 1.3% | 185 | 13,981 |
| Chesterfield | 50.9% | 8,325 | 47.9% | 7,842 | 1.2% | 192 | 16,359 |
| Clarendon | 43.5% | 6,758 | 55.8% | 8,673 | 0.8% | 121 | 15,552 |
| Colleton | 49.2% | 8,525 | 49.7% | 8,616 | 1.0% | 180 | 17,321 |
| Darlington | 49.6% | 14,544 | 49.4% | 14,505 | 1.0% | 285 | 29,334 |
| Dillon | 43.8% | 5,874 | 55.2% | 7,408 | 1.0% | 135 | 13,417 |
| Dorchester | 57.1% | 29,929 | 41.6% | 21,806 | 1.3% | 670 | 52,405 |
| Edgefield | 55.0% | 6,334 | 44.1% | 5,075 | 1.0% | 111 | 11,520 |
| Fairfield | 33.7% | 3,912 | 65.3% | 7,591 | 1.0% | 116 | 11,619 |
| Florence | 51.2% | 29,861 | 48.0% | 28,012 | 0.9% | 500 | 58,373 |
| Georgetown | 52.1% | 15,790 | 46.9% | 14,199 | 1.0% | 301 | 30,290 |
| Greenville | 61.0% | 116,363 | 37.2% | 70,886 | 1.8% | 3,408 | 190,657 |
| Greenwood | 57.3% | 16,995 | 41.6% | 12,348 | 1.1% | 324 | 29,667 |
| Hampton | 36.8% | 3,439 | 62.2% | 5,816 | 1.0% | 95 | 9,350 |
| Horry | 61.7% | 64,609 | 37.1% | 38,879 | 1.3% | 1,310 | 104,798 |
| Jasper | 38.0% | 3,365 | 60.9% | 5,389 | 1.1% | 100 | 8,854 |
| Kershaw | 58.8% | 16,466 | 40.1% | 11,226 | 1.0% | 293 | 27,985 |
| Lancaster | 56.8% | 16,441 | 42.0% | 12,139 | 1.2% | 341 | 28,921 |
| Laurens | 58.3% | 15,334 | 40.2% | 10,578 | 1.4% | 370 | 26,282 |
| Lee | 33.6% | 3,074 | 65.1% | 5,960 | 1.3% | 119 | 9,153 |
| Lexington | 68.4% | 74,960 | 30.4% | 33,303 | 1.1% | 1,249 | 109,512 |
| Marion | 35.7% | 5,416 | 63.3% | 9,608 | 1.0% | 150 | 15,174 |
| Marlboro | 36.7% | 3,996 | 62.5% | 6,794 | 0.8% | 86 | 10,876 |
| McCormick | 46.6% | 2,437 | 52.7% | 2,755 | 0.8% | 40 | 5,232 |
| Newberry | 58.2% | 9,616 | 40.6% | 6,708 | 1.2% | 200 | 16,524 |
| Oconee | 68.0% | 21,164 | 30.5% | 9,481 | 1.6% | 487 | 31,132 |
| Orangeburg | 30.5% | 12,115 | 68.6% | 27,263 | 0.9% | 376 | 39,754 |
| Pickens | 72.1% | 32,552 | 25.9% | 11,691 | 2.0% | 885 | 45,128 |
| Richland | 35.1% | 57,941 | 64.0% | 105,656 | 0.9% | 1,440 | 165,037 |
| Saluda | 60.3% | 5,191 | 38.6% | 3,323 | 1.0% | 89 | 8,603 |
| Spartanburg | 60.0% | 65,042 | 38.4% | 41,632 | 1.5% | 1,654 | 108,328 |
| Sumter | 41.9% | 18,581 | 57.3% | 25,431 | 0.8% | 346 | 44,358 |
| Union | 55.0% | 7,449 | 43.8% | 5,935 | 1.2% | 167 | 13,551 |
| Williamsburg | 30.4% | 5,004 | 68.6% | 11,279 | 1.0% | 160 | 16,443 |
| York | 58.2% | 54,500 | 40.5% | 37,918 | 1.4% | 1,278 | 93,696 |
By congressional district
John McCain carried five of the state’s six congressional districts in South Carolina, including one of the two districts held by a Democrat.
| District | McCain | Obama | Representative |
|---|---|---|---|
| 1st | 56.50% | 42.27% | Henry E. Brown, Jr. (R) |
| 2nd | 53.87% | 45.11% | Joe Wilson (R) |
| 3rd | 63.72% | 33 | J. Gresham Barrett (R) |
| 4th | 60.43% | 37.91% | Bob Inglis (R) |
| 5th | 53.04% | 45.80% | John M. Spratt, Jr. (D) |
| 6th | 34.89% | 64.15% | Jim Clyburn (D) |
Electors
Technically the voters of SC cast their ballots for electors: representatives to the Electoral College. SC is allocated 8 electors because it has 6 congressional districts and 2 senators. All candidates who appear on the ballot or qualify to receive write-in votes must submit a list of 8 electors, who pledge to vote for their candidate and his or her running mate. Whoever wins the majority of votes in the state is awarded all 8 electoral votes. Their chosen electors then vote for President and Vice President. Although electors are pledged to their candidate and running mate, they are not obligated to vote for them.[46] An elector who votes for someone other than his or her candidate is known as a faithless elector.
The electors of each state and the District of Columbia met on December 15, 2008 to cast their votes for President and Vice President. The Electoral College itself never meets as one body. Instead the electors from each state and the District of Columbia met in their respective capitols.
The following were the members of the Electoral College from the state. All 8 were pledged to John McCain and Sarah Palin:[47]
- Benny Kinlaw
- Betty Sheppard Poe
- Katon Dawson
- Patrick Bonner Haddon
- Rebecca Delleney
- Shelby Phillips
- Susan Aiken
- Wayland Moody
See also
References
- ↑ "CNN Election Center 2008: Primary Results". Retrieved May 23, 2010.
- ↑ "Obama, Huckabee win Iowa".
- ↑ "New Mexico Gov. Richardson drops out of '08 Race". CNN. January 10, 2008. Retrieved May 23, 2010.
- ↑ "Kucinich Drops Out". The Washington Post. January 25, 2008. Retrieved May 23, 2010.
- ↑ "SC Democrats reject Colbert's candidacy". CNN. November 1, 2007. Retrieved May 23, 2010.
- ↑ "Colbert on Democratic Rejection". CNN. November 5, 2007. Retrieved May 23, 2010.
- ↑ "CNN Map: Campaign money race-". Retrieved May 23, 2010.
- ↑ "RealClear Politics- Election 2008- South Carolina".
- ↑ "Pollster.com". Archived from the original on May 11, 2008.
- ↑ "John Edwards for President- South Carolina". Archived from the original on May 5, 2010.
- ↑ "CNN Election Center 2008: Primary Exit Poll". Retrieved May 23, 2010.
- ↑ "SC Dem. Party Election Results". Archived from the original on April 3, 2010.
- ↑ "South Carolina Unofficial Results". South Carolina Secretary of State. Retrieved 2008-01-27.
- 1 2 The Green papers
- ↑ "What happens to Edwards' delegates?". Democratic Convention Watch. Retrieved 2008-06-04.
- 1 2 "The Primary Season: 2008 Republican Calendar". The New York Times. Retrieved 2008-01-19.
- ↑ Crummy, Karen E. (2008-01-18). "S.C. primary down and dirty". Denver Post. Retrieved 2008-01-20.
- ↑ "GOP bellwether South Carolina shows a tangled race: Pg 1". Retrieved 2008-01-20.
- ↑ "First in the South". Fox News. Archived from the original on January 22, 2008. Retrieved 2008-01-20.
- 1 2 3 "The Green Papers 2008 Presidential Primaries, Caucuses, and Conventions - South Carolina Republican Presidential Nominating Process Primary: Saturday 19 January 2008". Retrieved 2011-08-15.
- ↑ "South Carolina Republican Primary Polling". Retrieved 2008-01-19.
- ↑ "Election Center 2008: Primary Results for South Carolina". CNN. Retrieved 2008-01-22.
- ↑ "South Carolina Republican Primary Results". Fox News. Retrieved 2008-01-20.
- ↑ "MSNBC: South Carolina Primary Results". Archived from the original on January 20, 2008. Retrieved 2008-01-20.
- ↑ "2008 Presidential Republican Primary Election Results - South Carolina". Dave Leip's Atlas of U.S. Presidential Elections. 2008-01-20. Retrieved 2009-03-22.
- 1 2 3 4 5 6 "GOP bellwether South Carolina shows a tangled race: Pg 2". Retrieved 2008-01-20.
- ↑ "D.C.'s Political Report: The complete source for campaign summaries.". www.dcpoliticalreport.com. Retrieved 2016-09-25.
- ↑ "Presidential". The Cook Political Report. Archived from the original on May 5, 2015. Retrieved May 31, 2015.
- ↑ "Track the Electoral College vote predictions". Vote 2008 - The Takeaway. Archived from the original on April 22, 2009. Retrieved November 14, 2009.
- ↑ "Election Projection: 2008 Elections - Polls, Projections, Results". www.electionprojection.com. Retrieved 2016-09-25.
- ↑ "Electoral-vote.com: President, Senate, House Updated Daily". electoral-vote.com. Retrieved 2016-09-25.
- 1 2 3 4 Based on Takeaway
- ↑ "POLITICO's 2008 Swing State Map - POLITICO.com". www.politico.com. Retrieved 2016-09-25.
- ↑ "Electoral Map". RealClearPolitics. Archived from the original on 5 June 2008.
- ↑ "CQ Presidential Election Maps, 2008". CQ Politics. Archived from the original on 14 June 2009.
- ↑ Nagourney, Adam; Zeleny, Jeff; Carter, Shan (2008-11-04). "The Electoral Map: Key States". The New York Times. Retrieved May 26, 2010.
- ↑ "October – 2008 – CNN Political Ticker - CNN.com Blogs". CNN. October 31, 2008. Retrieved May 26, 2010.
- ↑ "Winning The Electoral College". Fox News. April 27, 2010.
- ↑ "roadto270". hosted.ap.org. Retrieved 2016-09-25.
- ↑ "Election 2008: Electoral College Update - Rasmussen Reports™". www.rasmussenreports.com. Retrieved 2016-09-25.
- ↑ "Election 2008 Polls". Dave Leip's Atlas of U.S. Presidential Elections.
- ↑ "Presidential Campaign Finance". Archived from the original on January 18, 2009. Retrieved August 18, 2009.
- ↑ "Map: Campaign Ad Spending - Election Center 2008 from CNN.com". CNN. Retrieved May 26, 2010.
- ↑ "Map: Campaign Candidate Visits - Election Center 2008 from CNN.com". CNN. Retrieved May 26, 2010.
- ↑ South Carolina Exit Polls
- ↑ "Electoral College". California Secretary of State. Archived from the original on October 30, 2008. Retrieved 2008-11-01.
- ↑ "U. S. Electoral College 2008 Election - Certificates".
External links
State results of the United States presidential election, 2008 | ||
|---|---|---|
|  | |