United States presidential election in Maryland, 2008
| | ||||||||||||||||||||||||||||||||
| ||||||||||||||||||||||||||||||||
| ||||||||||||||||||||||||||||||||
|
| ||||||||||||||||||||||||||||||||
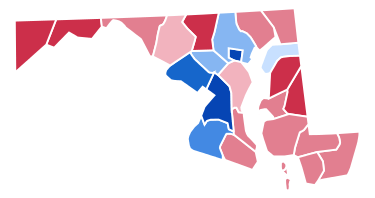
| County Results
Obama—80-90%
Obama—70-80%
Obama—60-70%
Obama—50-60%
Obama—<50%
McCain—<50%
McCain—50-60%
McCain—60-70% | ||||||||||||||||||||||||||||||||
| ||||||||||||||||||||||||||||||||

| Elections in Maryland | ||||||||||
|---|---|---|---|---|---|---|---|---|---|---|
.svg.png) | ||||||||||
|
||||||||||
|
||||||||||
|
Elections by year |
||||||||||
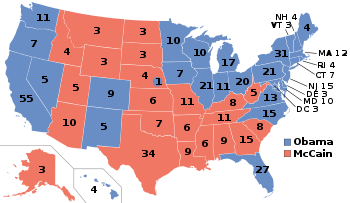
The 2008 United States presidential election in Maryland took place on November 4, 2008 throughout all 50 states and D.C., which was part of the 2008 United States presidential election. Voters chose 10 representatives, or electors to the Electoral College, who voted for President and Vice President.
Maryland was won by Democratic nominee Barack Obama by a 25.4% margin of victory. Prior to the election, all 17 news organizations considered this a state Obama would win, or otherwise considered as a safe blue state. The Old Line State has voted for the Democratic presidential candidate of every election since 1992. In 2008, Obama easily captured the state's 10 electoral votes in a landslide victory, winning 61.92% of the popular vote to Republican John McCain's 36.47%.
Primaries
Campaign
Predictions
There were 17 news organizations who made state by state predictions of the election. Here are their last predictions before election day:
- D.C. Political Report: Democrat[1]
- Cook Political Report: Solid Democrat[2]
- Takeaway: Solid Obama[3]
- Election Projection: Solid Obama[4]
- Electoral-vote.com: Strong Democrat[5]
- Washington Post: Solid Obama[6]
- Politico: Solid Obama[7]
- Real Clear Politics: Solid Obama[8]
- FiveThirtyEight.com: Solid Obama[6]
- CQ Politics: Safe Democrat[9]
- New York Times: Solid Democrat[10]
- CNN: Safe Democrat[11]
- NPR: Solid Obama[6]
- MSNBC: Solid Obama[6]
- Fox News: Democrat[12]
- Associated Press: Democrat[13]
- Rasmussen Reports: Safe Democrat[14]
Polling
Obama won every single pre-election poll, each by a double digit margin of victory and at least 51% of the vote. The final 3 polls averaged Obama leading 54% to 38%.[15]
Fundraising
John McCain raised a total of $3,439,120 in the state. Barack Obama raised $19,091,136.[16]
Advertising and visits
Obama spent $257,582 while McCain spent nothing.[17] Both tickets visited the state once.[18]
Analysis
Maryland has supported the Democratic nominee in each of the last five presidential elections by an average margin of 15.4%. In 1980, it was one of only six states to vote for Democrat Jimmy Carter over Republican Ronald Reagan. It has only supported a Republican five times since Truman--the Republican landslides of 1952, 1956, 1972, 1984 and 1988.
Maryland is often among the Democratic nominees' best states. In 1992, Bill Clinton fared better in Maryland than any other state except his home state of Arkansas. In 1996, Maryland was Clinton's sixth best, in 2000 Maryland ranked fourth for Al Gore and in 2004 John Kerry showed his fifth best performance in Maryland.
Republican presidential candidates typically win more counties by running up huge margins in western Maryland and the Eastern Shore. However, they are usually swamped by the heavily Democratic Baltimore-Washington, D.C. axis, which casts almost 75 percent of the state's vote. The state's four largest county-level jurisdictions--Montgomery, Prince George's and Baltimore counties and the City of Baltimore—are strongly Democratic. These areas, which contain 1.5 million voters combined, make it extremely difficult for a Republican to win Maryland. Even in bad years for Democrats, a Republican usually has to run the table in the rest of the state and win either Montgomery, Prince George's or Baltimore counties to have a realistic chance of carrying the state. In 1984, for instance, Ronald Reagan only carried Maryland by crushing Walter Mondale in Baltimore County and narrowly winning Montgomery. In 1988, George H. W. Bush ran up a 42,300-vote margin in Baltimore County over Michael Dukakis--almost 85 percent of his statewide margin of 49,800 votes.
The 2008 election was no exception. Barack Obama won the state's 10 electoral votes in 2008 with 61.92% of the vote to John McCain's 36.47%. Obama carried Montgomery, Prince George's, Baltimore County and Baltimore City with 71.6%, 88.9%, 56.2 and 87.2% of the vote, respectively. Obama's combined 550,000-vote margin in these four areas would have been enough to carry the state. While McCain won more counties, the only large county he won was Anne Arundel County, home to the state capital, Annapolis.
Both of Maryland's U.S. Senators and seven of its eight U.S. Representatives in Congress are Democrats, and Democrats hold supermajorities in the state Senate and House of Delegates. The state has elected only five Republican governors since 1900.
U.S. Representative Steny Hoyer, a Democrat who represents Maryland's 5th Congressional District, was elected as House Majority Leader for the 110th Congress of the U.S. House of Representatives and 111th Congress, serving in that post since January 2007.
While Maryland is a Democratic Party stronghold, its best known political figure is perhaps a Republican – former Governor Spiro Agnew, who served as Vice President under Richard M. Nixon. He was Vice President from 1969 to 1973, when he resigned in the aftermath of revelations that he had taken bribes while he was Governor of Maryland. In late 1973, a court found Agnew guilty of violating tax laws.
In 2008, Democrats picked up a U.S. House an open seat in Maryland's 1st Congressional District as Democrat Frank M. Kratovil, Jr. defeated Republican Andy Harris by less than a 1-percent margin of victory.
Results
| United States presidential election in Maryland, 2008[19] | ||||||
|---|---|---|---|---|---|---|
| Party | Candidate | Running mate | Votes | Percentage | Electoral votes | |
| Democratic | Barack Obama | Joe Biden | 1,629,467 | 61.92% | 10 | |
| Republican | John McCain | Sarah Palin | 959,862 | 36.47% | 0 | |
| Independent | Ralph Nader | Matt Gonzalez | 14,713 | 0.56% | 0 | |
| Libertarian | Bob Barr | Wayne Allyn Root | 9,842 | 0.44% | 0 | |
| Independent | Write-in candidates | 9,043 | 0.34% | 0 | ||
| Green | Cynthia McKinney | Rosa Clemente | 4,747 | 0.18% | 0 | |
| Constitution | Chuck Baldwin | Darrell Castle | 3,760 | 0.14% | 0 | |
| America's Independent | Alan Keyes (write-in) | Brian Rohrbough | 103 | 0.00% | 0 | |
| Unaffiliated | Donald Kenneth Allen (write-in) | Christopher Borcik | 17 | 0.56% | 0 | |
| Democratic | Blaine Taylor (write-in) | n/a | 12 | 0.00% | 0 | |
| Socialist USA | Brian Moore (write-in) | Stewart Alexander | 10 | 0.00% | 0 | |
| Totals | 2,631,596 | 100.00% | 10 | |||
| Voter turnout (Voting age population) | 62.4% | |||||
Results breakdown
By county
| County | Obama(D) | McCain(R) |
|---|---|---|
| Allegany | 10,693 | 18,405 |
| Anne Arundel | 125,015 | 129,682 |
| Baltimore (City) | 214,385 | 28,681 |
| Baltimore (County) | 214,151 | 158,714 |
| Calvert | 20,299 | 23,095 |
| Caroline | 4,971 | 8,015 |
| Carroll | 28,060 | 54,503 |
| Cecil | 17,665 | 23,855 |
| Charles | 43,635 | 25,732 |
| Dorchester | 6,912 | 8,168 |
| Frederick | 54,013 | 55,170 |
| Garrett | 3,736 | 8,903 |
| Harford | 48,552 | 71,751 |
| Howard | 87,120 | 55,393 |
| Kent | 4,953 | 4,905 |
| Montgomery | 314,444 | 118,608 |
| Prince George's | 332,396 | 38,833 |
| Queen Anne's | 8,575 | 15,087 |
| St. Mary's | 19,023 | 24,705 |
| Somerset | 4,779 | 5,037 |
| Talbot | 9,035 | 10,995 |
| Washington | 26,245 | 34,169 |
| Wicomico | 19,436 | 21,849 |
| Worcester | 11,374 | 15,607 |
| Totals | 1,629,467 | 959,862 |
By congressional district
Barack Obama carried six of Maryland’s eight congressional districts, all held by Democrats. John McCain carried two congressional districts, the only one held by a Republican and one that was won by a Democrat in 2008.
| District | McCain | Obama | Representative |
|---|---|---|---|
| 1st | 58.26% | 39.81% | Wayne Gilchrest (110th Congress) |
| Frank M. Kratovil, Jr. (111th Congress) | |||
| 2nd | 38.25% | 59.84% | Dutch Ruppersberger |
| 3rd | 39.23% | 58.78% | John Sarbanes |
| 4th | 14.16% | 85.06% | Albert Wynn (110th Congress) |
| Donna Edwards (111th Congress) | |||
| 5th | 33.30% | 65.44% | Steny Hoyer |
| 6th | 57.65% | 40.19% | Roscoe Bartlett |
| 7th | 19.89% | 78.79% | Elijah Cummings |
| 8th | 24.70% | 73.88% | Chris Van Hollen |
Electors
Technically the voters of Maryland cast their ballots for electors: representatives to the Electoral College. Maryland is allocated 10 electors because it has 8 congressional districts and 2 senators. All candidates who appear on the ballot or qualify to receive write-in votes must submit a list of 10 electors, who pledge to vote for their candidate and his or her running mate. Whoever wins the majority of votes in the state is awarded all 10 electoral votes. Their chosen electors then vote for President and Vice President. Although electors are pledged to their candidate and running mate, they are not obligated to vote for them.[20] An elector who votes for someone other than his or her candidate is known as a faithless elector.
The electors of each state and the District of Columbia met on December 15, 2008 to cast their votes for President and Vice President. The Electoral College itself never meets as one body. Instead the electors from each state and the District of Columbia met in their respective capitols.
The following were the members of the Electoral College from the state. All 10 were pledged to Barack Obama and Joe Biden:[21]
- Gene M. Ransom III
- Delores Kelley
- Guy Guzzone
- Nathaniel Exum
- Chris Reynolds
- Bobby Fouche
- Liz Bobo
- Michael Barnes
- Susan Lee
- Rainier Harvey, Sr.
References
- ↑ D.C.'s Political Report: The complete source for campaign summaries
- ↑ Presidential | The Cook Political Report Archived May 5, 2015, at the Wayback Machine.
- ↑ Adnaan (2008-09-20). "Track the Electoral College vote predictions". The Takeaway. Archived from the original on April 22, 2009. Retrieved 2009-11-14.
- ↑ Election Projection: 2008 Elections - Polls, Projections, Results
- ↑ Electoral-vote.com: President, Senate, House Updated Daily
- 1 2 3 4 Based on Takeaway
- ↑ POLITICO's 2008 Swing State Map - POLITICO.com
- ↑ RealClearPolitics - Electoral Map
- ↑ "CQ Presidential Maps, 2008". CQ Politics. Archived from the original on 29 October 2008. Retrieved 31 August 2012.
- ↑ "Electoral College Map". The New York Times. Retrieved 2010-05-26.
- ↑ "October – 2008 – CNN Political Ticker - CNN.com Blogs". CNN. Retrieved 2010-05-26.
- ↑ "Winning the Electoral College". Fox News. 2010-04-27.
- ↑ roadto270
- ↑ Election 2008: Electoral College Update - Rasmussen Reports™
- ↑ Election 2008 Polls - Dave Leip's Atlas of U.S. Presidential Elections
- ↑ Presidential Campaign Finance
- ↑ "Map: Campaign Ad Spending - Election Center 2008 from CNN.com". CNN. Retrieved 2010-05-26.
- ↑ "Map: Campaign Candidate Visits - Election Center 2008 from CNN.com". CNN. Retrieved 2010-05-26.
- ↑ "Maryland State Board of Elections". Retrieved 2008-12-12.
- ↑ "Electoral College". California Secretary of State. Archived from the original on October 30, 2008. Retrieved 2008-11-01.
- ↑ Maryland State Board of Elections