United States presidential election in West Virginia, 2008
| | ||||||||||||||||||||||||||||||||
| ||||||||||||||||||||||||||||||||
| ||||||||||||||||||||||||||||||||
|
| ||||||||||||||||||||||||||||||||
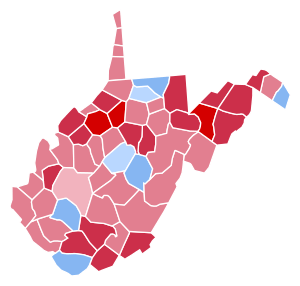
| County Results
Obama—50-60%
Obama—<50%
McCain—<50%
McCain—50-60%
McCain—60-70%
McCain—70-80% | ||||||||||||||||||||||||||||||||
| ||||||||||||||||||||||||||||||||

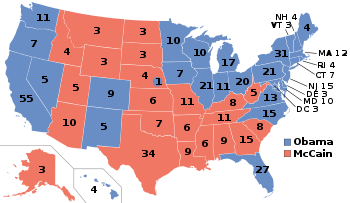
The 2008 United States presidential election in West Virginia took place on November 4, 2008 throughout all 50 states and D.C., which was part of the 2008 United States presidential election. Voters chose 5 representatives, or electors to the Electoral College, who voted for President and Vice President.
West Virginia was won by Republican nominee John McCain by a 13.1% margin of victory. Prior to the election, all 17 news organizations considered this a state McCain would win, or otherwise considered as a safe red state. Despite its past voting record of heavily favoring Democratic presidential nominees, the state has lately been trending more Republican in presidential elections. As expected, McCain defeated Obama in the Mountain State, even improving upon George W. Bush's performance in 2004. West Virginia was one of five states in which McCain did better than Bush. Obama was also the first Democratic presidential nominee since Woodrow Wilson in 1916 to win the nationwide presidential election without carrying West Virginia.
Primaries
Campaign
Predictions
| Elections in West Virginia | |||||||||
|---|---|---|---|---|---|---|---|---|---|
 | |||||||||
|
There were 17 news organizations who made state by state predictions of the election. Here are their last predictions before election day:
- D.C. Political Report: Republican[1]
- Cook Political Report: Leaning Republican[2]
- Takeaway: Leaning McCain[3]
- Election Projection: Leaning McCain[4]
- Electoral-vote.com: Leaning Republican[5]
- Washington Post: Leaning McCain[6]
- Politico: Solid McCain[7]
- Real Clear Politics: Leaning McCain[8]
- FiveThirtyEight.com: Leaning McCain[9]
- CQ Politics: Leaning Republican[10]
- New York Times: Leaning Republican[11]
- CNN: Leaning Republican[12]
- NPR: Leaning McCain[13]
- MSNBC: Leaning McCain[14]
- Fox News: Republican[15]
- Associated Press: Republican[16]
- Rasmussen Reports: Solid Republican[17]
Polling
McCain won 16 of 17 pre-election polls. The final 3 polls averaged McCain leading 53% to 41%.[18]
Fundraising
John McCain raised a total of $291,184 in the state. Barack Obama raised $713,231.
Advertising and visits
Obama and his interest groups spent $1,437,178. McCain and his interest groups spent $1,920,720.[19] Each ticket visited the state once.[20]
Analysis
More than any other state, West Virginia highlighted Obama's trouble in Appalachian America. It swung heavily to the Democrats during the days of Franklin D. Roosevelt and remained reliably Democratic for most of the next 68 years. During that time, it only voted Republican three times, all in national Republican landslides--1956, 1972 and 1984. It often voted for Democrats (such as Jimmy Carter and Mike Dukakis) who went on to big national defeats. This was largely due to its blue-collar, heavily unionized workers, especially coal miners, who favored Democratic economic policy.
Starting in the days of Al Gore, however, the state's voters became more concerned with the national Democratic Party's perceived hostility toward the coal industry, which is a core part of the West Virginia economy. As a result, the state has been trending Republican in national elections.
Advancing into the general election, McCain was largely expected to receive the state's five electoral votes. Since polling in the state prior to the election showed a nearly double-digit lead in favor of McCain, neither presidential nominee campaigned heavily in the state. Not surprisingly, though, every poll out of West Virginia showed McCain defeating Barack Obama in West Virginia, sometimes by double digits.
On Election Day, McCain won West Virginia by 13.09 points while losing nationwide. McCain did well throughout the state, losing only a handful of counties. While his margins were best in the more conservative northern part of the state, he also improved significantly in Southern West Virginia. This coal-mining, union-heavy region was one of the most heavily Democratic places in the nation; Logan County, for example, cast 72 percent of its ballot for Bill Clinton.[21] In 2008, however, John McCain won the county by double digits.
On the other hand, Barack Obama did make gains in the area between Maryland and Virginia, counties which are a part of the Washington Metropolitan Area. Obama also ran close in Central West Virginia (the counties around the capital Charleston).
Despite the recent Republican success nationally, Democrats still dominate at the state and local level. After Election 2008, Democrats hold the governorship and every statewide office, two out of the state's three congressional districts in the U.S. House of Representatives and both U.S. Senate seats. They also hold supermajorities in both chambers of the state legislature.
During the same election, popular incumbent Democratic Governor Joe Manchin III was soundly reelected to a second term with 69.79% of the vote over Republican Russ Weeks who took in 25.75% while Jesse Johnson of the Mountain Party received 4.46%. Incumbent Democratic U.S. Senator Jay Rockefeller IV was also soundly reelected with 63.71% of the vote over Republican Jay Wolfe who took in 36.27%. At the state level, Democrats picked up three seats in the West Virginia Senate while Republicans picked up one seat in the West Virginia House of Delegates.
Results
| United States presidential election in West Virginia, 2008 | ||||||
|---|---|---|---|---|---|---|
| Party | Candidate | Running mate | Votes | Percentage | Electoral votes | |
| Republican | John McCain | Sarah Palin | 397,466 | 55.60% | 5 | |
| Democratic | Barack Obama | Joe Biden | 303,857 | 42.51% | 0 | |
| Independent | Ralph Nader | Matt Gonzalez | 7,219 | 1.01% | 0 | |
| Constitution | Chuck Baldwin | Darrell Castle | 2,465 | 0.34% | 0 | |
| Green | Cynthia McKinney | Rosa Clemente | 2,355 | 0.33% | 0 | |
| Write-ins | Write-ins | 89 | 0.01% | 0 | ||
| Totals | 713,451 | 100.00% | 5 | |||
| Voter turnout (Voting age population) | 51.2% | |||||
Results breakdown
By county
| County | Obama% | Obama# | McCain% | McCain# |
|---|---|---|---|---|
| Barbour | 39.64% | 2415 | 60.36% | 3678 |
| Berkeley | 43.42% | 15945 | 56.58% | 20779 |
| Boone | 55.48% | 4490 | 44.52% | 3603 |
| Braxton | 50.69% | 2691 | 49.31% | 2618 |
| Brooke | 48.61% | 4666 | 51.39% | 4932 |
| Cabell | 44.86% | 15110 | 55.14% | 18571 |
| Calhoun | 42.05% | 976 | 57.95% | 1345 |
| Clay | 44.77% | 1417 | 55.23% | 1748 |
| Doddridge | 24.92% | 732 | 75.08% | 2205 |
| Fayette | 48.49% | 7134 | 51.51% | 7578 |
| Gilmer | 41.45% | 1117 | 58.55% | 1578 |
| Grant | 23.86% | 987 | 76.14% | 3150 |
| Greenbrier | 43.08% | 5561 | 56.92% | 7347 |
| Hampshire | 36.35% | 2968 | 63.65% | 5197 |
| Hancock | 42.14% | 5285 | 57.86% | 7257 |
| Hardy | 35.88% | 1880 | 64.12% | 3360 |
| Harrison | 43.23% | 13488 | 56.77% | 17715 |
| Jackson | 40.56% | 4821 | 59.44% | 7066 |
| Jefferson | 52.44% | 11606 | 47.56% | 10526 |
| Kanawha | 49.73% | 40148 | 50.27% | 40588 |
| Lewis | 32.71% | 2096 | 67.29% | 4312 |
| Lincoln | 45.53% | 2972 | 54.47% | 3556 |
| Logan | 43.57% | 4862 | 56.43% | 6297 |
| Marion | 50.26% | 11507 | 49.74% | 11389 |
| Marshall | 43.53% | 5943 | 56.47% | 7709 |
| Mason | 43.29% | 4444 | 56.71% | 5822 |
| McDowell | 54.46% | 3410 | 45.54% | 2852 |
| Mercer | 35.94% | 7388 | 64.06% | 13167 |
| Mineral | 33.00% | 3717 | 67.00% | 7546 |
| Mingo | 43.86% | 3567 | 56.14% | 4565 |
| Monongalia | 51.91% | 16853 | 48.09% | 15612 |
| Monroe | 37.06% | 1969 | 62.94% | 3344 |
| Morgan | 38.02% | 2704 | 61.98% | 4408 |
| Nicholas | 49.55% | 6007 | 50.45% | 6115 |
| Ohio | 44.47% | 8481 | 55.53% | 10590 |
| Pendleton | 39.53% | 1049 | 60.47% | 1605 |
| Pleasants | 39.13% | 1127 | 60.87% | 1753 |
| Pocahontas | 43.56% | 1538 | 56.44% | 1993 |
| Preston | 36.47% | 4190 | 63.53% | 7299 |
| Putnam | 38.12% | 9424 | 61.88% | 15295 |
| Raleigh | 36.82% | 10115 | 63.18% | 17358 |
| Randolph | 42.80% | 4527 | 57.20% | 6051 |
| Ritchie | 26.43% | 989 | 73.57% | 2753 |
| Roane | 46.05% | 2506 | 53.95% | 2936 |
| Summers | 44.19% | 2276 | 55.81% | 2875 |
| Taylor | 40.75% | 2420 | 59.25% | 3518 |
| Tucker | 37.67% | 1280 | 62.33% | 2118 |
| Tyler | 34.05% | 1234 | 65.95% | 2390 |
| Upshur | 33.04% | 2896 | 66.96% | 5870 |
| Wayne | 40.70% | 6101 | 59.30% | 8890 |
| Webster | 52.90% | 1543 | 47.10% | 1374 |
| Wetzel | 46.80% | 2919 | 53.20% | 3318 |
| Wirt | 34.40% | 777 | 65.60% | 1482 |
| Wood | 35.44% | 12446 | 64.56% | 22670 |
| Wyoming | 37.17% | 2724 | 62.83% | 4605 |
By congressional District
John McCain swept all three of the state’s three congressional districts, including the two districts held by Democrats.
| District | McCain | Obama | Representative |
|---|---|---|---|
| 1st | 56.77% | 41.51% | Alan Mollohan |
| 2nd | 54.63% | 43.77% | Shelley Moore Capito |
| 3rd | 55.76% | 42.29% | Nick Rahall |
Electors
Technically the voters of West Virginia cast their ballots for electors: representatives to the Electoral College. West Virginia is allocated 5 electors because it has 3 congressional districts and 2 senators. All candidates who appear on the ballot or qualify to receive write-in votes must submit a list of 5 electors, who pledge to vote for their candidate and his or her running mate. Whoever wins the majority of votes in the state is awarded all 5 electoral votes. Their chosen electors then vote for President and Vice President. Although electors are pledged to their candidate and running mate, they are not obligated to vote for them.[22] An elector who votes for someone other than his or her candidate is known as a faithless elector.
The electors of each state and the District of Columbia met on December 15, 2008 to cast their votes for President and Vice President. The Electoral College itself never meets as one body. Instead the electors from each state and the District of Columbia met in their respective capitols.
All 5 were pledged to John McCain and Sarah Palin:[23]
- Robert Fish
- Zane Lawhorn
- Catherine Sue McKinney
- Marti Riggall
- Theresa Waxman
References
- ↑ "D.C.'s Political Report: The complete source for campaign summaries.". Retrieved 14 January 2015.
- ↑ "Presidential". Archived from the original on May 5, 2015. Retrieved 14 January 2015.
- ↑ "Archived copy". Archived from the original on April 22, 2009. Retrieved November 14, 2009.
- ↑ "Election Projection: 2008 Elections - Polls, Projections, Results". Retrieved 14 January 2015.
- ↑ "Electoral-vote.com: President, Senate, House Updated Daily". Retrieved 14 January 2015.
- ↑ Based on Takeaway
- ↑ "POLITICO's 2008 Swing State Map". Retrieved 14 January 2015.
- ↑ http://www.realclearpolitics.com/epolls/maps/obama_vs_mccain/?map=5
- ↑ Based on Takeaway
- ↑ "Archived copy". Archived from the original on June 14, 2009. Retrieved December 20, 2009.
- ↑ Nagourney, Adam; Zeleny, Jeff; Carter, Shan (2008-11-04). "The Electoral Map: Key States". The New York Times. Retrieved May 26, 2010.
- ↑ "October – 2008 – CNN Political Ticker - CNN.com Blogs". CNN. October 31, 2008. Retrieved May 26, 2010.
- ↑ Based on Takeaway
- ↑ Based on Takeaway
- ↑ "Winning The Electoral College". Fox News. April 27, 2010.
- ↑ "roadto270". Retrieved 14 January 2015.
- ↑ Rasmussen Reports. "Election 2008: Electoral College Update - Rasmussen Reports™". Retrieved 14 January 2015.
- ↑ David Leip. "Election 2008 Polls - Dave Leip's Atlas of U.S. Presidential Elections". Retrieved 14 January 2015.
- ↑ "Map: Campaign Ad Spending - Election Center 2008 from CNN.com". CNN. Retrieved May 26, 2010.
- ↑ "Map: Campaign Candidate Visits - Election Center 2008 from CNN.com". CNN. Retrieved May 26, 2010.
- ↑ "Election Results 2008". New York Times. Archived from the original on November 3, 2004. Retrieved 6-8-09. Check date values in:
|access-date=(help) - ↑ "Electoral College". California Secretary of State. Archived from the original on October 30, 2008. Retrieved 2008-11-01.
- ↑ "U. S. Electoral College 2008 Election - Certificates". Retrieved 14 January 2015.