World population

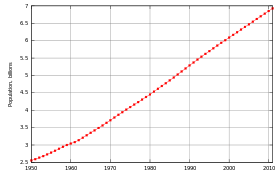
In demographics, the world population is the total number of humans currently living. As of August 2016, it was estimated at 7.4 billion.[1] The United Nations estimates it will further increase to 11.2 billion in the year 2100.[2]
World population has experienced continuous growth since the end of the Great Famine of 1315–17 and the Black Death in 1350, when it was near 370 million.[3] The highest population growth rates – global population increases above 1.8% per year – occurred between 1955-1975 peaking to 2.06% between 1965-1970.[2] The growth rate has declined to 1.18% between 2010-2015 and is projected to decline to 0.13% by the year 2100.[2] Total annual births were highest in the late 1980s at about 139 million,[4] and are now expected to remain essentially constant at their 2011 level of 135 million,[5] while deaths number 56 million per year and are expected to increase to 80 million per year by 2040.[6] World population reached 7 billion on October 31, 2011 according to the United Nations Population Fund,[7][8][9] and on March 12, 2012 according to the United States Census Bureau.[10]
The median age of the world's population was estimated to be 30.1 years in 2016, with the male median age estimated to be 29.4 years and female, 30.9 years.[11]
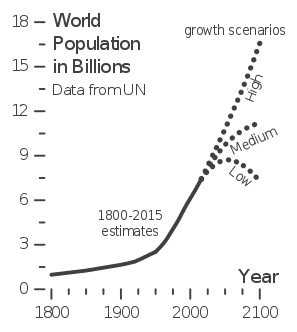
The 2012 UN projections show a continued increase in population in the near future with a steady decline in population growth rate; the global population is expected to reach between 8.3 and 10.9 billion by 2050.[12][13] 2003 UN Population Division population projections for the year 2150 range between 3.2 and 24.8 billion.[14] One of many independent mathematical models supports the lower estimate,[15] while a 2014 estimate forecasts between 9.3 and 12.6 billion in 2100, and continued growth thereafter.[16][17] Some analysts have questioned the sustainability of further world population growth, highlighting the growing pressures on the environment, global food supplies, and energy resources.[18][19][20]
Estimates on the total number of humans who have ever lived range in the order of 106 to 108 billion.[21][22][23]
| World population (millions, UN estimates)[24] | ||||
|---|---|---|---|---|
| # | Top ten most populous countries | 2000 | 2015 | 2030* |
| 1 | | 1,270 | 1,376 | 1,416 |
| 2 | | 1,053 | 1,311 | 1,528 |
| 3 | | 283 | 322 | 356 |
| 4 | | 212 | 258 | 295 |
| 5 | | 176 | 208 | 229 |
| 6 | | 138 | 189 | 245 |
| 7 | | 123 | 182 | 263 |
| 8 | | 131 | 161 | 186 |
| 9 | | 146 | 143 | 139 |
| 10 | | 103 | 127 | 148 |
| World total | 6,127 | 7,349 | 8,501 | |
Notes:
| ||||
Population by region
Six of the Earth's seven continents are permanently inhabited on a large scale. Asia is the most populous continent, with its 4.3 billion inhabitants accounting for 60% of the world population. The world's two most populated countries alone, China and India, together constitute about 37% of the world's population. Africa is the second most populated continent, with around 1 billion people, or 15% of the world's population. Europe's 733 million people make up 12% of the world's population as of 2012, while the Latin American and Caribbean regions are home to around 600 million (9%). Northern America, primarily consisting of the United States, Mexico, and Canada, has a population of around 352 million (5%), and Oceania, the least-populated region, has about 35 million inhabitants (0.5%).[25] Though it is not permanently inhabited by any fixed population, Antarctica has a small, fluctuating international population, based mainly in polar science stations. This population tends to rise in the summer months and decrease significantly in winter, as visiting researchers return to their home countries.[26]
Population by continent
| Continent | Density (inhabitants/km2) |
Population (millions) |
Most populous country | Most populous city (metropolitan area) |
|---|---|---|---|---|
| Asia | 96.4 | 4,436 | ||
| Africa | 36.7 | 1,216 | ||
| Europe | 72.9 | 738 | approx. 110 million in Europe) |
|
| North America[note 2] | 22.9 | 579 | ||
| South America | 22.8 | 422 | ||
| Oceania | 4.5 | 39.9 | ||
| Antarctica | 0.0003 (varies) |
0.004 in summer (non-permanent, varies)[26] |
N/A[note 3] | McMurdo Station (1,200) (non-permanent, varies) |
History
Estimates of world population by their nature are an aspect of modernity, possible only since the Age of Discovery. Early estimates for the population of the world[27] date to the 17th century: William Petty in 1682 estimated world population at 320 million (modern estimates ranging close to twice this number); by the late 18th century, estimates ranged close to one billion (consistent with modern estimates).[28] More refined estimates, broken down by continents, were published in the first half of the 19th century, at 600 to 1000 million in the early 1800s and at 800 to 1000 million in the 1840s.[29]
Antiquity and Middle Ages
Estimates of the population of the world at the time agriculture emerged in around 10,000 BCE have ranged between 1 million and 15 million.[30][31] Even earlier, genetic evidence suggests humans may have gone through a population bottleneck of between 1,000 and 10,000 people about 70,000 BCE, according to the Toba catastrophe theory. By contrast, it is estimated that around 50–60 million people lived in the combined eastern and western Roman Empire in the 4th century CE.[32]
The Plague of Justinian, which first emerged during the reign of the Roman emperor Justinian, caused Europe's population to drop by around 50% between the 6th and 8th centuries CE.[33] The population of Europe was more than 70 million in 1340.[34] The Black Death pandemic of the 14th century may have reduced the world's population from an estimated 450 million in 1340 to between 350 and 375 million in 1400;[35] it took 200 years for population figures to recover.[36] The population of China decreased from 123 million in 1200 to 65 million in 1393,[37] presumably due to a combination of Mongol invasions, famine, and plague.[38]
Starting in 2 AD, the Han Dynasty of ancient China kept consistent family registers in order to properly assess the poll taxes and labor service duties of each household.[39] In the year 2 AD the population of Western Han was recorded as 57,671,400 individuals in 12,366,470 households, decreasing to 47,566,772 individuals in 9,348,227 households by 146 AD, towards the End of the Han Dynasty.[39] At the founding of the Ming Dynasty in 1368, China's population was reported to be close to 60 million; toward the end of the dynasty in 1644, it may have approached 150 million.[40] England's population reached an estimated 5.6 million in 1650, up from an estimated 2.6 million in 1500.[41] New crops that were brought to Asia and Europe from the Americas by Portuguese and Spanish colonists in the 16th century are believed to have contributed to population growth.[42][43][44] Since their introduction to Africa by Portuguese traders in the 16th century,[45] maize and cassava have similarly replaced traditional African crops as the most important staple food crops grown on the continent.[46]
Around 300 BCE, the population of India was between 100 million and 140 million.[47] The population of India in 1600 was around 100 million. Hence, from 300 BCE to 1600 CD India's population was more or less stable.[48]
The pre-Columbian North American population probably numbered somewhere between 2 million and 18 million.[49] Encounters between European explorers and populations in the rest of the world often introduced local epidemics of extraordinary virulence.[50] According to the most extreme scholarly claims, as many as 90% of the Native American population of the New World died due to Old World diseases such as smallpox, measles and influenza.[51] Over the centuries, the Europeans had developed high degrees of immunity to these diseases, while the indigenous peoples had no such immunity.[52]
Modern era

During the European Agricultural and Industrial Revolutions, the life expectancy of children increased dramatically.[55] The percentage of the children born in London who died before the age of five decreased from 74.5% in 1730–1749 to 31.8% in 1810–1829.[56][57] Between 1700 and 1900, Europe’s population increased from about 100 million to over 400 million.[58] Altogether, the areas populated by people of European descent comprised 36% of the world's population in 1900.[59]
Population growth in the West became more rapid after the introduction of vaccination and other improvements in medicine and sanitation.[60] Improved material conditions led to the population of Britain increasing from 10 million to 40 million in the 19th century.[61] The population of the United Kingdom reached 60 million in 2006.[62] The United States saw its population grow from around 5.3 million in 1800 to 106 million in 1920, exceeding 307 million in 2010.[63]
The first half of the 20th century in Imperial Russia and the Soviet Union was marked by a succession of major wars, famines and other disasters which caused large-scale population losses (approximately 60 million excess deaths).[64][65] After the collapse of the Soviet Union, Russia's population declined significantly – from 150 million in 1991 to 143 million in 2012[66] – but by 2013 this decline appeared to have halted.[67]
Many countries in the developing world have experienced extremely rapid population growth since the early 20th century, due to economic development and improvements in public health. China's population rose from approximately 430 million in 1850 to 580 million in 1953,[68] and now stands at over 1.3 billion. The population of the Indian subcontinent, which was about 125 million in 1750, increased to 389 million in 1941;[69] today, India, Pakistan and Bangladesh are collectively home to about 1.5 billion people.[70] Java had about 5 million inhabitants in 1815; its present-day successor, Indonesia, now has a population of over 140 million.[71] Mexico's population grew from 13.6 million in 1900 to about 112 million in 2010.[72][73] Between the 1920s and 2000s, Kenya's population grew from 2.9 million to 37 million.[74]
Milestones by the billions
| World population milestones in billions (USCB estimates) | |||||||||
|---|---|---|---|---|---|---|---|---|---|
| Population | 1 | 2 | 3 | 4 | 5 | 6 | 7 | 8 | 9 |
| Year | 1804 | 1927 | 1960 | 1974 | 1987 | 1999 | 2011 | 2024 | 2042 |
| Years elapsed | –– | 123 | 33 | 14 | 13 | 12 | 12 | 13 | 18 |
It is estimated that the world population reached one billion for the first time in 1804. It was another 123 years before it reached two billion in 1927, but it took only 33 years to reach three billion in 1960.[75] Thereafter, the global population reached four billion in 1974, five billion in 1987, six billion in 1999 and, according to the United States Census Bureau, seven billion in March 2012.[76] The United Nations, however, estimated that the world population reached seven billion in October 2011.[7][8][9]
According to current projections, the global population will reach eight billion by 2024, and will likely reach around nine billion by 2037. Alternative scenarios for 2050 range from a low of 7.4 billion to a high of more than 10.6 billion.[77] Projected figures vary depending on underlying statistical assumptions and the variables used in projection calculations, especially the fertility variable. Long-range predictions to 2150 range from a population decline to 3.2 billion in the "low scenario", to "high scenarios" of 24.8 billion.[77] One extreme scenario predicted a massive increase to 256 billion by 2150, assuming the global fertility rate remained at its 1995 level of 3.04 children per woman; however, by 2010 the global fertility rate had declined to 2.52.[14][78]
There is no estimation for the exact day or month the world's population surpassed one or two billion. The points at which it reached three and four billion were not officially noted, but the International Database of the United States Census Bureau placed them in July 1959 and April 1974 respectively. The United Nations did determine, and celebrate, the "Day of 5 Billion" on July 11, 1987, and the "Day of 6 Billion" on October 12, 1999. The "Day of 7 Billion" was declared by the Population Division of the United Nations to be October 31, 2011.[79]
Global demographics

|
80+
77.5+
75+
72.5+
70+
67.5+
65+ |
60+
55+
50+
45+
40+
less than 40 |
As of 2012, the global sex ratio is approximately 1.01 males to 1 female. The greater number of men is possibly due to the significant gender imbalances evident in the Indian and Chinese populations.[81][82] Approximately 26.3% of the global population is aged under 15, while 65.9% is aged 15–64 and 7.9% is aged 65 or over.[81] The median age of the world's population was estimated to be 29.7 years in 2014,[83] and is expected to rise to 37.9 years by 2050.[84]
According to the World Health Organization, the global average life expectancy is 70.5 years as of 2012, with women living an average of 73 years and men approximately 68 years.[80] In 2010, the global fertility rate was estimated at 2.52 children per woman.[78] In June 2012, British researchers calculated the total weight of Earth's human population as approximately 287 million tonnes, with the average person weighing around 62 kilograms (137 lb).[85]
The nominal 2013 gross world product was estimated at US$74.31 trillion by the CIA, giving an annual global per capita figure of around US$10,500.[86] Around 1.29 billion people (18.4% of the world population) live in extreme poverty, subsisting on less than US$1.25 per day;[87] approximately 870 million people (12.25%) are undernourished.[88] 83% of the world's over-15s are considered literate.[81] In June 2014, there were around 3.03 billion global Internet users, constituting 42.3% of the world population.[89]
The Han Chinese are the world's largest single ethnic group, constituting over 19% of the global population in 2011.[90] The world's most-spoken first languages are Mandarin Chinese (spoken by 12.44% of the world's population), Spanish (4.85%), English (4.83%), Arabic (3.25%) and Hindustani (2.68%).[81] The world's largest religion is Christianity, whose adherents account for 33.35% of the global population; Islam is the second-largest religion, accounting for 22.43%, and Hinduism the third, accounting for 13.78%.[81] In 2005, around 16% of the global population were reported to be non-religious.[91]
Largest populations by country

| Rank | Country / Territory | Population | Date | Approx. % of world population | Source |
|---|---|---|---|---|---|
| 1 | 1,380,300,000 | December 8, 2016 | 18.5% | [92] | |
| 2 | 1,308,930,000 | December 8, 2016 | 17.5% | [93] | |
| 3 | 325,099,000 | December 8, 2016 | 4.35% | [94] | |
| 4 | 261,600,000 | October 31, 2016 | 3.5% | [95] | |
| 5 | 206,798,000 | December 8, 2016 | 2.77% | [96] | |
| 6 | 195,028,000 | December 8, 2016 | 2.61% | [97] | |
| 7 | 188,500,000 | October 31, 2016 | 2.52% | [98] | |
| 8 | 161,559,000 | December 8, 2016 | 2.16% | [99] | |
| 9 | 146,400,000 | October 31, 2016 | 1.96% | [100] | |
| 10 | 129,100,000 | October 31, 2016 | 1.7% | [101] |
Approximately 4.3 billion people live in these ten countries, representing around 58% of the world's population as of March 2016. Approximately 3.7 billion people, or half of the world population, live in the six most populous countries.[102]
Most densely populated countries
The tables below list the world's most densely populated countries, both in absolute terms and in comparison to their total populations.
| Rank | Country | Population | Area (km2) | Density (Pop. per km2) |
|---|---|---|---|---|
| 1 | 5,535,000 | 710 | 7796 | |
| 2 | 161,560,000 | 143,998 | 1,122 | |
| 3 | 23,519,518 | 36,190 | 650 | |
| 4 | 50,801,405 | 99,538 | 510 | |
| 5 | 5,988,000 | 10,452 | 573 | |
| 6 | 11,553,188 | 26,338 | 439 | |
| 7 | 11,552,561 | 27,816 | 415 | |
| 8 | 17,070,000 | 41,526 | 411 | |
| 9 | 11,078,033 | 27,065 | 409 | |
| 10 | 1,308,930,000 | 3,287,240 | 398 |
| Rank | Country | Population | Area (km2) | Density (Pop. per km2) | Notes |
|---|---|---|---|---|---|
| 1 | 1,308,930,000 | 3,287,240 | 398 | Growing population | |
| 2 | 195,030,000 | 803,940 | 243 | Growing population | |
| 3 | 161,560,000 | 143,998 | 1,122 | Growing population | |
| 4 | 127,000,000 | 377,873 | 336 | Declining population[103] | |
| 5 | 103,430,000 | 300,000 | 345 | Growing population | |
| 6 | 92,700,000 | 331,689 | 279 | Growing population | |
| 7 | 65,110,000 | 243,610 | 267 | Slowly growing population | |
| 8 | 50,801,405 | 99,538 | 510 | Slowly growing population | |
| 9 | 23,519,518 | 36,190 | 650 | Steady population | |
| 10 | 21,203,000 | 65,610 | 323 | Slowly growing population |
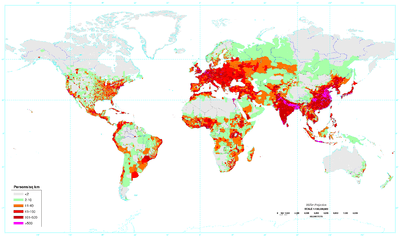
Fluctuation
.svg.png)
Population size fluctuates at differing rates in differing regions. Nonetheless, population growth is the long-standing trend on all inhabited continents, as well as in most individual states. During the 20th century, the global population saw its greatest increase in known history, rising from about 1.6 billion in 1900 to over 6 billion in 2000. This increase was due to a number of factors, including the lessening of the mortality rate in many countries by improved sanitation and medical advances, and a massive increase in agricultural productivity attributed to the Green Revolution.[104][105][106]
In 2000, the United Nations estimated that the world's population was growing at an annual rate of 1.14% (equivalent to around 75 million people),[107] down from a peak of 88 million per year in 1989. By 2000, there were approximately ten times as many people on Earth as there had been in 1700. Globally, the population growth rate has been steadily declining from its peak of 2.19% in 1963, but growth remains high in Latin America, the Middle East, and Sub-Saharan Africa.[108]

|
7–8 children
6–7 children
|
5–6 children
4–5 children
|
3–4 children
2–3 children
|
1–2 children
0–1 children
|
During the 2010s, Japan and some countries in Europe began to encounter negative population growth (i.e. a net decrease in population over time), due to sub-replacement fertility rates.[103]
In 2006, the United Nations stated that the rate of population growth was visibly diminishing due to the ongoing global demographic transition. If this trend continues, the rate of growth may diminish to zero by 2050, concurrent with a world population plateau of 9.2 billion.[109] However, this is only one of many estimates published by the UN; in 2009, UN population projections for 2050 ranged between around 8 billion and 10.5 billion.[110] An alternative scenario is given by the statistician Jorgen Randers, who argues that traditional projections insufficiently take into account the downward impact of global urbanization on fertility. Randers' "most likely scenario" reveals a peak in the world population in the early 2040s at about 8.1 billion people, followed by decline.[111]
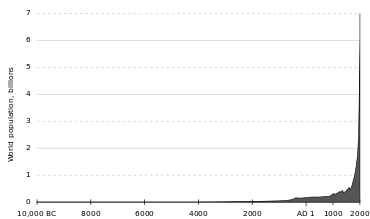 Estimated world population figures, 10,000 BCE–2000 CE
.png)
 World population figures, 1950–2000
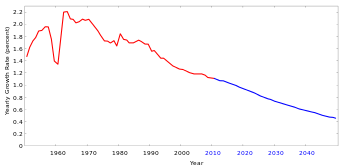 Estimated global growth rates, 1950–2050
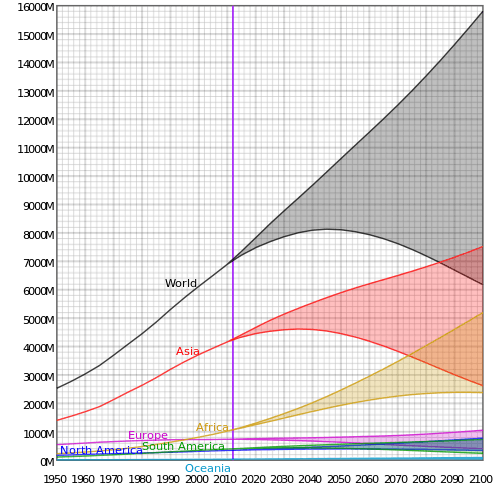 Estimated and projected populations of the world and its continents (except Antarctica) from 1950 to 2100. The shaded regions correspond to the range of projections by the United Nations Department of Economic and Social Affairs.
Population growth by region
The table below shows historical and predicted regional population figures in millions.[112][113][114] The availability of historical population figures varies by region.
| Region | 1500 | 1600 | 1700 | 1750 | 1800 | 1850 | 1900 | 1950 | 1999 | 2008 | 2010 | 2012 | 2050 | 2150 |
|---|---|---|---|---|---|---|---|---|---|---|---|---|---|---|
| World | 585 | 660 | 710 | 791 | 978 | 1,262 | 1,650 | 2,521 | 6,008 | 6,707 | 6,896 | 7,052 | 9,725 | 9,746 |
| Africa | 86 | 114 | 106 | 106 | 107 | 111 | 133 | 221 | 783 | 973 | 1,022 | 1,052 | 2,478 | 2,308 |
| Asia | 282 | 350 | 411 | 502 | 635 | 809 | 947 | 1,402 | 3,700 | 4,054 | 4,164 | 4,250 | 5,267 | 5,561 |
| Europe | 168 | 170 | 178 | 190 | 203 | 276 | 408 | 547 | 675 | 732 | 738 | 740 | 734 | 517 |
| Latin America[Note 1] | 40 | 20 | 10 | 16 | 24 | 38 | 74 | 167 | 508 | 577 | 590 | 603 | 784 | 912 |
| North America[Note 1] | 6 | 3 | 2 | 2 | 7 | 26 | 82 | 172 | 312 | 337 | 345 | 351 | 433 | 398 |
| Oceania | 3 | 3 | 3 | 2 | 2 | 2 | 6 | 13 | 30 | 34 | 37 | 38 | 57 | 51 |
| Region | 1500 | 1600 | 1700 | 1750 | 1800 | 1850 | 1900 | 1950 | 1999 | 2008 | 2010 | 2012 | 2050 | 2150 |
|---|---|---|---|---|---|---|---|---|---|---|---|---|---|---|
| World | 100 | 100 | 100 | 100 | 100 | 100 | 100 | 100 | 100 | 100 | 100 | 100 | 100 | 100 |
| Africa | 14.7 | 17.3 | 14.9 | 13.4 | 10.9 | 8.8 | 8.1 | 8.8 | 13.0 | 14.5 | 14.8 | 15.2 | 25.48 | 23.7 |
| Asia | 48.2 | 53.0 | 57.9 | 63.5 | 64.9 | 64.1 | 57.4 | 55.6 | 61.6 | 60.4 | 60.4 | 60.3 | 54.16 | 57.1 |
| Europe | 28.7 | 25.8 | 25.1 | 20.6 | 20.8 | 21.9 | 24.7 | 21.7 | 11.2 | 10.9 | 10.7 | 10.5 | 7.55 | 5.3 |
| Latin America[Note 1] | 6.8 | 3.0 | 1.4 | 2.0 | 2.5 | 3.0 | 4.5 | 6.6 | 8.5 | 8.6 | 8.6 | 8.6 | 8.06 | 9.4 |
| North America[Note 1] | 1.0 | 0.5 | 0.3 | 0.3 | 0.7 | 2.1 | 5.0 | 6.8 | 5.2 | 5.0 | 5.0 | 5.0 | 4.45 | 4.1 |
| Oceania | 0.5 | 0.5 | 0.4 | 0.3 | 0.2 | 0.2 | 0.4 | 0.5 | 0.5 | 0.5 | 0.5 | 0.5 | 0.59 | 0.5 |
Past population
The following table gives estimates of population in the past. The data for 1750 to 1900 are from the UN report "The World at Six Billion"[118] whereas the data from 1950 to 2015 are from a UN data sheet.[24]
| Year | World | Africa | Asia | Europe | Latin America & Carib.[Note 1] | North America[Note 1] | Oceania | Notes |
|---|---|---|---|---|---|---|---|---|
| 70,000 BCE | < 0.015 | [119] | ||||||
| 10,000 BCE | 4 | [120] | ||||||
| 8000 BCE | 5 | |||||||
| 6500 BCE | 5 | |||||||
| 5000 BCE | 5 | |||||||
| 4000 BCE | 7 | |||||||
| 3000 BCE | 14 | |||||||
| 2000 BCE | 27 | |||||||
| 1000 BCE | 50 | 7 | 33 | 9 | ||||
| 500 BCE | 100 | 14 | 66 | 16 | ||||
| CE 1 | 200 | 23 | 141 | 28 | ||||
| 1000 | 400 | 70 | 269 | 50 | 8 | 1 | 2 | |
| 1500 | 458 | 86 | 243 | 84 | 39 | 3 | 3 | |
| 1600 | 580 | 114 | 339 | 111 | 10 | 3 | 3 | |
| 1700 | 682 | 106 | 436 | 125 | 10 | 2 | 3 | |
| 1750 | 791 | 106 | 502 | 163 | 16 | 2 | 2 | |
| 1800 | 1,000 | 107 | 656 | 203 | 24 | 7 | 3 | |
| 1850 | 1,262 | 111 | 809 | 276 | 38 | 26 | 2 | |
| 1900 | 1,650 | 133 | 947 | 408 | 74 | 82 | 6 | |
| 1950 | 2,525 | 229 | 1,394 | 549 | 169 | 172 | 12.7 | [121] |
| 1955 | 2,758 | 254 | 1,534 | 577 | 193 | 187 | 14.2 | |
| 1960 | 3,018 | 285 | 1,687 | 606 | 221 | 204 | 15.8 | |
| 1965 | 3,322 | 322 | 1,875 | 635 | 254 | 219 | 17.5 | |
| 1970 | 3,682 | 366 | 2,120 | 657 | 288 | 231 | 19.7 | |
| 1975 | 4,061 | 416 | 2,378 | 677 | 326 | 242 | 21.5 | |
| 1980 | 4,440 | 478 | 2,626 | 694 | 365 | 254 | 23.0 | |
| 1985 | 4,853 | 550 | 2,897 | 708 | 406 | 267 | 24.9 | |
| 1990 | 5,310 | 632 | 3,202 | 721 | 447 | 281 | 27.0 | |
| 1995 | 5,735 | 720 | 3,475 | 728 | 487 | 296 | 29.1 | |
| 2000 | 6,127 | 814 | 3,714 | 726 | 527 | 314 | 31.1 | |
| 2005 | 6,520 | 920 | 3,945 | 729 | 564 | 329 | 33.4 | |
| 2010 | 6,930 | 1,044 | 4,170 | 735 | 600 | 344 | 36.4 | |
| 2015 | 7,349 | 1,186 | 4,393 | 738 | 634 | 358 | 39.3 |
Using the above figures, the change in population from 2010 to 2015 was:
- World: +420 million
- Africa: +142 million
- Asia: +223 million
- Europe: +3 million
- Latin America and Caribbean: +35 million
- Northern America: +14 million
- Oceania: +2.9 million
Projections
Long-term global population growth is difficult to predict. The United Nations and the US Census Bureau both give different estimates – according to the UN, the world population reached seven billion in late 2011,[112] while the USCB asserted that this occurred in March 2012.[122] The UN has issued multiple projections of future world population, based on different assumptions. From 2000 to 2005, the UN consistently revised these projections downward, until the 2006 revision, issued on March 14, 2007, revised the 2050 mid-range estimate upwards by 273 million.
Average global birth rates are declining fast, but vary greatly between developed countries (where birth rates are often at or below replacement levels) and developing countries (where birth rates typically remain high). Different ethnicities also display varying birth rates. Death rates can change rapidly due to disease epidemics, wars and other mass catastrophes, or advances in medicine.
| Year | UN est. (millions) |
Difference | USCB est. (millions) |
Difference |
|---|---|---|---|---|
| 2005 | 6,514 | – | 6,473 | – |
| 2010 | 6,916 | 402 | 6,866 | 393 |
| 2015 | 7,324 | 408 | 7,256 | 390 |
| 2020 | 7,717 | 393 | 7,643 | 380 |
| 2025 | 8,083 | 366 | 8,007 | 363 |
| 2030 | 8,425 | 342 | 8,341 | 334 |
| 2035 | 8,743 | 318 | 8,646 | 306 |
| 2040 | 9,039 | 296 | 8,926 | 280 |
| 2045 | 9,308 | 269 | 9,180 | 254 |
| 2050 | 9,551 | 243 | 9,408 | 228 |
| Year | World | Asia | Africa | Europe | Latin America/Caribbean | Northern America | Oceania |
|---|---|---|---|---|---|---|---|
| 2010 | 6,916 | 4,165 (60.2%) | 1,031 (14.9%) | 740 (10.7%) | 596 (8.6%) | 347 (5.0%) | 37 (0.5%) |
| 2015 | 7,324 | 4,385 (59.9%) | 1,166 (15.9%) | 743 (10.1%) | 630 (8.6%) | 361 (4.9%) | 39 (0.5%) |
| 2020 | 7,717 | 4,582 (59.4%) | 1,312 (17.0%) | 744 (9.6%) | 662 (8.6%) | 376 (4.9%) | 42 (0.5%) |
| 2025 | 8,083 | 4,749 (58.8%) | 1,468 (18.2%) | 741 (9.2%) | 691 (8.5%) | 390 (4.8%) | 45 (0.6%) |
| 2030 | 8,425 | 4,887 (58.0%) | 1,634 (19.4%) | 736 (8.7%) | 717 (8.5%) | 403 (4.8%) | 47 (0.6%) |
| 2035 | 8,743 | 4,997 (57.2%) | 1,812 (20.7%) | 730 (8.3%) | 739 (8.5%) | 415 (4.8%) | 50 (0.6%) |
| 2040 | 9,039 | 5,080 (56.2%) | 1,999 (22.1%) | 724 (8.0%) | 757 (8.4%) | 426 (4.8%) | 52 (0.6%) |
| 2045 | 9,308 | 5,136 (55.2%) | 2,194 (23.6%) | 717 (7.7%) | 771 (8.3%) | 436 (4.7%) | 55 (0.6%) |
| 2050 | 9,551 | 5,164 (54.1%) | 2,393 (25.1%) | 709 (7.4%) | 782 (8.2%) | 446 (4.7%) | 57 (0.6%) |
| 2055 | 9,766 | 5,168 (52.9%) | 2,595 (26.6%) | 700 (7.2%) | 788 (8.1%) | 456 (4.7%) | 59 (0.6%) |
| 2060 | 9,957 | 5,152 (51.7%) | 2,797 (28.1%) | 691 (6.9%) | 791 (7.9%) | 465 (4.7%) | 61 (0.6%) |
| 2065 | 10,127 | 5,120 (50.6%) | 2,998 (29.6%) | 681 (6.7%) | 791 (7.8%) | 474 (4.7%) | 63 (0.6%) |
| 2070 | 10,277 | 5,075 (49.4%) | 3,195 (31.1%) | 673 (6.5%) | 788 (7.6%) | 482 (4.7%) | 64 (0.6%) |
| 2075 | 10,409 | 5,019 (48.2%) | 3,387 (32.5%) | 665 (6.4%) | 783 (7.5%) | 490 (4.7%) | 66 (0.6%) |
| 2080 | 10,524 | 4,957 (47.1%) | 3,570 (33.9%) | 659 (6.3%) | 776 (7.4%) | 496 (4.7%) | 67 (0.6%) |
| 2085 | 10,626 | 4,894 (46.1%) | 3,742 (35.2%) | 653 (6.1%) | 767 (7.2%) | 502 (4.7%) | 68 (0.6%) |
| 2090 | 10,717 | 4,833 (45.1%) | 3,903 (36.4%) | 649 (6.1%) | 757 (7.1%) | 506 (4.7%) | 69 (0.6%) |
| 2095 | 10,794 | 4,773 (44.2%) | 4,051 (37.6%) | 644 (6.0%) | 747 (6.9%) | 510 (4.7%) | 69 (0.6%) |
| 2100 | 10,854 | 4,712 (43.4%) | 4,185 (38.6%) | 639 (5.9%) | 736 (6.8%) | 513 (4.7%) | 70 (0.6%) |
Mathematical approximations
In 1975, Sebastian von Hoerner proposed a formula for population growth which represented hyperbolic growth with an infinite population in 2025.[125] The hyperbolic growth of the world population observed until the 1970s was later correlated to a non-linear second order positive feedback between demographic growth and technological development. This feedback can be described as follows: technological advance → increase in the carrying capacity of land for people → demographic growth → more people → more potential inventors → acceleration of technological advance → accelerating growth of the carrying capacity → faster population growth → accelerating growth of the number of potential inventors → faster technological advance → hence, the faster growth of the Earth's carrying capacity for people, and so on.[126] The transition from hyperbolic growth to slower rates of growth is related to the demographic transition.
According to the Russian demographer Sergey Kapitsa,[127] the world population grew between 67,000 BCE and 1965 according to the following formula:

where
- N is current population
- T is the current year
- C = (1.86±0.01)·1011
- T0 = 2007±1
- = 42±1

Years for world population to double
According to linear interpolation and extrapolation of UNDESA population estimates, the world population has doubled, or will double, in the years listed in the tables below (with two different starting points). During the 2nd millennium CE, each doubling took roughly half as long as the previous doubling, fitting the hyperbolic growth model mentioned above. However, after 2024, it is unlikely that there will be another doubling of the global population in the 21st century.[128]

| Population (in billions) |
0.5 | 1 | 2 | 4 | 8 | |||||
|---|---|---|---|---|---|---|---|---|---|---|
| Year | 1500 | 1804 | 1927 | 1974 | 2024 | |||||
| Years elapsed | 304 | 123 | 47 | 50 | ||||||
| Population (in billions) |
0.375 | 0.75 | 1.5 | 3 | 6 | |||||
|---|---|---|---|---|---|---|---|---|---|---|
| Year | 1171 | 1715 | 1881 | 1960 | 1999 | |||||
| Years elapsed | 544 | 166 | 79 | 39 | ||||||
Overpopulation
Predictions of scarcity

In his 1798 work An Essay on the Principle of Population, the British scholar Thomas Malthus incorrectly predicted that continued population growth would exhaust the global food supply by the mid-19th century. The essay was written to refute what Malthus considered the unattainable utopian ideas of William Godwin and Marquis de Condorcet, as presented in Political Justice and The Future Progress of the Human Mind. In 1968, Paul R. Ehrlich reprised Malthus' argument in The Population Bomb, predicting that mass global famine would occur in the 1970s and 1980s.[130]
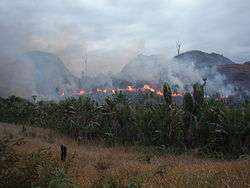
The predictions of Ehrlich and other neo-Malthusians were vigorously challenged by a number of economists, notably Julian Lincoln Simon, and advances in agriculture, collectively known as the Green Revolution, forestalled any potential global famine in the late 20th century. Between 1950 and 1984, as the Green Revolution transformed agriculture around the world, grain production increased by over 250%.[131] The world population has grown by over four billion since the beginning of the Green Revolution, but food production has so far kept pace with population growth. Most scholars believe that, without the Revolution, there would be greater levels of famine and malnutrition than the UN presently documents.[132] However, neo-Malthusians point out that the energy for the Green Revolution was provided by fossil fuels, in the form of natural gas-derived fertilizers, oil-derived pesticides, and hydrocarbon-fueled irrigation, and that many crops have become so genetically uniform that a crop failure in any one country could potentially have global repercussions.[133]
In 2004, a meta-analysis of 70 quantitative studies estimating a sustainable limit to the world population generated a meta-estimate of 7.7 billion people.[134]

In May 2008, the price of grain was pushed up severely by the increased cultivation of biofuels, the increase of world oil prices to over $140 per barrel ($880/m3),[135] global population growth,[136] the effects of climate change,[137] the loss of agricultural land to residential and industrial development,[138][139] and growing consumer demand in the population centres of China and India.[140][141] Food riots subsequently occurred in some countries.[142][143] However, oil prices then fell sharply. Resource demands are expected to ease as population growth declines, but it is unclear whether mass food wastage and rising living standards in developing countries will once again create resource shortages.[144][145]
David Pimentel, professor of ecology and agriculture at Cornell University, estimates that the sustainable agricultural carrying capacity for the United States is about 200 million people; its population as of 2015 is over 300 million.[146] In 2009, the UK government's chief scientific advisor, Professor John Beddington, warned that growing populations, falling energy reserves and food shortages would create a "perfect storm" of shortages of food, water, and energy by 2030.[129][147] According to a 2009 report by the United Nations Food and Agriculture Organisation (FAO), the world will have to produce 70% more food by 2050 to feed a projected extra 2.3 billion people.[148]
The observed figures for 2007 showed an actual increase in absolute numbers of undernourished people in the world, with 923 million undernourished in 2007, versus 832 million in 1995.[149] The 2009 FAO estimates showed an even more dramatic increase, to 1.02 billion.[150]
Environmental impacts
A number of scientists have argued that the current global population expansion and accompanying increase in resource consumption threatens the world's ecosystem, as well as straining humanity's ability to feed itself.[151][152] The InterAcademy Panel Statement on Population Growth, which was ratified by 58 member national academies in 1994, called the growth in human numbers "unprecedented", and stated that many environmental problems, such as rising levels of atmospheric carbon dioxide, global warming, and pollution, were aggravated by the population expansion.[153] Indeed, some analysts claim that overpopulation's most serious impact is its effect on the environment.[19] At the time of the 1994 IAP statement, the world population stood at 5.5 billion, and lower-bound scenarios predicted a peak of 7.8 billion by 2050, a number that current estimates state will be reached in the late 2020s.
Population control
.jpg)
Human population control is the practice of intervening to alter the rate of population growth. Historically, human population control has been implemented by limiting a region's birth rate, by voluntary contraception or by government mandate. It has been undertaken as a response to factors including high or increasing levels of poverty, environmental concerns, and religious reasons. The use of abortion in some population control strategies has caused controversy,[154] with religious organizations such as the Roman Catholic Church explicitly opposing any intervention in the human reproductive process.[155]
The University of Nebraska publication Green Illusions argues that population control to alleviate environmental pressures need not be coercive. It states that "Women who are educated, economically engaged, and in control of their own bodies can enjoy the freedom of bearing children at their own pace, which happens to be a rate that is appropriate for the aggregate ecological endowment of our planet."[156] The book Fatal Misconception by Matthew Connelly similarly points to the importance of supporting the rights of women in bringing population levels down over time.[157]
Overpopulation skepticism
The Population Research Institute (PRI), an anti-abortion, anti-contraception advocacy group, has criticised predictions of overpopulation and attendant resource scarcity, with some describing overpopulation as a "myth".[158] The PRI argues that advances in agricultural, medical, and industrial technology have allowed global economic productivity to keep pace with rising populations despite Malthusian predictions to the contrary. PRI further says that family sizes are naturally declining worldwide due to higher living standards, increased availability of contraception and better economic opportunities for women. However, other commentators have described PRI's arguments on overpopulation as deceptive.[159][160][161]
Number of humans who have ever lived
Estimates of the total number of humans who have ever lived range in the order of 100 billion. Estimates of this kind cannot hope to give more than the rough order of magnitude, as even modern population estimates are fraught with uncertainties of the order of 3% to 5%.[162] Kapitzka (1996) cites estimates ranging between 80 and 150 billion.[163]Another such estimate was prepared by Haub (1995), updated in 2002 and 2011; the 2011 figure was approximately 107 billion.[22][23][164] Haub characterized this figure as an estimate that required "selecting population sizes for different points from antiquity to the present and applying assumed birth rates to each period".[23]
One problem is in regard to the semantic difficulty of deciding the precise meaning of "human". A population of, say, 4 million, with an average lifespan of, say, 10 years (see below), implies a birthrate of 0.4 million per year, which over a period of 100 000 years represents 40 000 million people. Also, robust population data only exist for the last two or three centuries. Until the late 18th century, few governments had ever performed an accurate census. In many early attempts, such as in Ancient Egypt and the Persian Empire, the focus was on counting merely a subset of the population for purposes of taxation or military service.[165] Thus, there is a significant margin of error when estimating ancient global populations.
Another critical factor for such an estimate is the question of pre-modern infant mortality rates; these figures are very difficult to estimate for ancient times due to a lack of accurate records. Haub (1995) estimates that around 40% of those who have ever lived did not survive beyond their first birthday. Haub also stated that "life expectancy at birth probably averaged only about ten years for most of human history".[23]
See also
- Birth control
- Coastal population growth
- Demographic transition
- Depopulation
- Doomsday argument
- Family planning
- Food security
- Megacity
- Natalism
- One-child policy
- Population boom
- Population Matters, population control think tank and campaign group
- Two-child policy
- World's largest cities
Lists:
- List of urban areas by population
- List of population concern organizations
- List of countries by fertility rate
- List of countries by past and future population
- List of countries by population in 1900
- List of countries by population density
- List of countries by population growth rate
- Lists of organisms by population – for non-human global populations
- List of religious populations
Historical:
Notes
- ↑ Excluding its Special Administrative Regions (SARs) of Hong Kong and Macau.
- ↑ Including Central America and the Caribbean.
- ↑ The Antarctic Treaty System limits the nature of national claims in Antarctica. Of the territorial claims in Antarctica, the Ross Dependency has the largest population.
- ↑ Figure refers to Mainland China only. It excludes Taiwan and the special administrative regions of Hong Kong and Macau.
References
- ↑ "2016 World Population Data Sheet". Population Reference Bureau. Retrieved September 15, 2016.
- 1 2 3 "World Population Prospects - Population Division - United Nations". esa.un.org. Retrieved 2016-09-15.
- ↑ Jean-Noël Biraben (1980), "An Essay Concerning Mankind's Evolution". Population, Selected Papers. Vol. 4. pp. 1–13. Original paper in French: (b) Jean-Noël Biraben (1979)."Essai sur l'évolution du nombre des hommes". Population. Vol. 34 (no. 1). pp. 13–25.
- ↑ "World Population Prospects, 2012 revision (697 million births from 1985–1990)". United Nations. 2012. Archived from the original on August 27, 2014. Retrieved May 11, 2015.
- ↑ "Annual number of births – World". United Nations Population Division. 2011. Retrieved March 27, 2015.
- ↑ "World Population estimates by the US Census Bureau". USCB. Retrieved May 22, 2012.
- 1 2 "Population seven billion: UN sets out challenges". BBC News. October 26, 2011. Retrieved October 27, 2011.
- 1 2 Coleman, Jasmine (October 31, 2011). "World's 'seven billionth baby' is born". The Guardian. London. Retrieved October 31, 2011.
- 1 2 "7 billion people is a 'serious challenge". UPI. October 31, 2011. Retrieved November 9, 2011.
- ↑ "The World Population at 7 Billion". Random Samplings, official blog of the U.S. Census Bureau. October 31, 2011. Retrieved October 23, 2016.
- ↑ "CIA, The World Factbook: Field Listing: Median Age". www.cia.gov. Retrieved 15 September 2016.
- ↑ "World Population Prospects, the 2012 Revision – "Low variant" and "High variant" values". UN. 2012. Retrieved June 15, 2013.
- ↑ "World population projected to reach 9.6 billion by 2050 – UN report". UN News Centre. June 14, 2013. Retrieved June 16, 2013.
- 1 2 "Key Findings". Long-Range Population Projections (PDF). Proceedings of the United Nations Technical Working Group on Long-Range Population Projections. New York: United Nations: Department of Economic and Social Affairs. 2003. Retrieved July 3, 2010.
- ↑ "A model predicts that the world's populations will stop growing in 2050". ScienceDaily.com. April 4, 2013. Retrieved June 3, 2013.
- ↑ Carrington, Damien (September 18, 2014). "World population to hit 11bn in 2100 – with 70% chance of continuous rise". The Guardian. Retrieved September 21, 2014.
- ↑ Gerland, P.; Raftery, A. E.; Ev Ikova, H.; Li, N.; Gu, D.; Spoorenberg, T.; Alkema, L.; Fosdick, B. K.; Chunn, J.; Lalic, N.; Bay, G.; Buettner, T.; Heilig, G. K.; Wilmoth, J. (September 14, 2014). "World population stabilization unlikely this century". Science. AAAS. 346 (6206): 234–7. doi:10.1126/science.1257469. ISSN 1095-9203. PMC 4230924
 . PMID 25301627. Retrieved September 21, 2014.
 - ↑ Peter P. Rogers; Kazi F. Jalal & John A. Boyd (2008). An Introduction To Sustainable Development. Earthscan via Google Books. p. 53.
- 1 2 "Overpopulation's Real Victim Will Be the Environment". TIME. October 26, 2011. Retrieved February 18, 2013.
- ↑ Zehner, Ozzie (2012). Green Illusions. Lincoln and London: University of Nebraska Press. pp. 187–331.
- ↑ "Fact or Fiction". Scientificamerican.com.
- 1 2 Curtin, Ciara (March 1, 2007). "Fact or Fiction?: Living People Outnumber the Dead". Scientific American. Scientific American, Inc. (published September 2007). 297 (3): 126. doi:10.1038/scientificamerican0907-126. Retrieved August 4, 2008. Note: text of paper publication slightly different from text of on-line publication
- 1 2 3 4 Haub, Carl (November–December 2002). "How Many People Have Ever Lived on Earth?" (PDF). Population Today. Population Reference Bureau. 30 (8): 3–4. Retrieved August 4, 2008.
- 1 2 "World Population Prospects: The 2015 Revision". UN Population Division. Archived from the original on Dec 22, 2015.. Linked to at Download Files, where it states that the figures are for July 1 of the given year.
- ↑ "World Population Prospects: The 2010 Revision Population Database". United Nations. April 15, 2011. Retrieved April 21, 2012.
- 1 2 "Antarctica". CIA World Factbook. June 19, 2014. Retrieved March 18, 2015.
- ↑ the compound "world population" becomes common from c. the 1930s, adapted from early 20th-century "world's population"; pre-20th century authors use "population of the world".
- ↑ "The population of the world, which Sir W. P. in 1682, stated at only 320 millions, has been estimated by some writers at about 730 millions, by others, at upwards of 900 millions; Mr. Wallace, of Edinburgh, conjectured it might amount to 1000 millions, and this number has since generally been adopted who have noticed the subject;" The Monthly Magazine 4 (July–December 1797), p. 167.
- ↑ 600 million: Simon Gray, The Happiness of States (1818), p. 356. 800 million: Gordon Hall, Samuel Newell, The Conversion of the World (1818), p. 10. 800 to 1000 million: John Redman Coxe, Considerations Respecting the Recognition of Friends in Another World (1845), p. 21 (footnote with references).
- ↑ Luc-Normand Tellier (2009). Urban world history: an economic and geographical perspective. PUQ via Google Books. p. 26. ISBN 2-7605-1588-5.
- ↑ Ralph Thomlinson, 1975, Demographic Problems: Controversy over population control, 2nd Ed., Dickenson Publishing Company, Ecino, CA, ISBN 0-8221-0166-1.
- ↑ Dr. Kenneth W. Harl (1998). "Population estimates of the Roman Empire". Tulane.edu. Retrieved December 8, 2012.
- ↑ "Plague, Plague Information, Black Death Facts, News, Photos". National Geographic. Retrieved November 3, 2008.
- ↑ "History of Europe – Demographic and agricultural growth". Encyclopædia Britannica. 2012. Retrieved December 17, 2012.
- ↑ "Historical Estimates of World Population". Census.gov. Retrieved November 12, 2016.
- ↑ Jay, Peter (July 17, 2000). "A Distant Mirror". TIME Europe. 156 (3). Archived from the original on July 25, 2008. Retrieved August 9, 2014.
- ↑ Horst R. Thieme (2003). Mathematics in population biology. Princeton University Press via Google Books. p. 285. ISBN 0-691-09291-5.
- ↑ Graziella Caselli; Gillaume Wunsch & Jacques Vallin (2005). Demography: Analysis and Synthesis, Four Volume Set: A Treatise in Population. Academic Press via Google Books. p. 34. ISBN 0-12-765660-X.
- 1 2 Nishijima, Sadao (1986), "The economic and social history of Former Han", in Twitchett, Denis; Loewe, Michael, Cambridge History of China: Volume I: the Ch'in and Han Empires, 221 B.C. – A.D. 220, Cambridge: Cambridge University Press, pp 595-96.
- ↑ "Qing China's Internal Crisis: Land Shortage, Famine, Rural Poverty". Columbia University: Asia for Educators. 2009. Retrieved July 9, 2013.
- ↑ "History of Europe – Demographics". Encyclopædia Britannica. Retrieved July 9, 2013.
- ↑ "China's Population: Readings and Maps". Columbia University: East Asian Curriculum Project. Retrieved December 18, 2012.
- ↑ "The Columbian Exchange". University of North Carolina. Retrieved December 18, 2012.
- ↑ Collingham, Lizzie (2006). Vindaloo: the Portuguese and the chilli pepper. Curry: A Tale of Cooks and Conquerors. Oxford: Oxford University Press. pp. 47–73. ISBN 978-0-19-988381-3.
- ↑ "Super-Sized Cassava Plants May Help Fight Hunger In Africa". Ohio State University. May 24, 2006. Retrieved July 9, 2013.
- ↑ James Brabazon (2000). Albert Schweitzer: a biography. Syracuse University Press via Google Books. p. 242. ISBN 0-8156-0675-3.
- ↑ S. Chandrasekhar (2013). Infant Mortality, Population Growth and Family Planning in India: An Essay on Population Problems and International Tensions. Routledge. pp. 24–7. ISBN 1136883061.
- ↑ Maheshwari, Shriram (1996). The Census Administration Under the Raj and After. Concept Publishing Company. p. 14. ISBN 817022585X.
- ↑ "Microchronology and Demographic Evidence Relating to the Size of Pre-Columbian North American Indian Populations". Science. June 16, 1995. Retrieved July 9, 2013.
- ↑ Arthur C. Aufderheide; Conrado Rodríguez-Martín & Odin Langsjoen (1998). The Cambridge encyclopedia of human paleopathology. Cambridge University Press via Google Books. p. 205. ISBN 0-521-55203-6.
- ↑ "The Story Of... Smallpox – and other Deadly Eurasian Germs". Public Broadcasting Service. 2005. Retrieved April 24, 2013.
- ↑ Austin Alchon, Suzanne (2003). A pest in the land: new world epidemics in a global perspective. University of New Mexico Press. p. 31. ISBN 0-8263-2871-7.
- ↑ "World Demographics Profile 2012". Index Mundi. Retrieved May 22, 2012.
- ↑ "By 2050, 70% of the world's population will be urban. Is that a good thing?". Fast Co. Design. 2012. Retrieved May 1, 2012.
- ↑ Population crises and cycles in history – A review by Claire Russell and W.M.S. Russell, Vicnet.net.au, retrieved March 26, 2015
- ↑ Buer, Mabel C. (1926). Health, Wealth and Population in the Early Days of the Industrial Revolution. London: George Routledge & Sons. p. 30. ISBN 0-415-38218-1.
- ↑ "The Foundling Hospital". BBC History. October 5, 2012. Retrieved April 22, 2013.
- ↑ "Modernization – Population Change". Encyclopædia Britannica. Retrieved February 6, 2013.
- ↑ Graziella Caselli; Gillaume Wunsch & Jacques Vallin (2005). Demography: Analysis and Synthesis, Four Volume Set: A Treatise in Population. Academic Press via Google Books. p. 42. ISBN 0-12-765660-X.
- ↑ "Victorian Medicine – From Fluke to Theory". BBC History. February 1, 2002. Retrieved February 17, 2013.
- ↑ "A portrait of Britain in 2031". The Independent. October 24, 2007. Retrieved February 17, 2013.
- ↑ "UK population breaks through 60m". BBC News. August 24, 2006. Retrieved April 14, 2012.
- ↑ "US population through history". About.com. Retrieved April 14, 2012.
- ↑ Jay Winter, Emmanuel Sivan (2000). War and Remembrance in the Twentieth Century. Cambridge University Press. p. 64. ISBN 0521794366.
- ↑ Mark Harrison (2002). Accounting for War: Soviet Production, Employment, and the Defence Burden, 1940–1945. Cambridge University Press via Google Books. p. 167. ISBN 0-521-89424-7.
- ↑ "Vladimir Putin vows to reverse Russian population decline". The Daily Telegraph. February 13, 2012. Retrieved April 13, 2012.
- ↑ "Russia's Population Decline Said To Have 'Stopped'". Radio Free Europe. May 27, 2013. Retrieved June 15, 2013.
- ↑ "China's demographic evolution 1850–1953 reconsidered". The China Quarterly. JSTOR. 1978. Retrieved April 13, 2012.
- ↑ "Reintegrating India with the World Economy" (PDF). Peterson Institute for International Economics. 2003. Retrieved November 8, 2012.
- ↑ "India". CIA World Factbook. July 2012. Retrieved October 21, 2012.
- ↑ "Java (island, Indonesia)". Encyclopædia Britannica. Retrieved July 7, 2013.
- ↑ Jorge Durand (March 2004). "From Traitors to Heroes: 100 Years of Mexican Migration Policies". University of Guadalajara. Retrieved July 16, 2013.
- ↑ "Population and Housing Census: Mexico 2010" (PDF). University of Minnesota. March 3, 2011. Retrieved July 16, 2013.
- ↑ Gunnar Heinsohn (January 7, 2008). "Kenya's Violence: Exploding population". The New York Times. Retrieved July 7, 2013.
- ↑ "The World at Six Billion: Introduction" (PDF). United Nations. 1999. Archived from the original (PDF) on January 1, 2016. Retrieved July 14, 2013.
- ↑ "U.S. Census Bureau – World POPClock Projection". July 2013. The number on this page is automatically updated daily.
- 1 2
- "Ch. 5: Population Size and Composition". World Population Prospects, the 2000 Revision (PDF). Vol.III. United Nations Population Division. p. 171. Retrieved July 3, 2010.
- "Executive Summary". World Population Prospects: The 2002 Revision Volume III: Analytical Report (PDF). 2002. Retrieved July 3, 2010.
- "World Population to 2300" (PDF). New York: United Nations Department of Economic and Social Affairs: Population Division. 2004: 3, 14. Retrieved July 3, 2010.
- "World Population: 1950–2050". United States Census Bureau. June 2010. Retrieved July 3, 2010.
- "2009 World Population Data Sheet" (PDF). Washington, DC: Population Reference Bureau. 2009. Retrieved July 3, 2010.
- 1 2 "Total fertility estimates, 1950–2010". UN Population Division. April 2011. Retrieved June 14, 2012.
- ↑ "World Population Prospects, the 2008 Revision – Frequently Asked Questions". Population Division of the Department of Economic and Social Affairs of the United Nations Secretariat. November 10, 2010. Retrieved March 26, 2015.
- 1 2 "World Health Statistics 2014: Large gains in life expectancy". World Health Organization. May 15, 2014. Retrieved March 14, 2015.
- 1 2 3 4 5 "World Demographics Profile 2011". Index Mundi. Retrieved November 18, 2011.
- ↑ "Sex-ratio imbalance in Asia: Trends, consequences and policy responses" (PDF). UNFPA. 2007. Retrieved May 20, 2012.
- ↑ "World Demographics Profile 2014". Index Mundi. Retrieved October 4, 2014.
- ↑ Janneh, Abdoulie (April 2012). "General debate on national experience in population matters: adolescents and youth" (PDF). United Nations Economic Commission for Africa. Retrieved February 19, 2014.
- ↑ "Global weight gain more damaging than rising numbers". BBC. June 18, 2012. Retrieved February 12, 2013.
- ↑ "World". CIA World Factbook. 2015. Retrieved January 17, 2015.
- ↑ "What It Will Take to 'Graduate' 1.2 Billion People Out of Extreme Poverty". The Huffington Post. April 4, 2012. Retrieved April 26, 2012.
- ↑ Food and Agriculture Organization of the United Nations, The State of Food Insecurity in the World. WorldHunger.org. 2012. Retrieved April 26, 2012.
- ↑ "Statistics". Internet World Stats. June 30, 2014. Retrieved March 5, 2015.
- ↑ "World’s Most Typical Person: Han Chinese Man". Wall Street Journal. March 4, 2011. Retrieved November 18, 2011.
- ↑ Religions by adherents. Adherents.com. 2005 data. Retrieved December 19, 2011.
- ↑ "Chinese Official Population Clock (updated daily, in Chinese)". National Bureau of Statistics of China. Retrieved August 23, 2016.
- ↑ "Official population clock". IndiaStat.com. Retrieved October 4, 2014.
- ↑ "United States Official Population Clock (updated daily)". USCB. Retrieved May 22, 2012.
- ↑ "Penduduk Indonesia Tengah Tahun menurut Jenis Kelamin". BI.go.id. Retrieved March 21, 2015.
- ↑ "Official population clock". IBGE.gov.br. Retrieved October 4, 2014.
- ↑ "Official Pakistani Population Clock". Population Census Organization of Pakistan. Retrieved November 15, 2012.
- ↑ "Population, total". World Bank. 2014. Retrieved March 21, 2015.
- ↑ "Official population clock". BBS.gov.bd. Retrieved October 4, 2014.
- ↑ "Official estimate (including Crimea and Sevastopol)". GKS.ru. Retrieved March 21, 2015.
- ↑ "Japan population". Official Japan Statistics Bureau. Retrieved October 4, 2014.
- ↑ Hackett, C. (11 July 2014). "Which six countries hold half the world's population?". Pew Research Center. Retrieved 13 March 2015.
- 1 2 Demetriou, Danielle (April 17, 2013). "Japan's population suffers biggest fall in history". Daily Telegraph. London. Retrieved July 22, 2013.
- ↑ "The limits of a Green Revolution?". BBC News. March 29, 2007. Retrieved August 1, 2010.
- ↑ "The Real Green Revolution". Energybulletin.net. Archived from the original on April 22, 2008. Retrieved August 1, 2010.
- ↑ "World Population to 2300" (PDF). United Nations Department of Economic and Social Affairs. 2004. Retrieved June 16, 2013.
- ↑ "International Programs". USCB. January 7, 2009. Retrieved December 16, 2012.
- ↑ Ron Nielsen (2006). The Little Green Handbook. New York: Picador. ISBN 0-312-42581-3.
- ↑ "2006 report highlights" (PDF). United Nations. Retrieved August 1, 2010.
- ↑ "UN population estimates and projections, database query, August 2009". United Nations. March 11, 2009. Retrieved August 1, 2010.
- ↑ Randers, Jorgen (2012). 2052: A Global Forecast for the Next Forty Years. Vermont: Chelsea Green Publishing. p. 62.
- 1 2 "World Population Prospects: The 2008 Revision" (PDF). Population Division of the Department of Economic and Social Affairs of the United Nations Secretariat. June 2009. Retrieved June 20, 2013.
- ↑ "The World at Six Billion". United Nations. October 12, 1999. Retrieved August 1, 2010.
- ↑ "Population Growth over Human History". University of Michigan. January 4, 2006. Retrieved March 9, 2013.
- 1 2 Figures include the former Soviet countries in Europe. Caselli, Graziella; Gillaume Wunsch; Jacques Vallin (December 20, 2005). Demography: Analysis and Synthesis, Four Volume Set: A Treatise in Population. Academic Press. p. 42. ISBN 978-0-12-765660-1.
- 1 2 "UN report – 2004 data" (PDF). Archived from the original (PDF) on January 1, 2016. Retrieved August 1, 2010.
- ↑ "World Population Prospects The 2015 Revision" (PDF).
- ↑ "The World at Six Billion". UN Population Division. Archived from the original on March 5, 2016., Table 2
- ↑ Fewer than 15,000 individuals, according to the Toba catastrophe theory, though this theory has been criticized by some scientists. See: "Toba super-volcano catastrophe idea "dismissed"". BBC News. April 30, 2013. Retrieved March 21, 2015.
- ↑ An approximation based on figures from different sources as listed at the US Census Bureau's Historical Estimates of World Population; see also *Kremer, Michael (1993). "Population Growth and Technological Change: One Million B.C. to 1990". The Quarterly Journal of Economics. 108 (3): 681–716. doi:10.2307/2118405.
- ↑ An approximation based on figures from different sources as listed at the US Census Bureau's Total Midyear Population for the World: 1950-2050
- ↑ "Notes on the World POPClock and World Vital Events". US Census Bureau. Retrieved February 12, 2013.
- 1 2 "World Population Prospects: The 2012 Revision" (XLS). Population Division of the Department of Economic and Social Affairs of the United Nations Secretariat. June 2013. Retrieved August 7, 2013.
- ↑ "World Population – Total Midyear Population for the World: 1950–2050". Census.gov. July 2015. Retrieved March 7, 2016.
- ↑ Sebastien von Hoerner (1975). "Population Explosion and Interstellar Expansion". Journal of the British Interplanetary Society (28): 691–712.
- ↑ Introduction to Social Macrodynamics. Andrey Korotayev et al. For a rigorous mathematical analysis of this issue, see "A Compact Mathematical Model of the World System Economic and Demographic Growth, 1 CE – 1973 CE".
- ↑ Kapitsa, Sergei P. (1996). "The phenomenological theory of world population growth". Physics-Uspekhi. 39 (1): 57–71. Archived from the original on May 11, 2009. Retrieved 2013-07-26.
- ↑ Lutz, Wolfgang; Sanderson, Warren; Scherbov, Sergei (1997-06-19). "Doubling of world population unlikely". Nature. 387 (6635): 803–805. doi:10.1038/42935. PMID 9194559. Retrieved 2012-10-23.
- 1 2 "World faces 'perfect storm' of problems by 2030, chief scientist to warn". The Guardian. March 18, 2009. Retrieved February 18, 2013.
- ↑ Jowit, Juliette (October 23, 2011). "Paul Ehrlich, a prophet of global population doom who is gloomier than ever". The Guardian. London. Retrieved July 22, 2013.
- ↑ Kindall, Henery W & Pimentel, David (May 1994). "Constraints on the Expansion of the Global Food Supply". Ambio. 23 (3).
- ↑ "The limits of a Green Revolution?". BBC News. March 29, 2007. Retrieved February 18, 2013.
- ↑ "Host Plant Resistance and Conservation of Genetic Diversity". Radcliffe's IPM World Textbook. University of Minnesota. March 2013. Retrieved July 20, 2013.
- ↑ van den Bergh, Jeroen C. J. M.; Rietveld, Piet (2004). "Reconsidering the Limits to World Population: Meta-analysis and Meta-prediction". BioScience. 54 (3): 195. doi:10.1641/0006-3568(2004)054[0195:RTLTWP]2.0.CO;2. ISSN 0006-3568.
- ↑ "The global grain bubble". Christian Science Monitor. January 18, 2008. Retrieved February 18, 2013.
- ↑ James Randerson, science correspondent (March 7, 2008). "Food crisis will take hold before climate change, warns chief scientist". The Guardian. London. Retrieved February 18, 2013.
- ↑ John Vidal, environment editor (November 3, 2007). "Global food crisis looms as climate change and fuel shortages bite". The Guardian. London. Retrieved February 18, 2013.
- ↑ Walsoft (February 22, 2008). "Experts: Global Food Shortages Could 'Continue for Decades'". Marketoracle.co.uk. Retrieved February 18, 2013.
- ↑ Moya K. Mason. "Has Urbanization Caused a Loss to Agricultural Land?". Moyak.com. Retrieved July 9, 2013.
- ↑ Walt, Vivienne (February 27, 2008). "The World's Growing Food-Price Crisis". Time. Retrieved February 18, 2013.
- ↑ "The cost of food: Facts and figures". BBC. October 16, 2008. Retrieved February 18, 2013.
- ↑ Julian Borger (February 26, 2008). "Feed the world? We are fighting a losing battle, UN admits". The Guardian. London. Retrieved February 18, 2013.
- ↑ Buchanan, Emily (April 22, 2008). "Assessing the global food crisis". BBC News. Retrieved April 6, 2010.
- ↑ "Half of all food 'wasted' report claims". BBC. January 10, 2013. Retrieved January 10, 2013.
- ↑ "Oil shock could push world food prices higher". CNN Money. March 3, 2011. Retrieved February 18, 2013.
- ↑ P. Crabbè (2000). Implementing ecological integrity: restoring regional and global environmental and human health. North Atlantic Treaty Organization Scientific Affairs Division/Springer. p. 411. ISBN 0-7923-6351-5.
- ↑ "Global crisis 'to strike by 2030". BBC News. March 19, 2009. Retrieved February 18, 2013.
- ↑ "Global food production will have to increase 70% for additional 2.3 billion people by 2050". Finfacts.com. September 24, 2009. Retrieved February 18, 2013.
- ↑ "The State of Food Insecurity in the World, 2008: High food prices and food security – threats and opportunities". UN Food and Agriculture Organization – Economic and Social Development Department. 2008. p. 2. Retrieved December 8, 2012.
- ↑ "One sixth of humanity undernourished – more than ever before". Food and Agriculture Organization of the United Nations. 2009. Retrieved December 8, 2012.
- ↑ "Ecological Debt Day". Retrieved February 18, 2013.
- ↑ "Planetary Boundaries: Specials". Nature. September 23, 2009. Retrieved February 18, 2013.
- ↑ "IAP (login required)". InterAcademies.net. Archived from the original on February 10, 2010. Retrieved February 18, 2013.
- ↑ Some population control programs, such as China's one-child policy, entail the use of forced late-term abortions, sparking domestic anger and international condemnation: "China one-child policy leads to forced abortions, mothers' deaths". Los Angeles Times. June 15, 2012. Retrieved August 29, 2012.
- ↑ "Fighting poverty to build peace". Vatican. January 1, 2009. Retrieved October 24, 2011.
- ↑ Zehmer, Ozzie (2012). Green lllusions. Lincoln and London: University of Nebraska. p. 188.
- ↑ Connelly, Matthew (2008). Fatal Misconception: The Struggle to Control World Population. Harvard University Press via Google Books.
- ↑ "Debunking the Myth of Overpopulation". Population Research Institute. 2013. Retrieved February 19, 2014.
- ↑ "IAP Statement on Population and Consumption". InterAcademy Panel: The Global Network of Science Academies (IAP). June 14, 2012. Retrieved March 13, 2015.
- ↑ "A Response to Critics of Family Planning Programs". Guttmacher.org. March 1, 2009. Retrieved November 18, 2014.
- ↑ "Global Environment Outlook – Environment for the future we want" (PDF). UNEP. May 2012. Retrieved November 18, 2014.
- ↑ "It should be noted that even recent demographic data is accurate only from 3 to 5%, although in demography traditionally more digits are indicated than those having a meaning. This is partially due to the ethical difficulty in rounding off numbers that supposedly represent real people, officially counted during a census." Sergei P Kapitza, 'The phenomenological theory of world population growth', Physics-Uspekhi 39(1) 57-71 (1996).
- ↑ Sergei P Kapitza, 'The phenomenological theory of world population growth', Physics-Uspekhi 39(1) 57-71 (1996), citing K. M. Weiss, Human Biology 56637 (1984) and N. Keyfitz, Applied Mathematical Demography (New York: Wiley, 1977).
- ↑ Haub, Carl (October 2011). "How Many People Have Ever Lived on Earth?". Population Reference Bureau. Retrieved April 29, 2013.
- ↑ Kuhrt, A. (1995). The Ancient Near East, c. 3000–330 BCE. Vol. 2. London: Routledge. p. 695.
External links
| Wikimedia Commons has media related to World population statistics. |
- Further reading
- Cohen, Joel E. (1995). How Many People Can The Earth Support?. New York: W. W. Norton. ISBN 0-393-31495-2.
- "World Population Prospects, the 2012 Revision". United Nations Population Division. Retrieved May 19, 2014.
- "World Population Prospects, the 2010 Revision". United Nations Population Division. Retrieved June 25, 2013.
- "World Population History Graph" World population graph 10000 BCE - 1950 CE.
- "Symptoms of The Global Demographic Decline". Demographia.ru. Retrieved June 25, 2013.
- World Factbook 2012. US Central Intelligence Agency (CIA). Retrieved November 6, 2012.
- "The World in Balance" (transcript). Two-part PBS Nova on world population. April 20, 2004. Retrieved July 19, 2013.
- "The Environmental Politics of Population and Overpopulation". University of California, Berkeley. 2012. Retrieved July 19, 2013.
- "Global population: Faces of the future". The Economist. June 22, 2013. Retrieved June 25, 2013.
- "Creating new life – and other ways to feed the world". BBC. July 23, 2013. Retrieved July 23, 2013.
- World Population Growth (Oct 2016), Esteban Ortiz-Ospina and Max Roser, OurWorldInData.org
- Organizations
- Optimum Population Trust
- The Day of 6 Billion and 7 Billion – Official homepages maintained by UNFPA
- Population Reference Bureau – News and issues related to population
- Berlin Institute for Population and Development
- Statistics and maps
- HiveGroup.com – World population statistics presented in a treemap interface
- PopulationLabs.com – World population map and graph
- PopulationData.net – Information and maps about populations around the world
- GeoHive.com – World statistics including population and future predictions
- Win.tue.nl – World countries mapped by population size
- World-statistics.org – World statistics including population and projections
- Population clocks
Human/World population | |
|---|---|
| Major topics | |
| Biological and related topics | |
| Human impact on the environment | |
| Literature |
|
| Publications | |
| Lists | |
Events and organizations | |
| Related topics | |
| |