Affluence in the United States
| This article is part of a series on |
| Income in the United States of America |
|---|
 |
|
Lists by income |
|
|
Affluence refers to an individual's or household's economical and financial advantage in comparison to a given reference group.[1]
Affluence as a metric

Affluence in the United States has been attributed in many cases to inherited wealth amounting to "a substantial head start":[4][5] in September 2012, the Institute for Policy Studies found that over 60 percent of the Forbes richest 400 Americans had grown up with substantial privilege.[6]
Income is commonly used to measure affluence, although this is a relative indicator: an middle class person with a personal income of $77,500 annually and a billionaire may both be referred to as affluent, depending on reference groups. An average American with a median income of $32,000[7] ($39,000 for those employed full-time between the ages of 25 and 64)[8] when used as a reference group would justify the personal income in the tenth percentile of $77,500 being described as affluent,[7] but if this earner were compared to an executive of a Fortune 500 company, then the description would not apply.[9][10] Accordingly, marketing firms and investment houses classify those with household incomes exceeding $250,000 as mass affluent, while the threshold upper class is most commonly defined as the top 1% with household incomes commonly exceeding $525,000 annually.
According to the U.S. Census Bureau, 42% of U.S. households have two income earners, thus making households' income levels higher than personal income levels;[11] the percent of married-couple families with children where both parents work is 59.1%.[12]
In 2005 the economic survey revealed the following income distribution for households and individuals:
- The top 5% of individuals had six figure incomes (exceeding $100,000); the top 10% of individuals had incomes exceeding $75,000;[7]
- The top 5% of households, three quarters of whom had two income earners, had incomes of $166,200 (about 10 times the 2009 US minimum wage) or higher,[11] with the top 10% having incomes well in excess of $100,000.[13]
- The top 0.12% had incomes exceeding $1,600,000 annually.[14]
Households may also be differentiated among each other, depending on whether or not they have one or multiple income earners (the high female participation in the economy means that many households have two working members[15]). For example, in 2005 the median household income for a two income earner households was $67,000 while the median income for an individual employed full-time with a graduate degree was in excess of $60,000, demonstrating that nearly half of individuals with a graduate degree have higher earnings than most dual income households.[8]
By another measure - the number of square feet per person in the home - the average home in the United States has more than 700 square feet per person, 50% - 100% more than in other high-income countries (though this indicator may be regarded as an accident of geography, climate and social preference, both within the USA and beyond it) but this metric indicates even those in the lowest income percentiles enjoy more living space than the middle classes in most European nations. Similarly ownership levels of 'gadgets' and access to amenities are exceptionally high compared to many other countries.[16][17]
Another, possibly more objective indicator is the fact that immigrants to the US come from all over the world and its net migration rate is among the highest in the world.
Overall, the term affluent may be applied to a variety of individuals, households, or other entities, depending on context. Data from the U.S. Census Bureau serves as the main guideline for defining affluence. U.S. government data not only reveal the nation's income distribution but also the demographic characteristics of those to whom the term "affluent", may be applied.[11]
Top percentiles
Affluence and economic standing within society are often expressed in terms of percentile ranking. Economic ranking is conducted either in terms of giving lower thresholds for a designated group (e.g. the top 5%, 10%, 15%, etc.) or in terms of the percentage of households/individuals with incomes above a certain threshold (e.g. above $75,000, $100,000, $150,000, etc.). The table below presents 2006 income data in terms of the lower thresholds for the given percentages (e.g. the top 25.6% of households had incomes exceeding $80,000, compared to $47,000 for the top quarter of individuals).[7][13]
| Data | Top third | Top quarter | Top quintile | Top 15% | Top 10% | Top 5% | Top 3% | Top 1.5% | Top 0.1%[14] | |
|---|---|---|---|---|---|---|---|---|---|---|
| Household income[13] | ||||||||||
| Lower threshold (annual gross income) | $65,000 | $80,000 | $91,202 | $100,000 | $118,200 | $166,200 | $200,000 | $250,000 | $1,600,000 | |
| Exact percentage of households | 34.72% | 25.60% | 20.00% | 17.80% | 10.00% | 5.00% | 2.67% | 1.50% | 0.12% | |
| Personal income (age 25+)[7] | ||||||||||
| Lower threshold (annual gross income) | $37,500 | $47,500 | $52,500 | $62,500 | $75,000 | $100,000 | N/A | |||
| Exact percentage of individuals | 33.55% | 24.03% | 19.74% | 14.47% | 10.29% | 5.63% | N/A | |||
Source: U.S. Census Bureau, 2006[7][13]
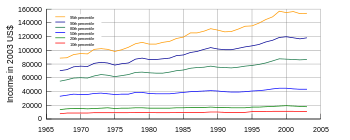
Household income over time
Household income changes over time, with income gains being substantially larger for the upper percentiles than for the lower percentiles.[19] All areas of the income strata have seen their incomes rise since the late 1960s, especially during the late 1990s.[18] The overall increase in household income is largely the result of an increase in the percentage of households with more than one income earner. While households with just one income earner, most commonly the male, were the norm in the middle of the 20th century, 42% of all households and the vast majority of married couple households now have two or more income earners. With so many households now having two income earners, the substantial increase in household income is easily explained:[15]
The typical middle-class household in the United States is no longer a one-earner family, with one parent in the workforce and one at home full-time. Instead, the majority of families with small children now have both parents rising at dawn to commute to jobs so they can both pull in paychecks... Today the median income for a fully employed male is $41,670 per year (all numbers are inflation-adjusted to 2004 dollars)—nearly $800 less than his counterpart of a generation ago. The only real increase in wages for a family has come from the second paycheck earned by a working mother. – Elizabeth Warren, Harvard Magazine.[15]
Two income-earner households are more common among the top quintile of households than the general population: 2006 U.S. Census Bureau data indicates that over three quarters, 76%, of households in the top quintile, with annual incomes exceeding $91,200, had two or more income earners compared to just 42% among the general population and a small minority in the bottom three quintiles. As a result, much of the rising income inequity between the upper and lower percentiles can be explained through the increasing percentage of households with two or more incomes.[15][19]
| Data | 2003 | 2000 | 1997 | 1994 | 1991 | 1988 | 1985 | 1982 | 1979 | 1976 | 1973 | 1970 | 1967 |
|---|---|---|---|---|---|---|---|---|---|---|---|---|---|
| 20th percentile | $17,984 | $19,142 | $17,601 | $16,484 | $16,580 | $17,006 | $16,306 | $15,548 | $16,457 | $15,615 | $15,844 | $15,126 | $14,002 |
| Median (50th) | $43,318 | $44,853 | $42,294 | $39,613 | $39,679 | $40,678 | $38,510 | $36,811 | $38,649 | $36,155 | $37,700 | $35,832 | $33,338 |
| 80th percentile | $86,867 | $87,341 | $81,719 | $77,154 | $74,759 | $75,593 | $71,433 | $66,920 | $68,318 | $63,247 | $64,500 | $60,148 | $55,265 |
| 95th percentile | $154,120 | $155,121 | $144,636 | $134,835 | $126,969 | $127,958 | $119,459 | $111,516 | $111,445 | $100,839 | $102,243 | $95,090 | $88,678 |
Source: U.S. Census Bureau (2004): "Income, Poverty, and Health Insurance Coverage in the United States: 2003", p. 36 et seq. All figures are inflation-adjusted and given in 2003 dollars.[18]
Median income levels
| Households | Persons, age 25 or older with earnings | Household income by race or ethnicity | |||||||
|---|---|---|---|---|---|---|---|---|---|
| All households | Dual earner households |
Per household member |
Males | Females | Both sexes | Asian | Non-Hispanic White | Hispanic (of any race) |
Black |
| $46,326 | $67,348 | $23,535 | $39,403 | $26,507 | $32,140 | $57,518 | $48,977 | $34,241 | $30,134 |
| Measure | Some High School | High school graduate | Some college | Associate's degree | Bachelor's degree or higher | Bachelor's degree | Master's degree | Professional degree | Doctorate degree |
|---|---|---|---|---|---|---|---|---|---|
| Persons, age 25+ w/ earnings | $20,321 | $26,505 | $31,054 | $35,009 | $49,303 | $43,143 | $52,390 | $82,473 | $70,853 |
| Male, age 25+ w/ earnings | $24,192 | $32,085 | $39,150 | $42,382 | $60,493 | $52,265 | $67,123 | $100,000 | $78,324 |
| Female, age 25+ w/ earnings | $15,073 | $21,117 | $25,185 | $29,510 | $40,483 | $36,532 | $45,730 | $66,055 | $54,666 |
| Persons, age 25+, employed full-time | $25,039 | $31,539 | $37,135 | $40,588 | $56,078 | $50,944 | $61,273 | $100,000 | $79,401 |
| Household | $22,718 | $36,835 | $45,854 | $51,970 | $73,446 | $68,728 | $78,541 | $100,000 | $96,830 |
| Bottom 10% | Bottom 20% | Bottom 25% | Middle 33% | Middle 20% | Top 25% | Top 20% | Top 5% | Top 1.5% | Top 1% |
|---|---|---|---|---|---|---|---|---|---|
| $0 to $10,500 | $0 to $18,500 | $0 to $22,500 | $30,000 to $62,500 | $35,000 to $55,000 | $77,500 and up | $92,000 and up | $167,000 and up | $250,000 and up | $350,000 and up |
| Source: US Census Bureau, 2006; income statistics for the year 2005 | |||||||||
Professions
The vast majority of Americans derive the majority of their income from occupational earnings.[20] Income derived from an occupation is largely determined by scarcity, the economic law of supply and demand , and politics (e.g., AMA lobbying efforts). The greater the demand for a certain specialty and the less supply, the higher the income.
A correlation has been shown between increases in income and increases in worker satisfaction. Increasing worker satisfaction, however, is not solely a result of the increase in income: workers in more complex and higher level occupations tend to have attained higher levels of education and thus are more likely to have a greater degree of autonomy in the workplace.[20] Additionally, higher level workers with advanced degrees are hired to share their personal knowledge, to conceptualize, and to consult. Higher-level workers typically suffer less job alienation and reap not only external benefits in terms of income from their jobs, but also enjoy high levels of intrinsic motivation and satisfaction.[10][20]
In the United States the highest earning occupational group is referred to as white collar professionals. Individuals in this occupational classification tend to report the highest job satisfaction and highest incomes. Defining income based on title of a profession can be misleading, given that a professional title may indicate the type of education received, but does not always correlate with the actual day to day income-generating endeavors that are pursued.
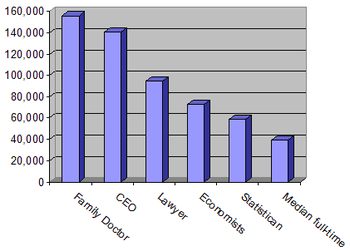
Some sources cite the profession of physician in the United States as the highest paying,[10] Physician (M.D. and D.O.) and Dentist (D.M.D and D.D.S) compensation ranks as the highest median annual earnings of all professions. Median annual earnings ranged from $149,310 for general dentists and $156,010 for family physicians to $321,686 for anesthesiologists. Surgeons post a median annual income of $282,504.[21] However, the annual salary for Chief Executive Officer (C.E.O.) is projected quite differently based on source: Salary.com reports a median salary of $634,941,[22] while the U.S. Department of Labor in May 2004 reported the median as $140,350.[23] This is primarily due to a methodological difference in terms of which companies were surveyed. Overall annual earnings among the nation's top 25 professions ranged from the $70,000s to the $300,000s.
In addition to physicians, lawyers, physicists, and nuclear engineers were all among the nation's 20 highest paid occupations with incomes in excess of $78,410.[24] Some of the other occupations in the high five-figure range were economists with a median of $72,780,[25] mathematicians with $81,240,[26] financial managers with $81,880,[27] and software publishers with median annual earnings of $73,060.[28] The median annual earnings of wage-and-salary pharmacists in May 2006 were $94,520. The median annual earnings of wage-and-salary engineers in November 2011 were $90,000. The middle 50 percent earned between $83,180 and $108,140 a year (as in the Occupational Outlook Handbook, 2008–09 Edition by the U.S. Bureau of Labor Statistics).
Education
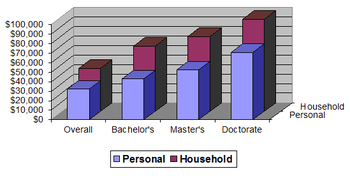
Educational attainment plays a major factor in determining an individual's economic disposition. Personal income varied greatly according to an individual's education, as did household income.
Incomes for those employed, full-time, year-round and over the age of twenty-five ranged from $20,826 ($17,422 if including those who worked part-time[7]) for those with less than a ninth grade education to $100,000 for those with professional degrees ($82,473 if including those who work part-time[7]). The median income for individuals with doctorates was $79,401 ($70,853 if including those who work part-time[7]).[29]
These statistics reveal that the majority of those employed full-time with professional or doctoral degrees are among the overall top 10% (15% if including those who work part-time) of income earners. Of those with a master's degree, nearly 50% were among the top quarter of income earners (top third if including those who work part-time).[7]
Race
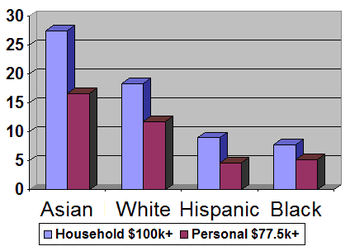

Racial breakdown of households making over $100,000 per year (2006).
Recent U.S. Census Bureau publications indicate a strong correlation between race and affluence. In the top household income quintile (households with incomes exceeding $91,200), Asian Americans and Whites were over represented, whereas Hispanics and African Americans were underrepresented.
The household income for Asian Americans was, at $61,094, by far the highest,[30] exceeding that of Whites ($48,554) by 26%.[31] Over a quarter, 27.5%, of Asian American households had incomes exceeding $100,000, and another 40% had incomes of over $75,000.[32]
Among White households, who remained near the national median, 18.3% had six figure incomes, while 28.9% had incomes exceeding $75,000.[31] The percentages of households with incomes exceeding $100,000 and $75,000 were far below the national medians for Hispanic and African American households.[33] Among Hispanic households, for example, only 9% had six figure incomes, and 17% had incomes exceeding $75,000.[34] The race gap remained when considering personal income. In 2005, roughly 11% of Asian Americans[35] and 7% of White individuals[36] had six figure incomes, compared to 2.6% among Hispanics[37] and 2.3% among African Americans.[38]
The racial breakdowns of income brackets further illustrate the racial disparities associated with affluence. in 2005, 81.8% of all 114 million households were White (including White Hispanics),[31] 12.2% were African American,[33] 10.9% were Hispanic[34] and 3.7% were Asian American.[30][39]
While White households are always near the national median due to Whites being by far the most prevalent racial demographic, the percentages of minority households with incomes exceeding $100,000 strayed considerably from their percentage of the overall population: Asian Americans, who represent the smallest surveyed racial demographic in the overall population, were the found to be the prevalent minority among six figure income households.
Among the nearly twenty million households with six figure incomes, 86.9% were White,[31] 5.9% were Asian American,[30] 5.6% were Hispanic[34] and 5.5% were African American.[33] Among the general individual population with earnings, 82.1% were White,[36] 12.7% were Hispanic,[37] 11.0% were African American[38] and 4.6% were Asian American.[35]
Of the top 10% of income earners, those nearly 15 million individuals with incomes exceeding $77,500, Whites and Asians were once again over-represented with the percentages of African Americans and Hispanics trailing behind considerably. Of the top 10% of earners, 86.7% were White.[36] Asian Americans were the prevalent minority, constituting 6.8% of top 10% income earners, nearly twice the percentage of Asian Americans among the general population.[35]
Hispanics, who were the prevalent minority in the general population of income earners, constituted only 5.2% of those in the top 10%,[37] with African Americans being the least represented with 5.1%.[38]
| Race | Overall median | High school | Some college | College graduate | Bachelor's degree | Master's degree | Doctorate degree | |
|---|---|---|---|---|---|---|---|---|
| Total population | All, age 25+ | 32,140 | 26,505 | 31,054 | 49,303 | 43,143 | 52,390 | 70,853 |
| Full-time workers, age 25–64 | 39,509 | 31,610 | 37,150 | 56,027 | 50,959 | 61,324 | 79,292 | |
| White alone | All, age 25+ | 33,030 | 27,311 | 31,564 | 49,972 | 43,833 | 52,318 | 71,268 |
| Full-time workers, age 25–64 | 40,422 | 32,427 | 38,481 | 56,903 | 51,543 | 61,441 | 77,906 | |
| Asian alone | All, age 25+ | 36,152 | 25,285 | 29,982 | 51,481 | 42,466 | 61,452 | 69,653 |
| Full-time workers, age 25–64 | 42,109 | 27,041 | 33,120 | 60,532 | 51,040 | 71,316 | 91,430 | |
| African American | All, age 25+ | 27,101 | 22,379 | 27,648 | 44,534 | 41,572 | 48,266 | 61,894 |
| Full-time workers, age 25–64 | 32,021 | 26,230 | 32,392 | 47,758 | 45,505 | 52,858 | N/A | |
| Hispanic or Latino | All, age 25+ | 23,613 | 22,941 | 28,698 | 41,596 | 37,819 | 50,901 | 67,274 |
| Full-time workers, age 25–64 | 27,266 | 26,461 | 33,120 | 46,594 | 41,831 | 53,880 | N/A | |
Source: U.S. Census Bureau, 2006[40]
Status and stratification
Economic well-being is often associated with high societal status, yet income and economic compensation are a function of scarcity and act as only one of a number of indicators of social class. It is in the interest of all of society that open positions are adequately filled with a competent occupant enticed to do his or her best.[10] As a result, an occupation that requires a scarce skill, the attainment of which is often documented through an educational degree, and entrusts its occupant with a high degree of influence will generally offer high economic compensation.
To put it another way, the high income is intended to ensure that the desired individuals obtain the necessary skills (e.g. medical or graduate school) and complete their tasks with the necessary vigor[41] but differences in income may, however, be found among occupations of similar sociological nature: the median annual earnings of a physician were in excess of $150,000 in May 2004, compared to $95,000 for an attorney.[21][24] Both occupations require finely tuned and scarce skill sets and both are essential to the well-being of society, yet physicians out-earned attorneys and other upper middle class professionals by a wide margin as their skill-sets are deemed especially scarce.
Overall, high status positions tend to be those requiring a scarce skill and are therefore commonly far better compensated than those in the middle of the occupational strata.[10][41]
...It is essential that the duties of the positions be performed with the diligence that their importance requires. Inevitably, then, a society must have, first, some kind of rewards that it can use as inducements, and, second, some way of distributing these rewards differently according to positions. The rewards and their distribution become part of the social order... If the rights and perquisites of different positions in a society must be unequal, then society must be stratified... Hence every society... must differentiate persons... and must therefore possess a certain amount of institutionalized inequality.— Kingsley Davis & Wilbert E. Moore, "Some Principles of Stratification", republished in Social Class and Stratification[41]
It is important to note that the above is an ideal type, a simplified model or reality using optimal circumstances. In reality other factors such as discrimination based on race, ethnicity and gender as well as aggressive political lobbying by certain professional organizations also influence personal income. An individual's personal career decisions, as well as his or her personal connections within the nation's economic institutions, are also likely to have an effect on income, status and whether or not an individual may be referred to as affluent.[9]
In contemporary America it is a combination of all these factors, with scarcity remaining by far the most prominent one, which determine a person's economic compensation. Due to higher status professions requiring advanced and thus less commonly found skill sets (including the ability to supervise and work with a considerable autonomy), these professions are better compensated through the means of income, making high status individuals affluent, depending on reference group.[10]
While the two paragraphs above only describe the relationship between status and personal income, household income is also often used to infer status. As a result, the dual income phenomenon presents yet another problem in equating affluence with high societal status. As mentioned earlier in the article, 42% of households have two or more income earners, and 76% of households with six figure incomes have two or more income earners.[11] Furthermore, people are most likely to marry their professional and societal equals.
It therefore becomes apparent that the majority of households with incomes exceeding the six figure mark are the result of an economic as well as personal union between two economic equals. Today, two nurses, each making $55,000 a year, can easily out-earn a single attorney who makes the median of $95,000 annually.[24][42] Despite household income rising drastically through the union of two economic equals, neither individual has advanced his or her function and position within society. Yet the household (not the individual) may have become more affluent, assuming an increase in household members does not offset the dual-income derived gains.
| Dennis Gilbert, 2002 | William Thompson & Joseph Hickey, 2005 | Leonard Beeghley, 2004 | |||
|---|---|---|---|---|---|
| Class | Typical characteristics | Class | Typical characteristics | Class | Typical characteristics |
| Capitalist class (1%) | Top-level executives, high-rung politicians, heirs. Ivy League education common. | Upper class (1%) | Top-level executives, celebrities, heirs; income of $500,000+ common. Ivy league education common. | The super-rich (0.9%) | Multi-millionaires whose incomes commonly exceed $350,000; includes celebrities and powerful executives/politicians. Ivy League education common. |
| Upper middle class[1] (15%) | Highly-educated (often with graduate degrees), most commonly salaried, professionals and middle management with large work autonomy. | Upper middle class[1] (15%) | Highly-educated (often with graduate degrees) professionals & managers with household incomes varying from the high 5-figure range to commonly above $100,000. | The rich (5%) | Households with net worth of $1 million or more; largely in the form of home equity. Generally have college degrees. |
| Middle class (plurality/ majority?; ca. 46%) |
College-educated workers with considerably higher-than-average incomes and compensation; a man making $57,000 and a woman making $40,000 may be typical. | ||||
| Lower middle class (30%) | Semi-professionals and craftsmen with a roughly average standard of living. Most have some college education and are white-collar. | Lower middle class (32%) | Semi-professionals and craftsmen with some work autonomy; household incomes commonly range from $35,000 to $75,000. Typically, some college education. | ||
| Working class (30%) | Clerical and most blue-collar workers whose work is highly routinized. Standard of living varies depending on number of income earners, but is commonly just adequate. High school education. | ||||
| Working class (32%) | Clerical, pink- and blue-collar workers with often low job security; common household incomes range from $16,000 to $30,000. High school education. | Working class (ca. 40–45%) |
Blue-collar workers and those whose jobs are highly routinized with low economic security; a man making $40,000 and a woman making $26,000 may be typical. High school education. | ||
| Working poor (13%) | Service, low-rung clerical and some blue-collar workers. High economic insecurity and risk of poverty. Some high school education. | ||||
| Lower class (ca. 14–20%) | Those who occupy poorly-paid positions or rely on government transfers. Some high school education. | ||||
| Underclass (12%) | Those with limited or no participation in the labor force. Reliant on government transfers. Some high school education. | The poor (ca. 12%) | Those living below the poverty line with limited to no participation in the labor force; a household income of $18,000 may be typical. Some high school education. | ||
Thompson, W. & Hickey, J. (2005). Society in Focus. Boston, MA: Pearson, Allyn & Bacon; Beeghley, L. (2004). The Structure of Social Stratification in the United States. Boston, MA: Pearson, Allyn & Bacon.
| |||||
Extreme affluence

As of 2002, there were approximately 146,000 (0.1%) households with incomes exceeding $1,500,000, while the top 0.01% or 11,000 households had incomes exceeding $5,500,000. The 400 highest tax payers in the nation had gross annual household incomes exceeding $87,000,000. Household incomes for this group have risen more dramatically than for any other. As a result, the gap between those who make less than one and half million dollars annually (99.9% of households) and those who make more (0.1%) has been steadily increasing, prompting The New York Times to proclaim that the "Richest Are Leaving Even the Rich Far Behind."[43]
The income disparities within the top 1.5% are quite drastic.[44] While households in the top 1.5% of households had incomes exceeding $250,000, 443% above the national median, their incomes were still 2200% lower than those of the top 0.1% of households. One can therefore conclude that almost any household, even those with incomes of $250,000 annually, are poor when compared to the top 0.01%, who in turn are poor compared to the top 0.000267%, the top 400 taxpaying households.
See also
| Wikimedia Commons has media related to Income distribution in the United States. |
General:
- Economy of the United States
- International Ranking of Household Income
- List of Average Wages per Country
References
- ↑ Procter, Paul, ed. (1995). Cambridge International Dictionary of English. Cambridge: Cambridge University Press. ISBN 0-521-48236-4.
- ↑ "US Census Bureau, personal income distribution, 2005". Archived from the original on 14 December 2006. Retrieved 2006-12-11.
- ↑ "US Census 2005 Economic Survey, income data". Archived from the original on 30 June 2006. Retrieved 2006-06-29.
- ↑ Bruenig, Matt (March 24, 2014). "You call this a meritocracy? Why rich inheritance is poisoning the American economy". Salon. Retrieved August 24, 2014.
- ↑ Staff (March 18, 2014). "Inequality - Inherited wealth". The Economist. Retrieved August 24, 2014.
- ↑ Pizzigati, Sam (September 24, 2012). "The 'Self-Made' Hallucination of America's Rich". Institute for Policy Studies. Retrieved August 24, 2014.
- 1 2 3 4 5 6 7 8 9 10 "US Census Bureau, personal income distribution, age 25+, 2006". Retrieved 2006-12-28.
- 1 2 "US Census Bureau, income distribution of individuals, employed full-time, year round, age 25–64, 2006". Archived from the original on 2006-09-29. Retrieved 2006-12-27.
- 1 2 Ehrenreich, Barbara (1989). Fear of Falling, The Inner Life of the Middle Class. New York, NY: Harper Collins. ISBN 0-06-097333-1.
- 1 2 3 4 5 6 Thompson, William; Joseph Hickey (2005). Society in Focus. Boston, MA: Pearson. ISBN 0-205-41365-X.
- 1 2 3 4 "US Census Bureau, income quintile and top 5% household income distribution and demographic characteristics, 2006". Archived from the original on 4 January 2007. Retrieved 2006-12-28.
- ↑ "Employment Characteristics of Families Summary".
- 1 2 3 4 "US Census Bureau, overall household income distribution, 2006". Archived from the original on 4 January 2007. Retrieved 2006-12-28.
- 1 2 "New York Times quote, households with incomes of over 1.6 million". Archived from the original on 31 December 2006. Retrieved 2006-12-28.
- 1 2 3 4 "Middle income can't buy Middle class lifestyle". Archived from the original on 29 December 2006. Retrieved 2006-12-28.
- ↑ Robert E. Rector and Kirk A. Johnson, Ph.D. (January 5, 2004). "Understanding Poverty in America"
- ↑ Robert Rector (August 27, 2007). "How Poor Are America's Poor? Examining the "Plague" of Poverty in America"
- 1 2 3 "Income and poverty since 1967, US Census Bureau" (PDF). Retrieved 2006-09-26.
- 1 2 "US Census Bureau, income quintilea and Top 5 Percent, 2004". Archived from the original on 4 January 2007. Retrieved 2006-12-27.
- 1 2 3 Eichar, Douglas (1989). Occupation and Class Consciousness in America. Westport, Connecticut: Greenwood Press. ISBN 0-313-26111-3.
- 1 2 "US Department of Labor, annual earnings for doctors". Archived from the original on 28 December 2006. Retrieved 2006-12-27.
- ↑ "Salary.com". Archived from the original on 6 February 2009. Retrieved 2009-02-22.
- ↑ "US Department of Labor, CEO salaries". Archived from the original on 22 December 2006. Retrieved 2006-12-27.
- 1 2 3 "Bureau of Labor statistics data published by Monster.com, 20 highest paying jobs". Archived from the original on 27 December 2006. Retrieved 2006-12-27.
- ↑ "US Department of Labor, median income of Economists". Archived from the original on 28 December 2006. Retrieved 2006-12-27.
- ↑ "US Department of Labor, median income of Mathematicians". Archived from the original on 28 December 2006. Retrieved 2006-12-27.
- ↑ "US Department of Labor, median income of financial managers". Archived from the original on 16 December 2006. Retrieved 2006-12-27.
- ↑ "US Department of Labor, median income of Software Publishers". Archived from the original on 25 December 2006. Retrieved 2006-12-27.
- ↑ "US Census Bureau, personal income for full-time, year round employed employed workers, age 25+". Retrieved 2006-12-28.
- 1 2 3 "US Census Bureau, household income distribution for Asians, 2006". Retrieved 2006-12-29.
- 1 2 3 4 "US Census Bureau, household income distribution for Whites". Retrieved 2006-12-29.
- ↑ "US Census Bureau, household income distribution for Whites, 2006". Retrieved 2006-12-29.
- 1 2 3 "US Census Bureau, household income distribution for African Americans". Retrieved 2006-12-29.
- 1 2 3 "US Census Bureau, household income distribution for Hispanics, 2006". Retrieved 2006-12-29.
- 1 2 3 "US Census Bureau, personal income distribution for Asian Americans, 2006". Retrieved 2006-12-29.
- 1 2 3 "US Census Bureau, personal income distribution for Whites, 2006". Retrieved 2006-12-29.
- 1 2 3 "US Census Bureau, personal income distribution for Hispanics, 2006". Retrieved 2006-12-29.
- 1 2 3 "US Census Bureau, personal income distribution for African Americans, 2006". Retrieved 2006-12-29.
- ↑ "US Census Bureau, overall households income distribution to $100,000, 2006". Archived from the original on 30 December 2006. Retrieved 2006-12-29.
- ↑ "US Census Bureau, Personal income, age 25+, 2006 statistics forum". Archived from the original on 4 January 2007. Retrieved 2006-12-17.
- 1 2 3 Levine, Rhonda (1998). Social Class and Stratification. Lanham, MD: Rowman & Littlefield. ISBN 0-8476-8543-8.
- ↑ "US Department of Labor, median income of registered nurses". Archived from the original on 2 January 2007. Retrieved 2007-01-02.
- ↑ "The New York Times, Richest Are Leaving Even the Rich Far Behind". 2005-06-05. Retrieved 2007-01-02.
- ↑ Krugman, Paul (September 28, 2014). "Our Invisible Rich". New York Times. Retrieved October 1, 2014.
Further reading
- Frank, Robert L. (2007). Richistan: A Journey Through the American Wealth Boom and the Lives of the New Rich. Crown Publishing Group. p. 277. ISBN 0-307-33926-2.
- Levy, Frank (2008). "Distribution of Income". In David R. Henderson (ed.). Concise Encyclopedia of Economics (2nd ed.). Indianapolis: Library of Economics and Liberty. ISBN 978-0865976658. OCLC 237794267.
External links
- Alternate income measures forum.
- Americans Underestimate U.S. Wealth Inequality (audio - NPR).
- 15 Mind-Blowing Facts About Wealth And Inequality In America (charts - The Business Insider).
- It's the Inequality, Stupid: 11 Charts that Explain Everything that's Wrong with America (Mother Jones - March 2011).
- US Census Bureau, personal income forum.
- US Census Bureau, household income forum.
- "Wealth Gap" - A Guide (AP News - January, 2014).
| |||||||||||||||||||||||||||||||||||||||||||||||
| |||||||||||||||||||||||||||||||||||||||||||||||
| |||||||||||||||||||||||||||||||||||||||||||||||
| |||||||||||||||||||||||||||||||||||||||||||||||