Immigration to the United States
.jpg)
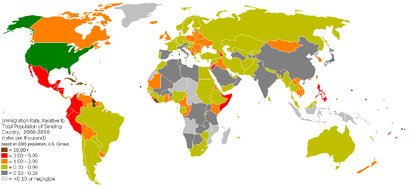
Immigration to the United States is a complex demographic phenomenon that has been a major source of population growth and cultural change throughout much of the history of the United States. The economic, social, and political aspects of immigration have caused controversy regarding ethnicity, economic benefits, jobs for non-immigrants, settlement patterns, impact on upward social mobility, crime, and voting behavior. In 2005, the United States per capita ranked 34th out of 179 world nations in the number of immigrants allowed into the country.[1]
Prior to 1965, policies such as the national origins formula limited immigration and naturalization opportunities for people from areas outside Western Europe. Exclusion laws enacted as early as the 1880s generally prohibited or severely restricted immigration from Asia, and quota laws enacted in the 1920s curtailed Eastern European immigration.
The civil rights movement of the 1960s led to the replacement[2] of these ethnic quotas with per-country limits.[3] Since then, the number of first-generation immigrants living in the United States has quadrupled,[4] from 9.6 million in 1970 to about 38 million in 2007.[5] Nearly 14 million immigrants entered the United States from 2000 to 2010,[6] and over one million persons were naturalized as U.S. citizens in 2008. The per-country limit[3] applies the same maximum on the number of visas to all countries regardless of their population and has therefore had the effect of significantly restricting immigration of persons born in populous nations such as Mexico, China, India, and the Philippines – the leading countries of origin for legally admitted immigrants to the United States in 2013;[7] nevertheless, China, India, and Mexico were the leading countries of origin for immigrants overall to the United States in 2013, regardless of legal status, according to a U.S. Census Bureau study.[8] As of 2009, 66% of legal immigrants were admitted on the basis of family ties, along with 13% admitted for their employment skills and 17% for humanitarian reasons.[9]
For those who enter the US illegally across the Mexico–United States border and elsewhere, migration is difficult, expensive and dangerous.[10] Virtually all undocumented immigrants have no avenues for legal entry to the United States due to the restrictive legal limits on green cards, and lack of immigrant visas for low-skilled workers.[11] Participants in debates on immigration in the early twenty-first century called for increasing enforcement of existing laws governing illegal immigration to the United States, building a barrier along some or all of the 2,000-mile (3,200 km) Mexico-U.S. border, or creating a new guest worker program. Through much of 2006 the country and Congress was immersed in a debate about these proposals. As of April 2010 few of these proposals had become law, though a partial border fence had been approved and subsequently canceled.[12]
History

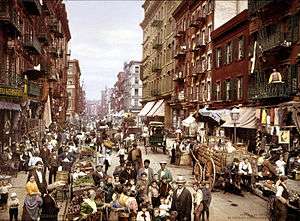
American immigration history can be viewed in four epochs: the colonial period, the mid-19th century, the start of the 20th century, and post-1965. Each period brought distinct national groups, races and ethnicities to the United States. During the 17th century, approximately 400,000 English people migrated to Colonial America.[13] Over half of all European immigrants to Colonial America during the 17th and 18th centuries arrived as indentured servants.[14] The mid-19th century saw mainly an influx from northern Europe; the early 20th-century mainly from Southern and Eastern Europe; post-1965 mostly from Latin America and Asia.
Historians estimate that fewer than 1 million immigrants came to the United States from Europe between 1600 and 1799.[15] The 1790 Act limited naturalization to "free white persons"; it was expanded to include blacks in the 1860s and Asians in the 1950s.[16] In the early years of the United States, immigration was fewer than 8,000 people a year,[17] including French refugees from the slave revolt in Haiti. After 1820, immigration gradually increased. From 1836 to 1914, over 30 million Europeans migrated to the United States.[18] The death rate on these transatlantic voyages was high, during which one in seven travelers died.[19] In 1875, the nation passed its first immigration law, the Page Act of 1875.[20]
After an initial wave of immigration from China following the California Gold Rush, Congress passed a series of laws culminating in the Chinese Exclusion Act of 1882, banning virtually all immigration from China until the law's repeal in 1943. In the late 1800s, immigration from other Asian countries, especially to the West Coast, became more common.
The peak year of European immigration was in 1907, when 1,285,349 persons entered the country.[21] By 1910, 13.5 million immigrants were living in the United States.[22] In 1921, the Congress passed the Emergency Quota Act, followed by the Immigration Act of 1924. The 1924 Act was aimed at further restricting immigrants from Southern and Eastern Europe, particularly Jews, Italians, and Slavs, who had begun to enter the country in large numbers beginning in the 1890s, and consolidated the prohibition of Asian immigration.[23]

Immigration patterns of the 1930s were dominated by the Great Depression. In the final prosperous year, 1929, there were 279,678 immigrants recorded,[24] but in 1933, only 23,068 came to the U.S.[15] In the early 1930s, more people emigrated from the United States than to it.[25] The U.S. government sponsored a Mexican Repatriation program which was intended to encourage people to voluntarily move to Mexico, but thousands were deported against their will.[26] Altogether about 400,000 Mexicans were repatriated.[27] Most of the Jewish refugees fleeing the Nazis and World War II were barred from coming to the United States.[28] In the post-war era, the Justice Department launched Operation Wetback, under which 1,075,168 Mexicans were deported in 1954.[29]
First, our cities will not be flooded with a million immigrants annually. Under the proposed bill, the present level of immigration remains substantially the same.... Secondly, the ethnic mix of this country will not be upset.... Contrary to the charges in some quarters, [the bill] will not inundate America with immigrants from any one country or area, or the most populated and deprived nations of Africa and Asia.... In the final analysis, the ethnic pattern of immigration under the proposed measure is not expected to change as sharply as the critics seem to think.
The Immigration and Nationality Act of 1965, also known as the Hart-Cellar Act, abolished the system of national-origin quotas. By equalizing immigration policies, the act resulted in new immigration from non-European nations, which changed the ethnic make-up of the United States.[31] In 1970, 60% of immigrants were from Europe; this decreased to 15% by 2000.[32] In 1990, George H. W. Bush signed the Immigration Act of 1990,[33] which increased legal immigration to the United States by 40%.[34] In 1991, Bush signed the Armed Forces Immigration Adjustment Act 1991, allowing foreign service members who had serve 12 or more years in the US Armed Forces to qualify for permanent residency and, in some cases, citizenship.
In November 1994, California voters passed Proposition 187 amending the state constitution, denying state financial aid to illegal immigrants. The federal courts voided this change, ruling that it violated the federal constitution.[35]
Appointed by Bill Clinton,[36] the U.S. Commission on Immigration Reform recommended reducing legal immigration from about 800,000 people per year to approximately 550,000.[37] While an influx of new residents from different cultures presents some challenges, "the United States has always been energized by its immigrant populations," said President Bill Clinton in 1998. "America has constantly drawn strength and spirit from wave after wave of immigrants [...] They have proved to be the most restless, the most adventurous, the most innovative, the most industrious of people."[38]

In 2001, President George W. Bush discussed an accord with Mexican President Vincente Fox. Possible accord was derailed by the September 11 attacks. From 2005 to 2013, the US Congress discussed various ways of controlling immigration. The Senate and House are unable to reach an agreement. In 2012 and 2014, President Obama initiated policies that were intended to ease the pressure on deporting people using anchor babies as a means of immigrating to the United States.[35]
Nearly 8 million people immigrated to the United States from 2000 to 2005; 3.7 million of them entered without papers.[39][40] Since 1986 Congress has passed seven amnesties for undocumented immigrants.[41] In 1986 president Ronald Reagan signed immigration reform that gave amnesty to 3 million undocumented immigrants in the country.[42] Hispanic immigrants suffered job losses during the late-2000s recession,[43] but since the recession's end in June 2009, immigrants posted a net gain of 656,000 jobs.[44] Over 1 million immigrants were granted legal residence in 2011.[45]
- Persons Obtaining Legal Permanent Resident Status Fiscal Years[46]
| Year | Year | Year | Year | Year | Year | ||||||
|---|---|---|---|---|---|---|---|---|---|---|---|
| 1950 | 249,187 | 1970 | 373,326 | 1990 | 1,535,872 | 2006 | 1,266,129 | 2010 | 1,042,625 | 2014 | 1,016,518 |
| 1955 | 237,790 | 1975 | 385,378 | 1995 | 720,177 | 2007 | 1,052,415 | 2011 | 1,062,040 | ||
| 1960 | 265,398 | 1980 | 524,295 | 2000 | 841,002 | 2008 | 1,107,126 | 2012 | 1,031,631 | ||
| 1965 | 296,697 | 1985 | 568,149 | 2005 | 1,122,257 | 2009 | 1,130,818 | 2013 | 990,553 |
| Decade | Average per year |
|---|---|
| |
|
| |
|
| |
|
| |
|
| |
|
| |
|
Source: US Department of Homeland Security, Persons Obtaining Legal Permanent Resident Status: Fiscal Years 1950 to 2013[47][48]
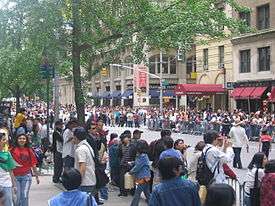
Contemporary immigration

Until the 1930s most legal immigrants were male. By the 1990s women accounted for just over half of all legal immigrants.[49] Contemporary immigrants tend to be younger than the native population of the United States, with people between the ages of 15 and 34 substantially overrepresented.[50] Immigrants are also more likely to be married and less likely to be divorced than native-born Americans of the same age.[51]

Immigrants are likely to move to and live in areas populated by people with similar backgrounds. This phenomenon has held true throughout the history of immigration to the United States.[52] Seven out of ten immigrants surveyed by Public Agenda in 2009 said they intended to make the U.S. their permanent home, and 71% said if they could do it over again they would still come to the US. In the same study, 76% of immigrants say the government has become stricter on enforcing immigration laws since the September 11, 2001 attacks ("9/11"), and 24% report that they personally have experienced some or a great deal of discrimination.[53]
Public attitudes about immigration in the U.S. were heavily influenced in the aftermath of the 9/11 attacks. After the attacks, 52% of Americans believed that immigration was a good thing overall for the U.S., down from 62% the year before, according to a 2009 Gallup poll.[54] A 2008 Public Agenda survey found that half of Americans said tighter controls on immigration would do "a great deal" to enhance U.S. national security.[55] Harvard political scientist and historian Samuel P. Huntington argued in Who Are We? The Challenges to America's National Identity that a potential future consequence of continuing massive immigration from Latin America, especially Mexico, might lead to the bifurcation of the United States.
The population of illegal Mexican immigrants in the US fell from approximately 7 million in 2007 to 6.1 million in 2011[56] Commentators link the reversal of the immigration trend to the economic downturn that started in 2008 and which meant fewer available jobs, and to the introduction of tough immigration laws in many states.[57][58][59][60] According to the Pew Hispanic Center the total number of Mexican born persons had stagnated in 2010, and tended toward going into negative figures.[61]
More than 80 cities in the United States,[62] including Washington D.C., New York City, Los Angeles, Chicago, San Francisco, San Diego, San Jose, Salt Lake City, Phoenix, Dallas, Fort Worth, Houston, Detroit, Jersey City, Minneapolis, Miami, Denver, Baltimore, Seattle, Portland, Oregon and Portland, Maine, have sanctuary policies, which vary locally.[63]
Ethnicity

Inflow of New Legal Permanent Residents by continent in 2014:
- Inflow of New Legal Permanent Residents by region, in 2013 and 2014
| Region | 2013 | 2014 |
|---|---|---|
| Asia | 400,548 | 430,508 |
| Americas | 396,605 | 398,069 |
| Africa | 98,304 | 98,413 |
| Europe | 86,556 | 83,266 |
| Australia and Oceania | 5,277 | 5,122 |
| Unknown | 3,263 | 1,150 |
| Total | 990,553 | 1,016,518 |
Source: US Department of Homeland Security, Office of Immigration Statistics[48][64]
- Top 10 sending countries in 2013 and 2014
| Country | 2013 | 2014 |
|---|---|---|
| Mexico | 135,028 | 134,052 |
| India | 68,458 | 77,908 |
| China | 71,798 | 76,089 |
| Philippines | 54,446 | 49,996 |
| Cuba | 32,219 | 46,679 |
| Dominican Republic | 41,311 | 44,577 |
| Vietnam | 27,101 | 30,283 |
| South Korea | 23,166 | 20,423 |
| El Salvador | 18,260 | 19,273 |
| Iraq | 9,552 | 19,153 |
| Total | 990,553 | 1,016,518 |
Demography
Extent and destinations
| Year[65] | Number of foreign-born | Percent foreign-born |
|---|---|---|
| 1850 | 2,244,602 | 9.7 |
| 1860 | 4,138,697 | 13.2 |
| 1870 | 5,567,229 | 14.4 |
| 1880 | 6,679,943 | 13.3 |
| 1890 | 9,249,547 | 14.8 |
| 1900 | 10,341,276 | 13.6 |
| 1910 | 13,515,886 | 14.7 |
| 1920 | 13,920,692 | 13.2 |
| 1930 | 14,204,149 | 11.6 |
| 1940 | 11,594,896 | 8.8 |
| 1950 | 10,347,395 | 6.9 |
| 1960 | 9,738,091 | 5.4 |
| 1970 | 9,619,302 | 4.7 |
| 1980 | 14,079,906 | 6.2 |
| 1990 | 19,767,316 | 7.9 |
| 2000 | 31,107,889 | 11.1 |
| 2010[66] | 39,956,000 | 12.9 |
The United States admitted more legal immigrants from 1991 to 2000, between ten and eleven million, than in any previous decade. In the most recent decade, the ten million legal immigrants that settled in the U.S. represent an annual growth of only about 0.3% as the U.S. population grew from 249 million to 281 million. By comparison, the highest previous decade was the 1900s, when 8.8 million people arrived, increasing the total U.S. population by one percent every year. Specifically, "nearly 15% of Americans were foreign-born in 1910, while in 1999, only about 10% were foreign-born."[67]
By 1970, immigrants accounted for 4.7 percent of the US population and rising to 6.2 percent in 1980, with an estimated 12.5 percent in 2009.[68] As of 2010, 25% of US residents under age 18 were first- or second-generation immigrants.[69] Eight percent of all babies born in the U.S. in 2008 belonged to illegal immigrant parents, according to a recent analysis of U.S. Census Bureau data by the Pew Hispanic Center.[70]
Legal immigration to the U.S. increased from 250,000 in the 1930s, to 2.5 million in the 1950s, to 4.5 million in the 1970s, and to 7.3 million in the 1980s, before resting at about 10 million in the 1990s.[71] Since 2000, legal immigrants to the United States number approximately 1,000,000 per year, of whom about 600,000 are Change of Status who already are in the U.S. Legal immigrants to the United States now are at their highest level ever, at just over 37,000,000 legal immigrants. Illegal immigration may be as high as 1,500,000 per year with a net of at least 700,000 illegal immigrants arriving every year.[72][73] Immigration led to a 57.4% increase in foreign born population from 1990 to 2000.[74]
While immigration has increased drastically over the last century, the foreign born share of the population was still higher in 1900 (about 20%) than it is today (about 10%). A number of factors may be attributed to the decrease in the representation of foreign born residents in the United States. Most significant has been the change in the composition of immigrants; prior to 1890, 82% of immigrants came from North and Western Europe. From 1891 to 1920, that number dropped to 25%, with a rise in immigrants from East, Central, and South Europe, summing up to 64%. Animosity towards these different and foreign immigrants rose in the United States, resulting in much legislation to limit immigration.
Contemporary immigrants settle predominantly in seven states, California, New York, Florida, Texas, Pennsylvania, New Jersey and Illinois, comprising about 44% of the U.S. population as a whole. The combined total immigrant population of these seven states was 70% of the total foreign-born population in 2000. If current birth rate and immigration rates were to remain unchanged for another 70 to 80 years, the U.S. population would double to nearly 600 million.[75]
In 1900, when the U.S. population was 76 million, there were an estimated 500,000 Hispanics.[76] The Census Bureau projects that by 2050, one-quarter of the population will be of Hispanic descent.[77] This demographic shift is largely fueled by immigration from Latin America.[78][79]
Origin

500,000 + |
200,000-499,999 |
100,000-199,999 |
50,000-99,999 |

- Foreign born population of the United States by country of birth in 2013 (U.S. Census Bureau)[80] and number of immigrants between 1986 and 2012 by country of birth[81]
A country is included in the table if it exceeded 50,000 in either category.
| Country of birth | Population (2013) | Immigrants (1986-2012) |
|---|---|---|
| |
316,497,531 | 3,132 |
| Total foreign born | 41,347,945 | 26,147,963 |
| |
11,584,977 | 5,551,757 |
| |
2,383,831 | 1,399,667 |
| |
2,034,677 | 1,323,011 |
| |
1,843,989 | 1,480,946 |
| |
1,281,010 | 955,967 |
| |
1,252,067 | 676,776 |
| |
1,144,024 | 666,657 |
| |
1,070,335 | 609,321 |
| |
991,046 | 904,721 |
| |
902,293 | 353,122 |
| |
840,192 | 394,790 |
| |
714,743 | 507,741 |
| |
695,489 | 383,037 |
| |
677,231 | 498,551 |
| |
593,980 | 536,657 |
| |
584,184 | 192,676 |
| |
533,598 | 178,321 |
| |
440,292 | 320,611 |
| |
432,601 | 360,669 |
| |
427,906 | 243,217 |
| |
390,934 | 476,306 |
| |
363,972 | 358,586 |
| |
354,305 | 69,111 |
| |
345,187 | 306,203 |
| |
342,603 | 347,237 |
| |
339,970 | 172,893 |
| |
337,040 | 214,266 |
| |
259,815 | 214,995 |
| |
240,619 | 191,701 |
| |
234,465 | 227,497 |
| |
233,547 | 174,168 |
| |
232,026 | 157,689 |
| |
203,179 | 215,164 |
| |
200,894 | 153,897 |
| |
197,724 | 143,411 |
| |
196,154 | 110,235 |
| |
195,805 | 202,518 |
| |
182,473 | 53,831 |
| |
176,443 | 153,755 |
| |
170,394 | 87,601 |
| |
170,086 | 98,999 |
| |
164,746 | 106,183 |
| |
157,302 | 140,887 |
| |
149,377 | 130,542 |
| |
137,084 | 37,406 |
| |
128,350 | 104,586 |
| |
127,079 | 106,568 |
| |
124,256 | 113,727 |
| |
116,775 | 94,792 |
| |
112,240 | 129,481 |
| |
110,678 | 92,891 |
| |
109,667 | 85,415 |
| |
102,475 | 41,328 |
| |
101,024 | 57,628 |
| |
97,585 | 54,573 |
| |
95,191 | 69,992 |
| |
94,600 | 61,493 |
| |
88,894 | n/a |
| |
87,456 | 58,841 |
| |
85,085 | 35,117 |
| |
81,047 | 84,031 |
| |
79,924 | 52,177 |
| |
79,122 | 62,201 |
| |
78,934 | 68,864 |
| |
78,909 | 74,632 |
| |
78,797 | 12,926 |
| |
78,659 | 47,648 |
| |
74,213 | 31,365 |
| |
68,956 | n/a |
| |
67,941 | 68,768 |
| |
67,169 | 59,480 |
| |
65,618 | 104,168 |
| |
64,354 | 27,354 |
| |
63,798 | 76,622 |
| |
52,499 | 25,444 |
| |
51,268 | 51,675 |
| |
50,934 | 58,254 |
| |
50,296 | n/a |
Note: Counts of immigrants since 1986 for Russia includes "Soviet Union (former)", and for Czech Republic includes "Czechoslovakia (former)".
Effects of immigration
Demographics
The Census Bureau estimates the US population will grow from 317 million in 2014 to 417 million in 2060 with immigration, when nearly 20% will be foreign born.[82] A 2015 report from the Pew Research Center projects that by 2065, non-Hispanic whites will account for 46% of the population, down from the 2005 figure of 67%.[83] Non-Hispanic whites made up 85% of the population in 1960.[84] It also foresees the Hispanic population rising from 17% in 2014 to 29% by 2060. The Asian population is expected to nearly double in 2060.[82] Overall, the Pew Report predicts the population of the United States will rise from 296 million in 2005 to 441 million in 2065, but only to 338 million with no immigration.[83]
In 35 of the country's 50 largest cities, non-Hispanic whites were at the last census or are predicted to be in the minority.[85] In California, non-Hispanic whites slipped from 80% of the state's population in 1970 to 42.3% in 2001[86] and 39% in 2013.[87]
Immigrant segregation declined in the first half of the 20th century, but has been rising over the past few decades. This has caused questioning of the correctness of describing the United States as a melting pot. One explanation is that groups with lower socioeconomic status concentrate in more densely populated area that have access to public transit while groups with higher socioeconomic status move to suburban areas. Another is that some recent immigrant groups are more culturally and linguistically different from earlier groups and prefer to live together due to factors such as communication costs.[88] Another explanation for increased segregation is white flight.[89]
- Place of birth for the foreign-born population in the United States
| Top ten countries | 2013 | 2010 | 2000 | 1990 |
|---|---|---|---|---|
| Mexico | 11,584,977 | 11,711,103 | 9,177,487 | 4,298,014 |
| China | 2,383,831 | 2,166,526 | 1,518,652 | 921,070 |
| India | 2,034,677 | 1,780,322 | 1,022,552 | 450,406 |
| Philippines | 1,843,989 | 1,777,588 | 1,369,070 | 912,674 |
| Vietnam | 1,281,010 | 1,240,542 | 988,174 | 543,262 |
| El Salvador | 1,252,067 | 1,214,049 | 817,336 | 465,433 |
| Cuba | 1,144,024 | 1,104,679 | 872,716 | 736,971 |
| South Korea | 1,070,335 | 1,100,422 | 864,125 | 568,397 |
| Dominican Republic | 991,046 | 879,187 | 687,677 | 347,858 |
| Guatemala | 902,293 | 830,824 | 480,665 | 225,739 |
| All of Latin America | 21,224,087 | 16,086,974 | 8,407,837 | |
| All Immigrants | 41,347,945 | 39,955,854 | 31,107,889 | 19,767,316 |
Source: 1990 and 2000 decennial Census and 2010 American Community Survey
Economic
In a late 1980s study, economists overwhelmingly viewed immigration, including illegal immigration, as a positive for the economy.[90] Recent surveys of leading economists shows a consensus behind the notion that high-skilled immigration makes the average American better off, and strong support behind the notion that low-skilled immigration also makes the average American better off.[91][92] According to James Smith, a senior economist at Santa Monica-based RAND Corporation and lead author of the United States National Research Council's study "The New Americans: Economic, Demographic, and Fiscal Effects of Immigration", immigrants contribute as much as $10 billion to the U.S. economy each year.[93] The NRC report found that although immigrants, especially those from Latin America, caused a net loss in terms of taxes paid versus social services received, immigration can provide an overall gain to the domestic economy due to an increase in pay for higher-skilled workers, lower prices for goods and services produced by immigrant labor, and more efficiency and lower wages for some owners of capital. The report also notes that although immigrant workers compete with domestic workers for low-skilled jobs, some immigrants specialize in activities that otherwise would not exist in an area, and thus can be beneficial for all domestic residents.[94]
A non-partisan report in 2007 from the Congressional Budget Office concluded that most estimates show that illegal immigrants impose a net cost to state and local governments, but "that no agreement exists as to the size of, or even the best way of measuring, the cost on a national level."[95] Estimates of the net national cost that illegal immigrants impose on the United States vary greatly, with the Urban Institute saying it was $1.9 billion in 1992, and a Rice University professor putting it at $19.3 billion in 1993.[96] About twenty-one million immigrants, or about fifteen percent of the labor force, hold jobs in the United States; however, the number of unemployed is only seven million, meaning that immigrant workers are not taking jobs from domestic workers, but rather are doing jobs that would not have existed had the immigrant workers not been in the United States.[97] U.S. Census Bureau's Survey of Business Owners: Hispanic-Owned Firms: 2002 indicated that the number of Hispanic-owned businesses in the United States grew to nearly 1.6 million in 2002. Those businesses generated about $222 billion in gross revenue.[98] The report notes that the burden of poor immigrants is not borne equally among states, and is most heavy in California.[99] Another claim supporting expanding immigration levels is that immigrants mostly do jobs Americans do not want. A 2006 Pew Hispanic Center report added evidence to support this claim, when they found that increasing immigration levels have not hurt employment prospects for American workers.[100] Research shows an economic consensus that, taken as a whole, immigrants raise living standards for American workers by boosting demand and increasing productivity, contributing to innovation, and lowering prices.[101]

In 2009, a study by the Cato Institute, a free market think tank, found that legalization of low-skilled illegal resident workers in the US would result in a net increase in US GDP of $180 billion over ten years.[103] The Cato Institute study did not examine the impact on per capita income for most Americans. Jason Riley notes that because of progressive income taxation, in which the top 1% of earners pay 37% of federal income taxes (even though they actually pay a lower tax percentage based on their income), 60% of Americans collect more in government services than they pay in, which also reflects on immigrants.[104] In any event, the typical immigrant and his children will pay a net $80,000 more in their lifetime than they collect in government services according to the NAS.[105] Legal immigration policy is set to maximize net taxation. Illegal immigrants even after an amnesty tend to be recipients of more services than they pay in taxes. In 2010, an econometrics study by a Rutgers economist found that immigration helped increase bilateral trade when the incoming people were connected via networks to their country of origin, particularly boosting trade of final goods as opposed to intermediate goods, but that the trade benefit weakened when the immigrants became assimilated into American culture.[106]
The Kauffman Foundation's index of entrepreneurial activity is nearly 40% higher for immigrants than for natives.[107] Immigrants were involved in the founding of many prominent American high-tech companies, such as Google, Yahoo, YouTube, Sun Microsystems, and eBay.[108] On the poor end of the spectrum, the "New Americans" report found that low-wage immigration does not, on aggregate, lower the wages of most domestic workers. The report also addresses the question of if immigration affects black Americans differently from the population in general: "While some have suspected that blacks suffer disproportionately from the inflow of low-skilled immigrants, none of the available evidence suggests that they have been particularly hard-hit on a national level. Some have lost their jobs, especially in places where immigrants are concentrated. But the majority of blacks live elsewhere, and their economic fortunes are tied to other factors."[109]

A study done in 2005 showed that a third of adult immigrants had not finished high school, and a third had no health insurance.[39] Robert Samuelson points out that poor immigrants strain public services such as local schools and health care. He points out that "from 2000 to 2006, 41 percent of the increase in people without health insurance occurred among Hispanics."[110] According to the immigration reduction advocacy group Center for Immigration Studies, 25.8% of Mexican immigrants live in poverty, which is more than double the rate for natives in 1999.[111] In another report, The Heritage Foundation notes that from 1990 to 2006, the number of poor Hispanics increased by 3.2 million, from 6 million to 9.2 million.[112]

U.S. citizens will not take certain jobs usually done by foreign workers, like manual labor involving agriculture.[116] Fruit picking labor costs are estimated at $0.36 per pound, so a production rate of 1 pound per minute is required to earn minimum wage after fees are deducted.[117] Hard physical labor and dangerous jobs with a small paycheck create labor shortages in certain job markets that can only be satisfied using foreign labor.[118] Foreign laborers often work for no pay for several months each year to earn enough to pay their employer for the cost of their H series visa.[119] Hispanic immigrants in the United States were hit hard by the subprime mortgage crisis. There was a disproportionate level of foreclosures in some immigrant neighborhoods.[120] The banking industry provided home loans to undocumented immigrants, viewing it as an untapped resource for growing their own revenue stream.[121] In October 2008, KFYI reported that according to the U.S. Department of Housing and Urban Development, five million illegal immigrants held fraudulent home mortgages.[122] The story was later pulled from their website and replaced with a correction.[123] The Phoenix Business Journal cited a HUD spokesman saying that there was no basis to news reports that more than five million bad mortgages were held by illegal immigrants, and that the agency had no data showing the number of illegal immigrants holding foreclosed or bad mortgages.[124]
Immigration and foreign labor documentation fees increased over 80% in 2007, with over 90% of funding for USCIS derived from immigration application fees, creating many USCIS jobs involving immigration to US, such as immigration interview officials, finger print processor, Department of Homeland Security, etc.[125] An article by American Enterprise Institute researcher Jason Richwine states that while earlier European immigrants were often poor when they arrived, by the third generation they had economically assimilated to be indistinguishable from the general population. However, for the Hispanic immigrants the process stalls at the second generation and the third generation continues to be substantially poorer than whites.[126] Despite apparent disparities between different communities,[127] Asians, a significant number of whom arrived in the United States after 1965,[128] had the highest median income per household among all race groups as of 2008.[129]
According to NPR in 2005, about 3% of illegal immigrants were working in agriculture.[130] The H-2A visa allows U.S. employers to bring foreign nationals to the United States to fill temporary agricultural jobs.[131] The passing of tough immigration laws in several states from around 2009 provides a number of practical case studies. The state of Georgia passed immigration law HB 87 in 2011;[132] this led, according to the coalition of top Kansas businesses, to 50% of its agricultural produce being left to rot in the fields, at a cost to the state of more than $400m. Overall losses caused by the act were $1bn; it was estimated that the figure would become over $20bn if all the estimated 325,000 undocumented workers left Georgia. The cost to Alabama of its crackdown in June 2011 has been estimated at almost $11bn, with up to 80,000 unauthorised immigrant workers leaving the state.[133]
While immigration from Latin America has kept the United States from falling off a Japanese or European style demographic cliff, this is a limited resource as fertility rates continue to decline throughout the Americas and the world.[134]
According to Congressional Research Service, since the 1970s while immigration to the United States increased, the lower 90% of tax filers incomes became stagnant, and eventually began to decrease since 2000.[135]
Social
Irish immigration was opposed in the 1850s by the nativist Know Nothing movement, originating in New York in 1843. It was engendered by popular fears that the country was being overwhelmed by Irish Catholic immigrants. On March 14, 1891, a lynch mob stormed a local jail and lynched several Italians following the acquittal of several Sicilian immigrants alleged to be involved in the murder of New Orleans police chief David Hennessy. The Congress passed the Emergency Quota Act in 1921, followed by the Immigration Act of 1924. The Immigration Act of 1924 was aimed at limiting immigration overall, and making sure that the nationalities of new arrivals matched the overall national profile.
After the September 11 attacks, many Americans entertained doubts and suspicions about people apparently of Middle-Eastern origins. NPR in 2010 fired a prominent black commentator, Juan Williams, when he talked publicly about his fears on seeing people dressed like Muslims on airplanes.[136]
Racist thinking among and between minority groups does occur;[137][138] examples of this are conflicts between blacks and Korean immigrants,[139] notably in the 1992 Los Angeles Riots, and between African Americans and non-white Latino immigrants.[140][141] There has been a long running racial tension between African American and Mexican prison gangs, as well as significant riots in California prisons where they have targeted each other, for ethnic reasons.[142][143] There have been reports of racially motivated attacks against African Americans who have moved into neighborhoods occupied mostly by people of Mexican origin, and vice versa.[144][145] There has also been an increase in violence between non-Hispanic Anglo Americans and Latino immigrants, and between African immigrants and African Americans.[146]
A 2007 study on assimilation found that Mexican immigrants are less fluent in English than both non-Mexican Hispanic immigrants and other immigrants. While English fluency increases with time stayed in the United States, although further improvements after the first decade are limited, Mexicans never catch up with non-Mexican Hispanics, who never catch up with non-Hispanics. The study also writes that "Even among immigrants who came to the United States before they were five years old and whose entire schooling was in the United States, those Mexican born have average education levels of 11.7 years, whereas those from other countries have average levels of education of 14.1 years." Unlike other immigrants, Mexicans have a tendency to live in communities with many other Mexicans which decreases incentives for assimilation. Correcting for this removes about half the fluency difference between Mexicans and other immigrants.[147]
Religious diversity
Immigration from South Asia and elsewhere has contributed to enlarging the religious composition of the United States. Islam in the United States is growing mainly due to immigration. Hinduism in the United States, Buddhism in the United States, and Sikhism in the United States are other examples.[148]
Since 1992, an estimated 1.7 million Muslims, approximately 1 million Hindus, and approximately 1 million Buddhists have immigrated legally to the United States.[149]
Political
A Boston Globe article attributed Barack Obama's win in the 2008 U.S. Presidential election to a marked reduction over the preceding decades in the percentage of whites in the American electorate, attributing this demographic change to the Immigration Act of 1965.[31] The article quoted Simon Rosenberg, president and founder of the New Democrat Network, as having said that the Act is "the most important piece of legislation that no one's ever heard of," and that it "set America on a very different demographic course than the previous 300 years."[31]
Immigrants differ on their political views; however, the Democratic Party is considered to be in a far stronger position among immigrants overall.[150][151] Research shows that religious affiliation can also significantly impact both their social values and voting patterns of immigrants, as well as the broader American population. Hispanic evangelicals, for example, are more strongly conservative than non-Hispanic evangelicals.[152] This trend is often similar for Hispanics or others strongly identifying with the Catholic Church, a religion that strongly opposes abortion and gay marriage.
The key interests groups that lobby on immigration are religious, ethnic and business groups, together with some liberals and some conservative public policy organizations. Both the pro- and anti- groups affect policy.[153]
Studies have suggested that some special interest group lobby for less immigration for their own group and more immigration for other groups since they see effects of immigration, such as increased labor competition, as detrimental when affecting their own group but beneficial when affecting other groups.
A 2007 paper found that both pro- and anti-immigration special interest groups play a role in migration policy. "Barriers to migration are lower in sectors in which business lobbies incur larger lobbying expenditures and higher in sectors where labor unions are more important."[154] A 2011 study examining the voting of US representatives on migration policy suggests that "representatives from more skilled labor abundant districts are more likely to support an open immigration policy towards the unskilled, whereas the opposite is true for representatives from more unskilled labor abundant districts."[155]
After the 2010 election, Gary Segura of Latino Decisions stated that Hispanic voters influenced the outcome and "may have saved the Senate for Democrats".[156] Several ethnic lobbies support immigration reforms that would allow illegal immigrants that have succeeded in entering to gain citizenship. They may also lobby for special arrangements for their own group. The Chairman for the Irish Lobby for Immigration Reform has stated that "the Irish Lobby will push for any special arrangement it can get — 'as will every other ethnic group in the country.'"[157][158] The irrendentist and ethnic separatist movements for Reconquista and Aztlán see immigration from Mexico as strengthening their cause.[159][160]
The book Ethnic Lobbies and US Foreign Policy (2009) states that several ethnic special interest groups are involved in pro-immigration lobbying. Ethnic lobbies also influence foreign policy. The authors write that "Increasingly, ethnic tensions surface in electoral races, with House, Senate, and gubernatorial contests serving as proxy battlegrounds for antagonistic ethnoracial groups and communities. In addition, ethnic politics affect party politics as well, as groups compete for relative political power within a party". However, the authors argue that currently ethnic interest groups, in general, do not have too much power in foreign policy and can balance other special interest groups.[161]
In a 2012 news story, Reuters reported, "Strong support from Hispanics, the fastest-growing demographic in the United States, helped tip President Barack Obama's fortunes as he secured a second term in the White House, according to Election Day polling."[162]
Lately, there is talk among several Republican leaders, such as governors Bobby Jindal and Susana Martinez, of taking a new, friendlier approach to immigration. Former US Secretary of Commerce Carlos Gutierrez is promoting the creation of Republicans for Immigration Reform.[163][164]
Health
The issue of the health of immigrants and the associated cost to the public has been largely discussed. The non-emergency use of emergency rooms ostensibly indicates an incapacity to pay, yet some studies allege disproportionately lower access to unpaid health care by immigrants.[165] For this and other reasons, there have been various disputes about how much immigration is costing the United States public health system.[166] University of Maryland economist and Cato Institute scholar Julian Lincoln Simon concluded in 1995 that while immigrants probably pay more into the health system than they take out, this is not the case for elderly immigrants and refugees, who are more dependent on public services for survival.[167]
Immigration from areas of high incidences of disease is thought to have fueled the resurgence of tuberculosis (TB), chagas, and hepatitis in areas of low incidence.[168] According to Centers for Disease Control and Prevention (CDC), TB cases among foreign-born individuals remain disproportionately high, at nearly nine times the rate of U.S.-born persons.[169][170] To reduce the risk of diseases in low-incidence areas, the main countermeasure has been the screening of immigrants on arrival.[171] HIV/AIDS entered the United States in around 1969, likely through a single infected immigrant from Haiti.[172][173] Conversely, many new HIV infections in Mexico can be traced back to the United States.[174] People infected with HIV were banned from entering the United States in 1987 by executive order, but the 1993 statute supporting the ban was lifted in 2009. The executive branch is expected to administratively remove HIV from the list of infectious diseases barring immigration, but immigrants generally would need to show that they would not be a burden on public welfare.[175] Researchers have also found what is known as the "healthy immigrant effect", in which immigrants in general tend to be healthier than individuals born in the U.S.[176][177]
Crime
Most studies suggest that immigrants are under-represented in arrest statistics in the United States. However, there is also data indicating that the children of immigrants from poor rural areas of the world often have higher rates of arrest than do native born children, or their parents [178] Tony Waters writes that this is a by-product of the strains that emerge between immigrant parents living in poor, inner city neighborhoods. This occurs particularly in immigrant groups with many children as they begin to form particularly strong peer sub-cultures.[179] A 1999 paper by John Hagan and Alberto Palloni also estimated that the involvement in crime by Hispanic immigrants is less than that of other citizens.[180] A 2006 Op-Ed in The New York Times by Harvard University Professor in Sociology Robert J. Sampson says that immigration of Hispanics may in fact be associated with decreased crime.[181] In 2008, Sampson wrote in Contexts that first-generation immigrants to the U.S. are 45% less likely to commit violence than third-generation immigrants.[182] Research also suggests that immigration between 1990 and 2000 (and between 1994 and 2004)[183] may partly explain the reduction in the US crime rate.[184] Furthermore, one study finds that Secure Communities, an immigration enforcement program which led to a quarter of a million of detentions (when the study was published; November 2014), had no observable impact on the crime rate.[185] A 2015 study found that the 1986 Immigration Reform and Control Act, which legalized almost 3 million immigrants, led to "decreases in crime of 3-5 percent, primarily due to decline in property crimes, equivalent to 120,000-180,000 fewer violent and property crimes committed each year due to legalization".[186] A 2009 study found evidence that immigration to the U.S. lowered crime rates by preserving two-parent family structures.[187]
A 2006 article by Migration Policy Institute cited data from the 2000 US Census as evidence for that foreign-born men had lower incarceration rates than native-born men.[188] According to a 2007 report by the Immigration Policy Center, the American Immigration Law Foundation, citing data from the 2000 US Census, native-born American men between 18–39 are five times more likely to be incarcerated than immigrants in the same demographic.[189] A 2008 study by the Public Policy Institute of California, found that, "...on average, between 2000 and 2005, cities that had a higher share of recent immigrants (those arriving between 2000 and 2005) saw their crime rates fall further than cities with a lower share" but adds, "As with most studies, we do not have ideal data. This lack of data restricts the questions we will be able to answer. In particular, we cannot focus on the undocumented population explicitly".[190] In a study released by the same Institute, immigrants were ten times less likely to be incarcerated than native born Americans.[191]
Explanations for the lower incarceration rates of immigrants include:
- The "at-risk" age for crime is between about 16 and 24 years old, and most immigrants arrive after reaching this ages.
- Legal immigrants are screened for criminality prior to entry.
- Legal and illegal immigrants who commit serious crimes are being deported and therefore are unable to commit more crimes (unlike their US counterparts who remain in the US). They are unlikely to become "career criminals" moving in and out of the prison system. In the last 10 years, 816,000 criminal aliens have been removed from the United States. This does not include immigrants whose only offense was living or working illegally in the United States.[192]
- Immigrants understand the severe consequences of being arrested given their legal status (i.e. threat of deportation).
- The migration process selects people who are either more responsive to deterrence or have lower criminal tendencies than typical natives do.[193]
In her 2004 article for the City Journal, Heather Mac Donald argues that sanctuary city policies interfere with law enforcement's ability to deport illegal aliens for offenses below felonies or misdemeanors. She also states that "in Los Angeles, 95 percent of all outstanding warrants for homicide are for illegal aliens. Up to two-thirds of all fugitive felony warrants (17,000) are for illegal aliens" and that "60 percent of the 20,000-strong 18th Street Gang in Southern California" were illegal aliens, based on a "confidential California Department of Justice study."[194]
The Center for Immigration Studies in a 2009 report argued that "New government data indicate that immigrants have high rates of criminality, while older academic research found low rates. The overall picture of immigrants and crime remains confused due to a lack of good data and contrary information." It also criticized the reports by the Public Policy Institute of California and Immigration Policy Center for using data from the 2000 Census according to which 4% of prisoners were immigrants. Non-citizens often have a strong incentive to deny this in order to prevent deportation and there are also other problems. Better methods have found 20–22% immigrants. It also criticized studies looking at percentages of immigrants in a city and crime for only looking at overall crime and not immigrant crime. A 2009 analysis by the Department of Homeland Security found that crime rates were higher in metropolitan areas that received large numbers of legal immigrants, contradicting several older cross-city comparisons.[192]
Environment
Some commentators have suggested that increased immigration has a negative effect on the environment, especially as the level of economic development of the United States (and by extension, its energy, water[195] and other needs that underpin its prosperity) means that the impact of a larger population is greater than what would be experienced in other countries.[196]
Perceived heavy immigration, especially in the southwest, has led to some fears about population pressures on the water supply in some areas. California continues to grow by more than a half-million a year and is expected to reach 48 million in 2030.[197] According to the California Department of Water Resources, if more supplies are not found by 2020, residents will face a water shortfall nearly as great as the amount consumed today.[198] Los Angeles is a coastal desert able to support at most one million people on its own water.[199] California is considering using desalination to solve this problem.[200]
Education
Scientific laboratories and startup internet opportunities have been a powerful American magnet. By 2000, 23% of scientists with a PhD in the U.S. were immigrants, including 40% of those in engineering and computers.[201] Roughly a third of the United State's college and universities graduate students in STEM fields are foreign nationals – in some states it is well over half of their graduate students. On Ash Wednesday, March 5, 2014, the presidents of 28 Catholic and Jesuit colleges and universities, joined the "Fast for Families" movement.[202] The "Fast for Families" movement reignited the immigration debate in the fall of 2013 when the movement's leaders, supported by many members of Congress and the President, fasted for twenty-two days on the National Mall in Washington, D.C.[203]
A study on public schools in California found that white enrollment declined in response to increases in the number of Spanish-speaking Limited English Proficient and Hispanic students. This white flight was greater for schools with relatively larger proportions of Spanish-speaking Limited English Proficient.[89]
Among 25- to 44-year-olds, 55% of Hispanic immigrants that arrived after age 13 had not completed high school.[204]
Effects on African Americans
Harvard economist George J. Borjas stated that there is controversy over the "huge redistribution [of wealth] away from [unskilled U.S. Citizen] workers to [American employers] who use illegal immigrants."[205] He suggested that immigration had detrimental effects on African-American employment in terms of lower wages and the number of persons employed. He also reported that a 10% increase in the supply of workers reduced the black wage of that group by 2.5%, lowered the employment rate by 5.9% and increased the black incarceration rate by 1.3%.[206]
Public opinion
The ambivalent feeling of Americans toward immigrants is shown by a positive attitude toward groups that have been visible for a century or more, and much more negative attitude toward recent arrivals. For example, a 1982 national poll by the Roper Center at the University of Connecticut showed respondents a card listing a number of groups and asked, "Thinking both of what they have contributed to this country and have gotten from this country, for each one tell me whether you think, on balance, they've been a good or a bad thing for this country," which produced the results shown in the table. "By high margins, Americans are telling pollsters it was a very good thing that Poles, Italians, and Jews immigrated to America. Once again, it's the newcomers who are viewed with suspicion. This time, it's the Mexicans, the Filipinos, and the people from the Caribbean who make Americans nervous."[207][208]
In a 2002 study, which took place soon after the September 11 attacks, 55% of Americans favored decreasing legal immigration, 27% favored keeping it at the same level, and 15% favored increasing it.[209]
In 2006, the immigration-reduction advocacy think tank the Center for Immigration Studies released a poll that found that 68% of Americans think U.S. immigration levels are too high, and just 2% said they are too low. They also found that 70% said they are less likely to vote for candidates that favor increasing legal immigration.[210] In 2004, 55% of Americans believed legal immigration should remain at the current level or increased and 41% said it should be decreased.[211] The less contact a native-born American has with immigrants, the more likely one would have a negative view of immigrants.[211]
One of the most important factors regarding public opinion about immigration is the level of unemployment; anti-immigrant sentiment is where unemployment is highest, and vice versa.[212]
Surveys indicate that the U.S. public consistently makes a sharp distinction between legal and illegal immigrants, and generally views those perceived as "playing by the rules" with more sympathy than immigrants that have entered the country illegally.[213]
Legal issues
Laws concerning immigration and naturalization
Laws concerning immigration and naturalization include:
- the 1990 Immigration Act (IMMACT), which limits the annual number of immigrants to 700,000. It emphasizes that family reunification is the main immigration criterion, in addition to employment-related immigration.
- the Antiterrorism and Effective Death Penalty Act (AEDPA)
- the Illegal Immigration Reform and Immigrant Responsibility Act (IIRIRA)
AEDPA and IIRARA exemplify many categories of criminal activity for which immigrants, including green card holders, can be deported and have imposed mandatory detention for certain types of cases.
Asylum for refugees
In contrast to economic migrants, who generally do not gain legal admission, refugees, as defined by international law, can gain legal status through a process of seeking and receiving asylum, either by being designated a refugee while abroad, or by physically entering the United States and requesting asylum status thereafter. A specified number of legally defined refugees, who either apply for asylum overseas or after arriving in the U.S., are admitted annually. Refugees compose about one-tenth of the total annual immigration to the United States, though some large refugee populations are very prominent. In the year 2014, the number of asylum seekers accepted into the U.S. was about 120,000. This compared with about 31,000 in the UK and 13,500 in Canada.[215] Japan accepted just 41 refugees for resettlement in 2007.[216]
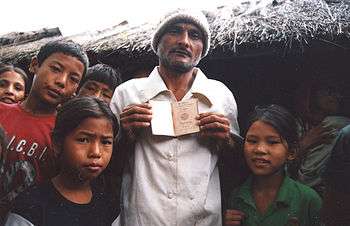
Since 1975, more than 1.3 million refugees from Asia have been resettled in the United States.[217] Since 2000 the main refugee-sending regions have been Somalia, Liberia, Sudan, and Ethiopia.[218] The ceiling for refugee resettlement for fiscal year 2008 was 80,000 refugees.[219] The United States expected to admit a minimum of 17,000 Iraqi refugees during fiscal year 2009.[220] The U.S. has resettled more than 42,000 Bhutanese refugees from Nepal since 2008.[221]
In fiscal year 2008, the Office of Refugee Resettlement (ORR) appropriated over $655 million for long-term services provided to refugees after their arrival in the US.[222] The Obama administration has kept to about the same level.[223]
Miscellaneous documented immigration
In removal proceedings in front of an immigration judge, cancellation of removal is a form of relief that is available for certain long-time residents of the United States.[224] It allows a person being faced with the threat of removal to obtain permanent residence if that person has been physically present in the U.S. for at least ten years, has had good moral character during that period, has not been convicted of certain crimes, and can show that removal would result in exceptional and extremely unusual hardship to his or her U.S. citizen or permanent resident spouse, children, or parent. This form of relief is only available when a person is served with a Notice to Appear to appear in the proceedings in the court.[225][226]
Members of Congress may submit private bills granting residency to specific named individuals. A special committee vets the requests, which require extensive documentation. The Central Intelligence Agency has the statutory authority to admit up to one hundred people a year outside of normal immigration procedures, and to provide for their settlement and support. The program is called "PL110", named after the legislation that created the agency, Public Law 110, the Central Intelligence Agency Act.
Illegal immigration
The Illegal immigrant population of the United States is estimated to be between 7 and 20 million.[227] The majority of the illegal immigrants are from Mexico.[228]
In a 2011 news story, Los Angeles Times reported, "The annual report, relied upon by both sides in the contentious immigration debate, found 11.2 million illegal immigrants living in the U.S., statistically identical to the 11.1 million estimated in 2009. ... The report also found that illegal immigrants in 2010 were parents of 5.5 million children, 4.5 million of whom were born in the U.S. and are citizens. Because illegal immigrants are younger and more likely to be married, they represented a disproportionate share of births — 8% of the babies born in the U.S. between March 2009 and March 2010 were to at least one illegal immigrant parent."[229]
In June 2012, President Obama issued a memorandum instructing officers of the federal government to defer deporting young illegal immigrants who had been brought to the U.S. as children. Obama's new non-deportation policy allows 1.7 million illegal immigrants to apply for the temporary right to live and work in the United States.[230] The memorandum is the move by the Obama administration to use its executive powers to revise immigration procedures without changing the law.[231] Beginning March 4, 2013, illegal immigrants who can show that time apart from a U.S. spouse, child or parent would create "extreme hardship" can apply for legal visas without leaving the U.S.[232]
On November 25, 2013, Ju Hong, a 24-year-old South Korean immigrant without legal documentation, shouted at Obama to use his executive power to stop deportation of illegal immigrants.[233] Obama said "If, in fact, I could solve all these problems without passing laws in Congress, then I would do so." "But we're also a nation of laws, that's part of our tradition," he continued. "And so the easy way out is to try to yell and pretend like I can do something by violating our laws. And what I'm proposing is the harder path, which is to use our democratic processes to achieve the same goal."[234][235][236]
On November 20, 2014, President Obama announced a set of executive actions which could allow up to an estimated 45% of undocumented immigrants to legally stay and work in the United States. Although not without precedent under prior presidents,[237] "deferred action" was ruled illegal in the lawsuit United States v. Texas, though the Supreme Court split 4-4 and thus did not set a nationally binding precedent.
Military immigration
On November 15, 2013 the United States Citizenship and Immigration Services announced that they would be issuing a new policy memorandum called "parole in place.[238]" Parole in place would offer green cards to immigrant parents, spouses and children of active military duty personnel. Prior to this law relatives of military personnel - excluding husbands and wives - were forced to leave the United States and apply for green cards in their home countries. The law allows for family members to avoid the possible ten-year bar from the United States and remain in the United States while applying for lawful permanent residence.[239] The parole status, given in one year terms, will be subject to the family member being "absent a criminal conviction or other serious adverse factors."[239]
Immigration in popular culture

The history of immigration to the United States is the history of the country itself, and the journey from beyond the sea is an element found in American folklore, appearing over and over again in everything from The Godfather to Gangs of New York to "The Song of Myself" to Neil Diamond's "America" to the animated feature An American Tail.[241]
From the 1880s to the 1910s, vaudeville dominated the popular image of immigrants, with very popular caricature portrayals of ethnic groups. The specific features of these caricatures became widely accepted as accurate portrayals.[242]
In The Melting Pot (1908), playwright Israel Zangwill (1864–1926) explored issues that dominated Progressive Era debates about immigration policies. Zangwill's theme of the positive benefits of the American melting pot resonated widely in popular culture and literary and academic circles in the 20th century; his cultural symbolism – in which he situated immigration issues – likewise informed American cultural imagining of immigrants for decades, as exemplified by Hollywood films.[243][244] The popular culture's image of ethnic celebrities often includes stereotypes about immigrant groups. For example, Frank Sinatra's public image as a superstar contained important elements of the American Dream while simultaneously incorporating stereotypes about Italian Americans that were based in nativist and Progressive responses to immigration.[245]
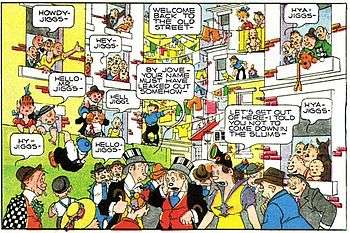
The process of assimilation has been a common theme of popular culture. For example, "lace-curtain Irish" refers to middle-class Irish Americans desiring assimilation into mainstream society in counterpoint to the older, more raffish "shanty Irish". The occasional malapropisms and left-footed social blunders of these upward mobiles were gleefully lampooned in vaudeville, popular song, and the comic strips of the day such as Bringing Up Father, starring Maggie and Jiggs, which ran in daily newspapers for 87 years (1913 to 2000).[246][247] In The Departed (2006), Staff Sergeant Dignam regularly points out the dichotomy between the lace curtain Irish lifestyle Billy Costigan enjoyed with his mother, and the shanty Irish lifestyle of Costigan's father. In recent years the popular culture has paid special attention to Mexican immigration[248] and the film Spanglish (2004) tells of a friendship of a Mexican housemaid (Paz Vega) and her boss played by Adam Sandler.
Immigration in literature
Novelists and writers have captured much of the color and challenge in their immigrant lives through their writings.[249]
Regarding Irish women in the 19th century, there were numerous novels and short stories by Harvey O'Higgins, Peter McCorry, Bernard O'Reilly and Sarah Orne Jewett that emphasize emancipation from Old World controls, new opportunities and expansiveness of the immigrant experience.[250]
On the other hand, Hladnik studies three popular novels of the late 19th century that warned Slovenes not to immigrate to the dangerous new world of the United States.[251]
Jewish American writer Anzia Yezierska wrote her novel Bread Givers (1925) to explore such themes as Russian-Jewish immigration in the early 20th century, the tension between Old and New World Yiddish culture, and women's experience of immigration. A well established author Yezierska focused on the Jewish struggle to escape the ghetto and enter middle- and upper-class America. In the novel, the heroine, Sara Smolinsky, escape from New York City's "down-town ghetto" by breaking tradition. She quits her job at the family store and soon becomes engaged to a rich real-estate magnate. She graduates college and takes a high-prestige job teaching public school. Finally Sara restores her broken links to family and religion.[252]
The Swedish author Vilhelm Moberg in the mid-20th century wrote a series of four novels describing one Swedish family's migration from Småland to Minnesota in the late 19th century, a destiny shared by almost one million people. The author emphasizes the authenticity of the experiences as depicted (although he did change names).[253] These novels have been translated into English (The Emigrants, 1951, Unto a Good Land, 1954, The Settlers, 1961, The Last Letter Home, 1961). The musical Kristina från Duvemåla by ex-ABBA members Björn Ulvaeus and Benny Andersson is based on this story.[254][255]
The Immigrant is a musical by Steven Alper, Sarah Knapp, and Mark Harelik. The show is based on the story of Harelik's grandparents, Matleh and Haskell Harelik, who traveled to Galveston, Texas in 1909.[256]
Documentary films

In their documentary How Democracy Works Now: Twelve Stories, filmmakers Shari Robertson and Michael Camerini examine the American political system through the lens of immigration reform from 2001 to 2007. Since the debut of the first five films, the series has become an important resource for advocates, policy-makers and educators.[257]
That film series premiered nearly a decade after the filmmakers' landmark documentary film Well-Founded Fear which provided a behind-the-scenes look at the process for seeking asylum in the United States. That film still marks the only time that a film-crew was privy to the private proceedings at the U.S. Immigration and Naturalization Service (INS), where individual asylum officers ponder the often life-or-death fate of immigrants seeking asylum.
Legal perspectives
University of North Carolina law professor Hiroshi Motomura has identified three approaches the United States has taken to the legal status of immigrants in his book Americans in Waiting: The Lost Story of Immigration and Citizenship in the United States. The first, dominant in the 19th century, treated immigrants as in transition; in other words, as prospective citizens. As soon as people declared their intention to become citizens, they received multiple low-cost benefits, including the eligibility for free homesteads in the Homestead Act of 1869, and in many states, the right to vote. The goal was to make the country more attractive, so large numbers of farmers and skilled craftsmen would settle new lands. By the 1880s, a second approach took over, treating newcomers as "immigrants by contract". An implicit deal existed where immigrants who were literate and could earn their own living were permitted in restricted numbers. Once in the United States, they would have limited legal rights, but were not allowed to vote until they became citizens, and would not be eligible for the New Deal government benefits available in the 1930s. The third and more recent policy is "immigration by affiliation", which Motomura argues is the treatment which depends on how deeply rooted people have become in the country. An immigrant who applies for citizenship as soon as permitted, has a long history of working in the United States, and has significant family ties, is more deeply affiliated and can expect better treatment.[258]
It has been suggested that the US should adopt policies similar to those in Canada and Australia and select for desired qualities such as education and work experience. Another suggestion is to reduce legal immigration because of being a relative, except for nuclear family members, since such immigrations of extended relatives, who in turn bring in their own extended relatives, may cause a perpetual cycle of "chain immigration".[126]
Interpretive perspectives

The American Dream is the belief that through hard work and determination, any United States immigrant can achieve a better life, usually in terms of financial prosperity and enhanced personal freedom of choice.[259] According to historians, the rapid economic and industrial expansion of the U.S. is not simply a function of being a resource rich, hard working, and inventive country, but the belief that anybody could get a share of the country's wealth if he or she was willing to work hard.[260] This dream has been a major factor in attracting immigrants to the United States.[261]
See also
- Demographics of the United States
- Emigration from the United States
- European colonization of the Americas
- History of laws concerning immigration and naturalization in the United States
- How Democracy Works Now: Twelve Stories
- Illegal immigration to the United States
- Inequality within immigrant families (United States)
- Nativism (politics), opposition to immigration
- Opposition to immigration
- United States immigration statistics
Footnotes
- ↑ Among the thirty four OECD nations, the United States ranks 18th considering solely permanent-type immigrants. ("Does the U.S. admit more legal immigrants than the rest of the world combined?". PolitiFact. Retrieved March 7, 2014.) On a global scale, considering all forms of immigration, the United States ranks 34th with 19,148.45 immigrants per 1 million citizens. (Source: "All countries compared for People > Migration > Net migration per capita". NationMaster. Retrieved March 7, 2014.)
- ↑ Foner, Nancy; Fredrickson, George M., eds. (December 8, 2005). "Chapter 6: American Gatekeeping: Race and Immigration Law in the Twentieth Century". Not Just Black and White: Historical and Contemporary Perspectives on Immigration, Race, and Ethnicity in the United States. Russell Sage Foundation. ISBN 0-87154-270-6.
- 1 2 "Per Country Limit". U.S. Citizenship and Immigration Services. in 1965.
- ↑ "Immigrants in the United States and the Current Economic Crisis", Demetrios G. Papademetriou and Aaron Terrazas, Migration Policy Institute, April 2009.
- ↑ "Immigration Worldwide: Policies, Practices, and Trends". Uma A. Segal, Doreen Elliott, Nazneen S. Mayadas (2010),
- ↑ "Immigrant Population at Record 40 Million in 2010". Yahoo! News. October 6, 2011.
- ↑ "Persons Obtaining Lawful Permanent Resident Status by Leading Core Based Statistical Areas (CBSAs) of Residence and Region and Country of Birth: Fiscal Year 2013". Yearbook of Immigration Statistics: 2013. United States Department of Homeland Security. 2013. Retrieved May 4, 2015.
- ↑ Neil Shah (May 3, 2015). "Immigrants to U.S. From China Top Those From Mexico". The Wall Street Journal. Retrieved May 4, 2015.
China was the country of origin for 147,000 recent U.S. immigrants in 2013, while Mexico sent just 125,000, according to a Census Bureau study by researcher Eric Jensen and others. India, with 129,000 immigrants, also topped Mexico, though the two countries' results weren't statistically different from each other.
- ↑ "CBO: 748,000 Foreign Nationals Granted U.S. Permanent Residency Status in 2009 Because They Had Immediate Family Legally Living in America Archived January 14, 2011, at the Wayback Machine.". CNSnews.com. January 11, 2011
- ↑ Archibold, Randal C. (February 9, 2007). "Illegal Immigrants Slain in an Attack in Arizona". The New York Times. Retrieved July 31, 2008.
- ↑ "Why Don't They Just Get In Line?". Immigration Policy Center, American Immigration Council.
- ↑ Cheryl Sullivan (January 15, 2011). "US Cancels 'virtual fence'". Christian Science Monitor. Retrieved January 19, 2011.
- ↑ "Leaving England: The Social Background of Indentured Servants in the Seventeenth Century", The Colonial Williamsburg Foundation.
- ↑ "Indentured Servitude in Colonial America". Deanna Barker, Frontier Resources.
- 1 2 "A Look at the Record: The Facts Behind the Current Controversy Over Immigration". American Heritage Magazine. December 1981. Volume 33, Issue 1.
- ↑ Schultz, Jeffrey D. (2002). Encyclopedia of Minorities in American Politics: African Americans and Asian Americans. p. 284. ISBN 978-1-57356-148-8. Retrieved March 25, 2010.
- ↑ "A Nation of Immigrants". American Heritage Magazine. February/March 1994. Volume 45, Issue 1.
- ↑ Nicholas J. Evans,"Indirect passage from Europe: Transmigration via the UK, 1836–1914", in Journal for Maritime Research , Volume 3, Issue 1 (2001), pp. 70–84.
- ↑ Wilson, Donna M; Northcott, Herbert C (2008). Dying and Death in Canada. Toronto: University of Toronto Press. p. 27. ISBN 978-1-55111-873-4.
- ↑ Will, George P. (May 2, 2010). "The real immigration scare tactics". Washington Post. Washington, DC. pp. A17.
- ↑ "TURN OF THE CENTURY (1900–1910)". HoustonHistory.com.
- ↑ "An Introduction to Bilingualism: Principles and Processes". Jeanette Altarriba, Roberto R. Heredia (2008). p.212. ISBN 0-8058-5135-6
- ↑ "Old fears over new faces", The Seattle Times, September 21, 2006
- ↑ Persons Obtaining Legal Permanent Resident Status in the United States of America, Source: US Department of Homeland Security
- ↑ A Great Depression?, by Steve H. Hanke, Cato Institute
- ↑ Thernstrom, Harvard Guide to American Ethnic Groups (1980)
- ↑ The Great Depression and New Deal, by Joyce Bryant, Yale-New Haven Teachers Institute.
- ↑ "Jewish refugees from the German Reich, 1933-1939". United States Holocaust Memorial Museum. Retrieved August 20, 2014.
- ↑ Navarro, Armando, Mexicano political experience in occupied Aztlán (2005)
- ↑ (U.S. Senate, Subcommittee on Immigration and Naturalization of the Committee on the Judiciary, Washington, D.C., February 10, 1965. pp. 1–3.)
- 1 2 3 Peter S. Canellos (November 11, 2008). "Obama victory took root in Kennedy-inspired Immigration Act". The Boston Globe. Retrieved November 14, 2008.
- ↑ "Trends in International Migration 2002: Continuous Reporting System on Migration". Organisation for Economic Co-Operation and Development (2003). OECD Publishing. p.280. ISBN 92-64-19949-7
- ↑ "Encyclopedia of Minorities in American Politics: African Americans and Asian Americans". Jeffrey D. Schultz (2000). Greenwood Publishing Group. p.282. ISBN 1-57356-148-7
- ↑ "The Paper curtain: employer sanctions' implementation, impact, and reform". Michael Fix (1991). The Urban Institute. p.304. ISBN 0-87766-550-8
- 1 2 Gonzales, Daniel (March 13, 2016). "How we got here:The many attempts to reform immigration, secure the border". Florida Today. Melbourne, Florida. pp. 1A. Retrieved March 13, 2016.
- ↑ "New Limits In Works on Immigration / Powerful commission focusing on families of legal entrants". San Francisco Chronicle. June 2, 1995
- ↑ Plummer Alston Jones (2004). "Still struggling for equality: American public library services with minorities". Libraries Unlimited. p.154. ISBN 1-59158-243-1
- ↑ Mary E. Williams, Immigration. 2004. Page 69.
- 1 2 "Study: Immigration grows, reaching record numbers". USA Today. December 12, 2005.
- ↑ "Immigration surge called 'highest ever'". Washington Times. December 12, 2005.
- ↑ "Debate Could Turn on a 7-Letter Word". The Washington Post. May 30, 2007.
- ↑ "A Reagan Legacy: Amnesty For Illegal Immigrants". NPR: National Public Radio. July 4, 2010
- ↑ Meyer, Guillaume (February 27, 2009). "Crisis hits Hispanic community hard". France24. Archived from the original on February 12, 2011. Retrieved August 20, 2014.
- ↑ "Immigrants top native born in U.S. job hunt". CNNMoney.com. October 29, 2010.
- ↑ "U.S. Legal Permanent Residents: 2011". Office of Immigration Statistics Annual Flow Report.
- ↑ "Legal Immigration to the United States, 1820-Present". migrationpolicy.org. Retrieved April 19, 2016.
- ↑ "Yearbook of Immigration Statistics: 2012 - Legal Permanent Residents". U.S. Department of Homeland Security
- 1 2 "U.S. Lawful Permanent Residents: 2013" (PDF). Annual Flow Report, May 2014
- ↑ The New Americans, Smith and Edmonston, The Academy Press. Page 5253.
- ↑ The New Americans, Smith and Edmonston, The Academy Press. Page 54.
- ↑ The New Americans, Smith and Edmonston, The Academy Press. Page 56.
- ↑ The New Americans, Smith and Edmonston, The Academy Press. Page 58 ("Immigrants have always moved to relatively few places, settling where they have family or friends, or where there are people from their ancestral country or community.").
- ↑ http://www.publicagenda.org/pages/immigrants 2009 report available for download, "A Place to Call Home: What Immigrants Say Now About Life in America"
- ↑ "Americans Return to Tougher Immigration Stance". Gallup.com. Retrieved September 22, 2011.
- ↑ "Public Agenda Confidence in U.S. Foreign Policy Index". Publicagenda.org. Retrieved April 25, 2012.
- ↑ HOPE YEN Associated Press (April 24, 2012). "MEXICAN MIGRATION APPEARS TO BE IN REVERSE". The San Diego Union-Tribune. Retrieved April 19, 2016.
- ↑ RUBEN NAVARRETTE JR (April 27, 2012). "Navarrette: The Mexican reverse migration". Newsday. Retrieved April 19, 2016.
- ↑ "Mexicans feeling persecuted flee U.S. - CNN.com". CNN. November 27, 2012.
- ↑ "L.A. Now". Los Angeles Times. October 23, 2012.
- ↑ Preston, Julia (July 31, 2008). "Decline Seen in Numbers of People Here Illegally". The New York Times. Retrieved May 5, 2010.
- ↑ "Net Migration from Mexico Falls to Zero—and Perhaps Less". Pew Research Center's Hispanic Trends Project. April 23, 2012. Retrieved April 19, 2016.
- ↑ "Governor candidates oppose sanctuary cities". San Francisco Chronicle. August 4, 2010.
- ↑ "Sanctuary Cities, USA". Ohio Jobs & Justice PAC.
- ↑ https://www.dhs.gov/sites/default/files/publications/LPR%20Flow%20Report%202014_508.pdf
- ↑ Nativity of the Population and Place of Birth of the Native Population: 1850 to 2000 - .xls, .csv
- ↑ Population by Nativity Status and Citizenship: 2010 (estimated to nearest thousand)
- ↑ Mary E. Williams, Immigration. (San Diego: GreenHaven Press) 2004. Page 82.
- ↑ "Frequently Requested Statistics on Immigrants in the United States", Aaron Terrazas and Jeanne Batalova, Migration Policy Institute, October 2009.
- ↑ "Global Migration: A World Ever More on the Move". The New York Times. June 25, 2010.
- ↑ "Illegal Immigrants Estimated to Account for 1 in 12 U.S. Births". The Wall Street Journal. August 12, 2010.
- ↑ Know the flow – economics of immigration
- ↑ "Illegal immigrants in the US: How many are there?". Csmonitor.com. May 16, 2006. Retrieved April 25, 2012.
- ↑ Passel, Jeffrey S. "Estimates of the Size and Characteristics of the Undocumented Population" (PDF). pewhispanic.org. Pew Hispanic Center. Retrieved March 16, 2015.
- ↑ "Characteristics of the Foreign Born in the United States: Results from Census 2000". Migrationinformation.org. Retrieved April 25, 2012.
- ↑ "BBC News - AMERICAS - US population to 'double by 2100'". Retrieved April 19, 2016.
- ↑ "Latinos and the Changing Face of America – Population Reference Bureau". Prb.org. August 20, 2004. Retrieved April 25, 2012.
- ↑ Moscoso, Eunice (September 7, 2001). "More than 100 million Latinos in the U.S. by 2050". The Border Line: An Immigration Blog. Archived from the original on December 29, 2007. Retrieved March 16, 2015.
- ↑ US – Census figures show dramatic growth in Asian, Hispanic populations Archived September 12, 2005, at the Wayback Machine.
- ↑ Knickerbocker, Brad (May 14, 2006). "Population Growth And Immigration". cbsnews.com. The Christian Science Monitor. Archived from the original on August 27, 2006. Retrieved March 16, 2015.
- ↑ Population, by Nativity and Citizenship Status: 2000 and 2011 Pew Hispanic Center
- ↑ Immigration Statistics | Homeland Security. Dhs.gov (February 22, 1999). Retrieved on July 29, 2013.
- 1 2 Colby, Sandra L.; Ortman, Jennifer M. (March 2015). Projections of the Size and Composition of the U.S. Population: 2014 to 2060 (PDF) (Report). U.S. Department of Commerce Economics and Statistics Administration U.S. CENSUS BUREAU. pp. 8–9. Retrieved May 17, 2016.
- 1 2 Modern Immigration Wave Brings 59 Million to U.S., Driving Population Growth and Change Through 2065 (Report). Pew Research Center. September 28, 2015. p. 1. Retrieved May 17, 2016.
- ↑ U.S. Hispanic population to triple by 2050, USA Today
- ↑ Asthana, Anushka (August 21, 2006). "Changing Face of Western Cities". Washington Post. Retrieved June 25, 2007.
- ↑ Whites Now A Minority In California, Census: Non-Hispanic Whites Now 47% Of State's Population, CBS News
- ↑ "California QuickFacts from the US Census Bureau:". US Census Bureau. Retrieved December 26, 2009.
- ↑ Is the Melting Pot Still Hot? Explaining the Resurgence of Immigrant Segregation, David M. Cutler, Edward L. Glaeser, Jacob L. Vigdor, National Bureau of Economic Research, 2005.
- 1 2 Hook, J.; Snyder, J. (2007). "Immigration, ethnicity, and the loss of white students from California public schools, 1990–2000". Population Research and Policy Review. 26 (3): 259–277. doi:10.1007/s11113-007-9035-8.
- ↑ Survey results reported in Simon, Julian L. (1989) The Economic Consequences of Immigration Boston: Basil Blackwell are discussed widely and available as of September 12, 2007, at a Cato group policy paper by Simon here Archived September 12, 2007, at the Wayback Machine.. They find that 81 percent of the economists surveyed felt that 20th century immigration had very favorable effects, and 74 percent felt that illegal immigration had positive effects, with 76 percent feeling that recent immigration has "about the same effect" as immigrants from past years.
- ↑ "Poll Results | IGM Forum". www.igmchicago.org. Retrieved January 17, 2016.
- ↑ "Poll Results | IGM Forum". www.igmchicago.org. Retrieved January 17, 2016.
- ↑ "The Immigration Debate / Effect on Economy". San Francisco Chronicle. May 21, 2006. Retrieved April 25, 2012.
- ↑ James p. Smith, Chair. The New Americans: Economic, Demographic, and Fiscal Effects of Immigration (1997) Commission on Behavioral and Social Sciences and Education (CBASSE), National Academy of Sciences. page 5
- ↑ "The Impact of Unauthorized Immigrants on the Budgets of State and Local Governments (December 2007)". /Congress of the United States Congressional Budget Office.
- ↑ "Cost of Illegal Immigrants". FactCheck.org. April 6, 2009.
- ↑ Lowenstein, Roger. "The Immigration Equation." The New York Times July 9, 2006.<http://www.nytimes.com/2006/07/09/magazine/09IMM.html>
- ↑ "Hispanic Heritage Month Sept. 15 – Oct. 15, 2006" (Press Release). Facts for Features. September 5, 2006. Retrieved March 16, 2015.
- ↑ Smith (1997) 7,8
- ↑ Perez, Miguel (2006) "Hire education: Immigrants aren't taking jobs from Americans" Chicago Sun-Times August 22, 2006, available here
- ↑ Brookings Institution, Rationalizing U.S. Immigration Policy: Reforms for Simplicity, Fairness, and Economic Growth, May 2012
- ↑ "Manhattan's Chinatown Pressured to Sell Out". The Washington Post. May 21, 2005.
- ↑ "CATO Institute Finds $180 Billion Benefit to Legalizing Illegal Immigrants".
- ↑ Riley, Jason. Let Them In: The Case for Open Borders. p. 95. ISBN 978-1-59240-349-3.
- ↑ "Immigration" (PDF). Retrieved April 25, 2012.
- ↑ Kusum Mundra (October 18, 2010). "Immigrant Networks and U.S. Bilateral Trade: The Role of Immigrant Income". papers.ssrn. SSRN 1693334
 .
. ... this paper finds that the immigrant network effect on trade flows is weakened by the increasing level of immigrant assimilation.
- ↑ "Council of Economic Advisers | The White House" (PDF). Whitehouse.gov. Retrieved April 25, 2012.
- ↑ Elstrom, Peter (June 7, 2007). "Immigration: Google Makes Its Case". Bloomberg BusinessWeek. Retrieved April 25, 2012.
- ↑ Smith (1997) page 6
- ↑ Samuelson, Robert (2007) "Importing poverty" Washington Post, September 5, 2007 (Accessible as of September 12, 2007, here )
- ↑ "Center for Immigration Studies". Cis.org. Retrieved April 25, 2012.
- ↑ Rosenzweig, Paul. "Importing Poverty: Immigration and Poverty in the United States: A Book of Charts". Heritage.org. Retrieved April 25, 2012.
- ↑ "Fazlur R. Khan". Council on Tall Buildings and Urban Habitat. Retrieved May 21, 2014.
- ↑ "Sears Tower - Fazlur Khan - Structural Artist of Urban Building Forms". Retrieved May 21, 2014.
- ↑ "Willis Tower - The Skyscraper Center". Council on Tall Buildings and Urban Habitat.
- ↑ "Compliance Assistance By Audience - Foreign Labor". US Department of Labor.
- ↑ "Season-Long Strawberry Production with Everbearers for Northeastern Producers" (PDF). Sustainable Agriculture Research and Education Program.
- ↑ "Temporary Worker". US Department of Homeland Security.
- ↑ "Forced Labor in the Global Economy" (PDF). Massachusetts Institute of Technology Center for International Studies.
- ↑ Garcia, Adriana (January 30, 2008). "Immigrants hit hard by slowdown, subprime crisis". Reuters. Retrieved April 25, 2012.
- ↑ Banks help illegal immigrants own their own home, CNN/Money, August 8, 2005
- ↑ HUD: Five Million Fraudulent Mortgages Held by Illegals Archived March 7, 2016, at the Wayback Machine.
- ↑ "KFYI – "The Valley's Talk Station"". Kfyi.com. Retrieved April 25, 2012.
- ↑ Sunnucks, Mike (October 9, 2008). "HUD cries foul over illegal immigrant mortgage data".
- ↑ "Report to Congressional Requesters: January 2009:". United States Government Accountability Office.
- 1 2 The Congealing Pot—Today's Immigrants Are Different from Waves Past, Jason Richwine, National Review, August 24, 2009. http://www.aei.org/article/100860
- ↑ "/ Black Asian women make income gains". MSNBC. March 27, 2005
- ↑ Gabriel J. Chin. "/ The Civil Rights Revolution Comes to Immigration Law: A New Look at the Immigration and Nationality Act of 1965" (1996–1997). Social Science Research Network. Retrieved July 17, 2011.
- ↑ "Income, Poverty, and Health Insurance Coverage in the United States: 2008". U.S. Census Bureau, 2009. P. 8.
- ↑ "Study Details Lives of Illegal Immigrants in U.S.". NPR. June 14, 2005.
- ↑ "H-2A Temporary Agricultural Workers". U.S. Citizenship and Immigration Services.
- ↑ "Georgia General Assembly: HB 87 – Illegal Immigration Reform and Enforcement Act of 2011". .legis.ga.gov. Retrieved April 25, 2012.
- ↑ Guardian newspaper: Kansas prepares for clash of wills over future of unauthorised immigrants – Coalition of top [Kansas] businesses launch new legislation that would help undocumented Hispanics gain federal work permission. February 2, 2012
- ↑ Jonathan V. Last (February 12, 2013). "America's Baby Bust". WSJ. Retrieved April 19, 2016.
- ↑ Bedard, Paul (April 23, 2015). "Congress: Middle class incomes drop as immigration surges". Washington Examiner. Retrieved April 27, 2015.
- ↑ PBS Newshour, "Juan Williams Firing: What Speech Is OK as Journalism Evolves?" Oct. 22, 2010 online
- ↑ Ofari, Earl (November 25, 2007). "The black-Latino blame game". Los Angeles Times. Retrieved April 25, 2012.
- ↑ Quinones, Sam (October 18, 2007). "Gang rivalry grows into race war". Los Angeles Times. Retrieved April 25, 2012.
- ↑ "Racial Tension Rising in Dallas Against Korean Community". The Chosun Ilbo. January 31, 2012.
- ↑ "Race relations | Where black and brown collide". The Economist. August 2, 2007. Retrieved April 25, 2012.
- ↑ "Riot Breaks Out At Calif. High School, Melee Involving 500 People Erupts At Southern California School". Cbsnews.com. Retrieved April 25, 2012.
- ↑ "JURIST – Paper Chase: Race riot put down at California state prison". Jurist.law.pitt.edu. December 31, 2006. Archived from the original on March 7, 2010. Retrieved April 25, 2012.
- ↑ Racial segregation continues in California prisons Archived August 23, 2011, at the Wayback Machine.
- ↑ Paul Harris (March 18, 2007). "A bloody conflict between Hispanic and black American gangs is spreading across Los Angeles". London: Observer.guardian.co.uk. Archived from the original on July 9, 2008. Retrieved April 25, 2012.
- ↑ Hutchinson, Earl Ofari (January 5, 2007). "The Hutchinson Report: Thanks to Latino Gangs, There's a Zone in L.A. Where Blacks Risk Death if They Enter". blackamericaweb.com. Black America Web. Archived from the original on January 17, 2007. Retrieved March 16, 2015.
- ↑ Dyer, Ervin (December 31, 1969). "African immigrants face bias from blacks". Post-gazette.com. Retrieved April 25, 2012.
- ↑ Mexican Assimilation in the United States, Edward P. Lazear. In Mexican Immigration to the United States, George J. Borjas, University of Chicago Press, 2007, National Bureau of Economic Research
- ↑ Charles H. Lippy, Faith in America: Organized religion today (2006) ch 6 pp 107–27
- ↑ "The Religious Affiliation of U.S. Immigrants: Majority Christian, Rising Share of Other Faiths". Pew Research Center. May 17, 2013. Archived from the original on August 5, 2013.
- ↑ Page, Susan (June 29, 2007). "Hispanics turning back to Democrats for 2008 –". USA Today. Retrieved April 25, 2012.
- ↑ Fung, Margaret (November 9, 2006). "AALDEF Exit Poll of 4,600 Asian American Voters Reveals Robust Support for Democratic Candidates in Key Congressional and State Races". aaldef.org. American Legal Defense and Education Fund. Archived from the original on August 7, 2007. Retrieved March 16, 2015.
- ↑ "USC Knight Chair in Media and Religion". Uscmediareligion.org. September 16, 2008. Retrieved April 25, 2012.
- ↑ Giovanni Facchini, Anna Maria Mayda and Prachi Mishra, "Do Interest Groups affect US Immigration Policy?" December 2, 2010 online
- ↑ Facchini, Giovanni, Mayda, Anna Maria and Mishra, Prachi, Do Interest Groups Affect Immigration? (November 2007). IZA Discussion Paper No. 3183. Available at SSRN: http://ssrn.com/abstract=1048403
- ↑ Facchini, G.; Steinhardt, M. F. (2011). "What drives U.S. Immigration policy? Evidence from congressional roll call votes". Journal of Public Economics. 95 (7–8): 734. doi:10.1016/j.jpubeco.2011.02.008.
- ↑ "Polling And Experts Make Clear: Latino Voters Showed Up & Saved The Senate For The Democrats". Nclr.org. November 4, 2010. Retrieved April 25, 2012.
- ↑ An Irish Face on the Cause of Citizenship, Nina Bernstein, March 16, 2006, The New York Times.
- ↑ National Council of La Raza, Issues and Programs » Immigration » Immigration Reform, "Archived copy". Archived from the original on April 13, 2011. Retrieved April 19, 2011.
- ↑ Loaded rhetoric harms immigration movement, Bridget Johnson, USA Today, February 5, 2006
- ↑ Mexican aliens seek to retake 'stolen' land, The Washington Post, April 16, 2006.
- ↑ Ethnic Lobbies and US Foreign Policy, David M. Paul and Rachel Anderson Paul, 2009, Lynne Rienner Publishers
- ↑ "Hispanic vote tilts strongly to Obama in win," Reuters, November 7, 2012.
- ↑ Peter Wallsten (November 17, 2012). "New super PAC hopes to give cover to pro-immigration Republicans". Washington Post.
- ↑ "New Mexico Gov. Susana Martinez: Comments like Romney's set 'us back as a party'", Yahoo News, November 15, 2012
- ↑ Brown, Richard, et al. (1998) "Access to Health Insurance and Health Care for Mexican American Children in Immigrant Families" In Marcelo M. Suarez-Orozco, ed. Crossings: Mexican Immigration in Interdisciplinary Perspectives. Cambridge, Mass.: David Rockefeller Center for Latin American Studies and Harvard University Press pages 225–247
- ↑ in fact, Simon, Juliana (1995) "Immigration: The Demographic and Economic Facts". Washington, D.C.: The Cato Institute and National Immigration Forum (available here "Archived copy". Archived from the original on July 1, 2010. Retrieved July 1, 2010.) finds that estimates of the cost of public health care provided to undocumented immigrants that have been used by the press have been extremely inflated
- ↑ Simon (1995)
- ↑ National Institutes of Health. Medical Encyclopedia Accessed September 25, 2006
- ↑ Tuberculosis in the United States, 2004 Archived April 23, 2009, at the Wayback Machine.
- ↑ "CDC - Tuberculosis (TB)". Retrieved April 19, 2016.
- ↑ "Tuberculosis among US Immigrants". Cdc.gov. Retrieved April 25, 2012.
- ↑ Dunham, Will (October 29, 2007). "AIDS virus invaded U.S. from Haiti: study". Reuters. Retrieved April 25, 2012.
- ↑ Bowdler, Neil (October 30, 2007). "Key HIV strain 'came from Haiti'". BBC News. Retrieved April 25, 2012.
- ↑ "Mexican Migrants Carry H.I.V. Home". The New York Times. July 17, 2007. Retrieved April 19, 2016.
- ↑ "Lifting Of HIV Ban Leaves Many Immigrants In Limbo". NPR. October 10, 2009. Retrieved April 25, 2012.
- ↑ "What Happens to the "Healthy Immigrant Effect"". Retrieved April 25, 2012.
- ↑ notably, National Research Council. (1997) "From Generation to Generation: The Health and Well-Being of Children in Immigrant Families". Washington D.C.: National Academy Press (Available here )
- ↑ see Waters, Tony, Crime and Immigrant Youth, Sage Publications 1999.
- ↑ "Molokan NEWS -- Tony Waters thesis: "Crime and Immigrant Youth"". Retrieved April 19, 2016.
- ↑ John Hagan, Alberto Palloni. Sociological Criminology and the Mythology of Hispanic Immigration and Crime. Social Problems, Vol. 46, No. 4 (Nov. 1999), pp. 617–632
- ↑ Sampson, Robert (March 11, 2006). "Open Doors Don't Invite Criminals". New York Times (Op-Ed).
- ↑ Sampson, Robert J. (2008). "Rethinking crime and immigration". Contexts. Retrieved April 9, 2016.
- ↑ STOWELL, JACOB I.; MESSNER, STEVEN F.; MCGEEVER, KELLY F.; RAFFALOVICH, LAWRENCE E. (August 2009). "IMMIGRATION AND THE RECENT VIOLENT CRIME DROP IN THE UNITED STATES: A POOLED, CROSS-SECTIONAL TIME-SERIES ANALYSIS OF METROPOLITAN AREAS". Criminology. 47 (3): 889–928. doi:10.1111/j.1745-9125.2009.00162.x.
- ↑ Wadsworth, Tim (June 1, 2010). "Is Immigration Responsible for the Crime Drop? An Assessment of the Influence of Immigration on Changes in Violent Crime Between 1990 and 2000*". Social Science Quarterly. 91 (2): 531–553. doi:10.1111/j.1540-6237.2010.00706.x. ISSN 1540-6237.
- ↑ Miles, Thomas J.; Cox, Adam B. (November 1, 2014). "Does Immigration Enforcement Reduce Crime? Evidence from Secure Communities". The Journal of Law and Economics. 57 (4): 937–973. doi:10.1086/680935. ISSN 0022-2186.
- ↑ Baker, Scott R. "Effects of Immigrant Legalization on Crime †". American Economic Review. 105 (5): 210–213. doi:10.1257/aer.p20151041.
- ↑ Ousey, Graham C.; Kubrin, Charis E. (August 2009). "Exploring the Connection between Immigration and Violent Crime Rates in U.S. Cities, 1980–2000". Social Problems. 56 (3): 447–473. doi:10.1525/sp.2009.56.3.447.
- ↑ Migration Information Source: "Debunking the Myth of Immigrant Criminality: Imprisonment Among First- and Second-Generation Young Men" June 2006.
- ↑ Rumbaut G. Ruben and Ewing A. Walter, The Myth of Immigrant Criminality and the Paradox of Assimilation,
- ↑ California Public Policy Institute: "Crime Corrections, and California – What does immigration have to do with it" February 2008.
- ↑ Preston, Julia (February 26, 2008). "California: Study of Immigrants and Crime". The New York Times. Retrieved May 5, 2010.
- 1 2 Immigration and Crime Assessing a Conflicted Issue, Steven A. Camarota and Jessica M. Vaughan, November 2009, http://web.archive.org/web/20091128010010/http://www.cis.org/articles/2009/crime.pdf
- ↑ Butcher, Kristin F.; Piehl, Anne Morrison (July 2007). "Why are Immigrants' Incarceration Rates so Low? Evidence on Selective Immigration, Deterrence, and Deportation". NBER working paper.
- ↑ Heather Mac Donald (September 5, 2001). "The Illegal-Alien Crime Wave by Heather Mac Donald, City Journal Summer 2004". City-journal.org. Retrieved April 25, 2012.
- ↑ Overpopulation and Over-Immigration Threaten Water Supply, Says Ad Campaign, Reuters, October 20, 2008
- ↑ "The Environmental Impact Of Immigration Into The United States". Carryingcapacity.org. Retrieved April 25, 2012.
- ↑ See, for instance, immigration reform group Federation for American Immigration Reform's page on Immigration & U.S. Water Supply
- ↑ A World Without Water -Global Policy Forum- NGOs Archived July 12, 2007, at the Wayback Machine.
- ↑ "Immigration & U.S. Water Supply". Fairus.org. April 23, 2010. Retrieved April 25, 2012.
- ↑ "State looks to the sea for drinkable water". Contracostatimes.com. Retrieved April 25, 2012.
- ↑ Michael Crane (2004). The Political Junkie. SP Books. p. 319.
- ↑ Rymer, Nataliya (March 17, 2014). "Leaders in Higher Education Call for Immigration Reform". The National Law Review. Greenberg Traurig, LLP. ISSN 2161-3362. Retrieved June 15, 2014.
- ↑ Foley, Elise (February 3, 2014). "The Man Who Kept Immigration Reform Alive". The Huffington Post. Retrieved June 15, 2014.
- ↑ "Education May Boost Fortunes of Second-Generation Latino Immigrants ". Pew Hispanic Center.
- ↑ David J. Lynch and Chris Woodyard, USA Today, April 11, 2006. Immigrants Claim Pivotal Role in Economy.
- ↑ Borjas, G. J.; Grogger, J.; Hanson, G. H. (2010). "Immigration and the Economic Status of African-American Men". Economica. 77 (306): 255–282. doi:10.1111/j.1468-0335.2009.00803.x.
- ↑ Mary E. Williams, Immigration. (San Diego: GreenHaven Press, 2004). Page 85.
- ↑ Rita James Simon and Mohamed Alaa Abdel-Moneim, Public opinion in the United States: studies of race, religion, gender, and issues that matter (2010) pp 61–2
- ↑ "Worldviews 2002 Survey of American and European Attitudes and Public Opinion on Foreign Policy: US Report" Archived August 2, 2014, at the Wayback Machine.
- ↑ New Poll Shows Immigration High Among US Voter Concerns
- 1 2 "Summary" (PDF). Retrieved April 25, 2012.
- ↑ Espenshade, Thomas J. and Belanger, Maryanne (1998) "Immigration and Public Opinion." In Marcelo M. Suarez-Orozco, ed. Crossings: Mexican Immigration in Interdisciplinary Perspectives. Cambridge, Mass.: David Rockefeller Center for Latin American Studies and Harvard University Press, pages 365–403
- ↑ "Legal vs. Illegal Immigration". Public Agenda. December 2007.
- ↑ "First of 60,000 refugees from Bhutan arrive in U.S". CNN. March 25, 2008.
- ↑ "Asylum Trends 2014" (PDF). UNHCR. Retrieved June 17, 2015.
- ↑ "Refugees in Japan". Japan Times. October 12, 2008. Retrieved January 16, 2011.
- ↑ "Refugee Admissions Program for East Asia" (PDF). Bureau of Population, Refugees and Migration. Archived from the original (PDF) on May 28, 2011. Retrieved March 16, 2015.
- ↑ "A New Era Of Refugee Resettlement". Ilw.com. October 11, 2006. Retrieved April 25, 2012.
- ↑ "Presidential Determination on FY 2008 Refugee Admissions Numbers". Antaoandchuang.com. Retrieved April 25, 2012.
- ↑ U.S. Goals for Iraqi Refugees are Inadequate, Refugees International
- ↑ "Resettlement programme for refugees from Bhutan passes 50,000 mark". UNHCR. August 17, 2011
- ↑ "Office of Refugee Resettlement: Programs". United States Department of Health and Human Services.
- ↑ David W. Haines, Safe Haven?: A History of Refugees in America (2010) p 177
- ↑ Edwin T. Gania. U.S. Immigration Step by Step (2004) p 65
- ↑ Immigration and Nationality Act, Section 240A online
- ↑ Ivan Vasic, The Immigration Handbook (2008) p. 140
- ↑ Brad Knickerbocker (May 16, 2006). "Illegal immigrants in the US: How many are there?". The Christian Science Monitor.
- ↑ Study Details Lives of Illegal Immigrants in U.S., NPR
- ↑ "Illegal immigration in U.S. stabilizes". Los Angeles Times. February 2, 2011.
- ↑ "Obama is ready to sign up immigrants". The Washington Times. August 14, 2012.
- ↑ "Illegal immigration: agents sue to block Obama's 'DREAM Act'". CSM. August 23, 2012.
- ↑ "White House eases path to residency for some illegal immigrants". Los Angeles Times. January 2, 2013.
- ↑ Archived December 3, 2013, at the Wayback Machine.
- ↑ Richman, Josh (November 25, 2013). "Obama's immigration speech in deep-blue San Francisco interrupted by anti-deportation hecklers". San Jose Mercury News. Retrieved March 16, 2015.
- ↑ "Heckler Disrupts Obama's Speech With Minute-Long Rant". ABC News. American Broadcasting Company. Retrieved March 16, 2015.
- ↑ Stevenson, David (November 25, 2013). "Obama addresses heckler during speech on immigration". Dayton Daily News. Retrieved March 16, 2015.
- ↑ New York Times, "Obama's Immigration Decision Has Precedents, but May Set a New One" (November 20, 2014, retrieved November 21, 2014)
- ↑ "Policy Memorandum" (PDF). November 15, 2013. Retrieved June 2, 2015.
- 1 2 York, Harlan (November 15, 2013). ""Parole in Place" for Immigrant Relatives of Military-What To Know". Retrieved June 4, 2015.
- ↑ James H. Dormon, "Ethnic Stereotyping in American Popular Culture: The Depiction of American Ethnics in the Cartoon Periodicals of the Gilded Age," Amerikastudien, 1985, Vol. 30 Issue 4, pp 489–507
- ↑ Rachel Rupin and Jeffrey Melnick, 'Immigration and American Popular Culture: An Introduction (2006)
- ↑ James H. Dorman, "American Popular Culture and the New Immigration Ethnics: The Vaudeville Stage and the Process of Ethnic Ascription," Amerikastudien, 1991, Vol. 36#2 pp 179–193
- ↑ Yasmeen Abu-Laban and Victoria Lamont, "Crossing borders: Interdisciplinary, immigration and the melting pot in the American cultural imaginary," Canadian Review of American Studies, 1997, Vol. 27#2, pp 23–43
- ↑ Michael Rogin, Blackface White Noise: Jewish Immigrants in the Hollywood Melting Pot (1996)
- ↑ Michael Frontani, "'From the Bottom to the Top': Frank Sinatra, the American Myth of Success, and the Italian-American Image," Journal of American Culture, June 2005, Vol. 28 Issue 2, pp 216–230
- ↑ William H. A. Williams, "Green Again: Irish-American Lace-Curtain Satire," New Hibernia Review, Winter 2002, Vol. 6 Issue 2, pp 9–24
- ↑ Kerry Soper, "Performing 'Jiggs': Irish Caricature and Comedic Ambivalence Toward Assimilation and the American Dream in George Mcmanus's 'Bringing Up Father'", Journal of the Gilded Age and Progressive Era, April 2005, Vol. 4#2, pp 173–213,
- ↑ David R. Maciel and María Herrera-Sobek, Culture across Borders: Mexican Immigration and Popular Culture (1998)
- ↑ Thomas J. Ferraro, Ethnic Passages: Literary Immigrants in Twentieth-Century America (1993)
- ↑ Eva Roa White, "Emigration as Emancipation: Portrayals of the Immigrant Irish Girl in Nineteenth-Century Fiction," New Hibernia Review, Spring 2005, Vol. 9 Issue 1, pp 95–108
- ↑ Miran Hladnik, "Slovene Popular Novels about Emigration in the Nineteenth Century," Slovene Studies, 1985, Vol. 7 Issue 1/2, pp 57–62
- ↑ Thomas J. Ferraro, "'Working ourselves up' in America: Anzia Yezierska's Bread Givers", South Atlantic Quarterly, Summer 19 90, Vol. 89 Issue 3, pp 547–91. reprinted in Ferraro, Ethnic Passages, pp 53–86
- ↑ Helmer Lång, and Michael Brook, "Moberg, the Emigrant Saga and Reality," Swedish Pioneer Historical Quarterly, 1972, Vol. 23 Issue 1, pp 3–24
- ↑ Philip J. Anderson, "Introduction to Vilhelm Moberg's 'Why I Wrote the Novel about Swedish Emigrants'", Swedish-American Historical Quarterly, July 2008, Vol. 59#3 pp 137–144
- ↑ Roger McKnight, "Vilhelm Moberg, the Emigrant Novels, and their Changing Readers," Swedish-American Historical Quarterly, July 1998, Vol. 49 Issue 3, pp 245–256
- ↑ A NOTE FROM THE BOOKWRITER. The Immigrant
- ↑ in Current Affairs, Film (May 3, 2010). "Immigrationprof Blog: Acclaimed Political Documentary Series 'How Democracy Works Now' Announces Washington D.C. Screenings". Lawprofessors.typepad.com. Retrieved September 22, 2011.
- ↑ Hiroshi Motomura. Americans in Waiting: The Lost Story of Immigration and Citizenship in the United States (2006)
- ↑ Gabor S. Boritt, Lincoln and the Economics of the American Dream (1994) p. 1
- ↑ Elizabeth Baigent, "Swedish immigrants in McKeesport, Pennsylvania: Did the Great American Dream come true?" Journal of Historical Geography, April 2000, Vol. 26 Issue 2, pp 239–72
- ↑ Jim Cullen, The American Dream : A Short History of an Idea that Shaped a Nation. 2004. ISBN 0-19-517325-2.
Further reading
Surveys
- Archdeacon, Thomas J. Becoming American: An Ethnic History (1984)
- Bankston, Carl L. III and Danielle Antoinette Hidalgo, eds. Immigration in U.S. History Salem Press, (2006)
- Barkan, Elliott Robert, ed. (2001). Making it in America: A Sourcebook on Eminent Ethnic Americans. ABC-CLIO., short scholarly biographies With bibliographies; 448pp
- Bodnar, John. The Transplanted: A History of Immigrants in Urban America Indiana University Press, (1985)
- Daniels, Roger. Asian America: Chinese and Japanese in the United States since 1850 University of Washington Press, (1988)
- Daniels, Roger. Coming to America 2nd ed. (2005)
- Daniels, Roger. Guarding the Golden Door : American Immigration Policy and Immigrants since 1882 (2005)
- Diner, Hasia. The Jews of the United States, 1654 to 2000 (2004)
- Gerber, David A. American Immigration: A Very Short Introduction (2011).
- Gjerde, Jon, ed. Major Problems in American Immigration and Ethnic History (1998).
- Glazier, Michael, ed. The Encyclopedia of the Irish in America (1999).
- Parker, Kunal M. Making Foreigners: Immigration and Citizenship Law in America, 1600-2000. New York: Cambridge University Press, 2015.
- Sowell, Thomas. Ethnic America: A History (1981).
- Thernstrom, Stephan, ed. Harvard Encyclopedia of American Ethnic Groups (1980).
Before 1920
- Alexander, June Granatir. Daily Life in Immigrant America, 1870–1920: How the Second Great Wave of Immigrants Made Their Way in America (Chicago: Ivan R. Dee, 2007. xvi, 332 pp.)
- Berthoff, Rowland Tappan. British Immigrants in Industrial America, 1790–1950 (1953).
- Briggs, John. An Italian Passage: Immigrants to Three American Cities, 1890–1930 Yale University Press, (1978)
- Diner, Hasia. Hungering for America: Italian, Irish, and Jewish Foodways in the Age of Migration (2003)
- Eltis, David; Coerced and Free Migration: Global Perspectives (2002) emphasis on migration to Americas before 1800
- Greene, Victor R. A Singing Ambivalence: American Immigrants Between Old World and New, 1830–1930 (2004), coving musical traditions
- Isaac Aaronovich Hourwich. Immigration and Labor: The Economic Aspects of European Immigration to the United States (1912) (full text online)
- Joseph, Samuel; Jewish Immigration to the United States from 1881 to 1910 Columbia University Press, (1914)
- Kulikoff, Allan; From British Peasants to Colonial American Farmers (2000), details on colonial immigration
- Meagher, Timothy J. The Columbia Guide to Irish American History. (2005)
- Miller, Kerby M. Emigrants and Exiles (1985), influential scholarly interpretation of Irish immigration
- Motomura, Hiroshi. Americans in Waiting: The Lost Story of Immigration and Citizenship in the United States (2006), legal history
- Pochmann, Henry A. and Arthur R. Schultz; German Culture in America, 1600–1900: Philosophical and Literary Influences (1957)
- Waters, Tony. Crime and Immigrant Youth Sage Publications (1999), a sociological analysis.
- U.S. Immigration Commission, Abstracts of Reports, 2 vols. (1911); the full 42-volume report is summarized (with additional information) in Jeremiah W. Jenks and W. Jett Lauck, The Immigrant Problem (1912; 6th ed. 1926)
- Wittke, Carl. We Who Built America: The Saga of the Immigrant (1939), covers all major groups
- Yans-McLaughlin, Virginia ed. Immigration Reconsidered: History, Sociology, and Politics Oxford University Press. (1990)
Recent: post 1965
- Beasley, Vanessa B. ed. Who Belongs in America?: Presidents, Rhetoric, And Immigration (2006)
- Bogen, Elizabeth. Immigration in New York (1987)
- Bommes, Michael and Andrew Geddes. Immigration and Welfare: Challenging the Borders of the Welfare State (2000)
- Borjas, George J. ed. Issues in the Economics of Immigration (National Bureau of Economic Research Conference Report) (2000).
- Borjas, George. Friends or Strangers (1990)
- Borjas, George J. "Welfare Reform and Immigrant Participation in Welfare Programs" International Migration Review 2002 36(4): 1093–1123.
- Briggs, Vernon M., Jr. Immigration Policy and the America Labor Force. Baltimore, MD: Johns Hopkins University Press, 1984.
- Briggs, Vernon M., Jr. Mass Immigration and the National Interest (1992)
- Cooper, Mark A. Moving to the United States of America and Immigration. 2008.
- Fawcett, James T., and Benjamin V. Carino. Pacific Bridges: The New Immigration from Asia and the Pacific Islands . New York: Center for Migration Studies, 1987.
- Foner, Nancy. In A New Land: A Comparative View Of Immigration (2005)
- Garland, Libby. After They Closed the Gate: Jewish Illegal Immigration to the United States, 1921-1965. Chicago: University of Chicago Press, 2014.
- Levinson, David and Melvin Ember, eds. American Immigrant Cultures 2 vol (1997).
- Lowe, Lisa. Immigrant Acts: On Asian American Cultural Politics (1996)
- Meier, Matt S. and Gutierrez, Margo, eds. The Mexican American Experience : An Encyclopedia (2003) (ISBN 0-313-31643-0)
- Mohl, Raymond A. "Latinization in the Heart of Dixie: Hispanics in Late-twentieth-century Alabama" Alabama Review 2002 55(4): 243–274. ISSN 0002-4341
- Portes, Alejandro, and Robert L. Bach. Latin Journey: Cuban and Mexican Immigrants in the United States. Berkeley, CA: University of California Press, 1985.
- Portes, Alejandro, and Jozsef Borocz. "Contemporary Immigration: Theoretical Perspectives on Its Determinants and Modes of Incorporation." International Migration Review 23 (1989): 606–30.
- Portes, Alejandro, and Ruben Rumbaut. Immigrant America. Berkeley, CA: University of California Press, 1990.
- Reimers, David. Still the Golden Door: The Third World Comes to America. New York: Columbia University Press, (1985).
- Smith, James P, and Barry Edmonston, eds. The Immigration Debate: Studies on the Economic, Demographic, and Fiscal Effects of Immigration (1998), online version
- Waters, Tony Crime and Immigrant Youth Thousand Oaks: Sage 1999.
- Zhou, Min and Carl L. Bankston III Growing Up American: How VIetnamese Children Adapt to Life in the United States Russell Sage Foundation. (1998)
- Borjas, George J. Heaven's Door: Immigration Policy and the American Economy. Princeton, N.J.: Princeton University Press, 1999. xvii, 263 p. ISBN 0-691-05966-7
- Lamm, Richard D., and Gary Imhoff. The Immigration Time Bomb: the Fragmenting of America, in series, Truman Talley Books. First ed. New York: E.P. Dutton, 1985. xiii, 271 p. ISBN 0-525-24337-2
External links
History
- Immigrant Servants Database
- Asian-Nation: Early Asian Immigration to the U.S.
- Irish Catholic Immigration to America
- Scotch-Irish Immigration to Colonial America
- Immigration Archives of Historical Documents, Articles, and Immigrants
Immigration policy
- Brookings Institution: Immigration Policy
- Urban Institute: Immigration Studies
- The Real Political Purpose of the ICE Raids from Dollars & Sense
- Federation for American Immigration Reform
Current immigration
- U.S. Citizenship and Immigration Services
- U.S. Immigration and Customs Enforcement
- Cornell University's Legal Information Institute: Immigration
- Yearbook of Immigration Statistics – United States Department of Homeland Security, Office of Immigration Statistics 2004, 2005 editions available.
- "Estimates of the Unauthorized Immigrant Population Residing in the United States: January 2005" M. Hoefer, N. Rytina, C. Campbell (2006) "Population Estimates (August). U.S. Department of Homeland Security, Office of Immigration Statistics.
Films about immigration
- How Democracy Works Now: Twelve Stories (2010)
- Well-Founded Fear (1999)
Economic impact
- Immigration in American Economic History by Ran Abramitzky and Leah Platt Boustan, NBER Working Paper No. 21882, January 2016
- The New Political Economy of Immigration by Tom Barry in Dollars & Sense magazine, January/February 2009
- Immigrants and the Labor Market from Dollars & Sense magazine, May/June 2006
- Immigrants in Black & White: A Review of "Communities Without Borders", The Indypendent, Susan Chenelle
- Immigration, Numbers, NumbersUSA: For Lower Immigration Levels
- Immigration, World Poverty and Gumballs - Updated 2010 - YouTube (6:07)