Educational attainment in the United States


The educational attainment of the U.S. population is similar to that of many other industrialized countries with the vast majority of the population having completed secondary education and a rising number of college graduates that outnumber high school dropouts. As a whole, the population of the United States is spending more years in formal educational programs. As with income, levels differ by race, age, household configuration and geography.[2]
Overall the households and demographics featuring the highest educational attainment in the United States are also among those with the highest household income and wealth. Thus, while the population as a whole is proceeding further in formal educational programs, income and educational attainment remain highly correlated.[2]
General attainment of degrees/diplomas
| Education | Age 25 and over | Age 25-29 |
|---|---|---|
| High school diploma | 88.31% | 90.83% |
| Some college | 58.57% | 64.31% |
| Associate and/or bachelor's degree | 41.89% | 44.08% |
| Bachelor's degree | 31.96% | 34.04% |
| Master's and/or doctorate and/or professional degree | 11.77% | 7.57% |
| Doctorate and/or professional degree | 3.27% | 1.70% |
| Doctorate | 1.77% | 0.89% |
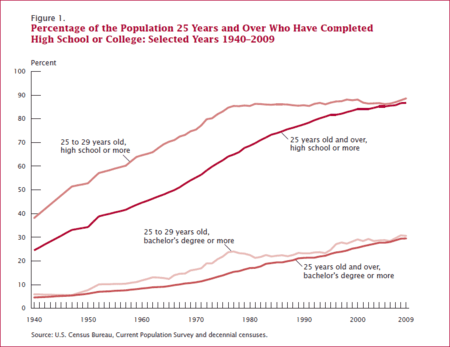
In 2003, over four-fifths (85 percent) of all adults 25 years or older reported they had completed at least high school; over one in four adults (27 percent) had attained at least a bachelor’s degree; both measures are all time highs. In 2003, the percentage of the adult population who had completed high school increased for the first time since 2000, when it was 84 percent. This increase follows a general trend that the Current Population Survey has shown since educational attainment was first measured in 1947.[2]
In 2015, among adults aged 65 and older, 84 percent had completed high school or more education compared to 91 percent of adults aged 25 to 34 and 89 percent of adults aged 35 to 44 years or 45 to 64 years. In addition, 27 percent of the population aged 65 and older reported a bachelor’s degree or more education compared to 36 percent of adults 25 to 34 years old and 32 percent of adults aged 45 to 64 years. [4]
Since 1983 the percentage of people graduating from high school has increased from 85% to 88%. The greatest increases in educational attainment were documented in the 1950s, 60s and 70s. In the 1950s and much of the 1960s high school graduates constituted about 50% of those considered adults (25 and above). For young adults aged between 25 and 29, the percentage of high school graduates was roughly 50% in 1950 versus 90% today.[2]
Gender
For the past fifty years, there has been a gap in the educational achievement of males and females in the United States, but which gender has been disadvantaged has fluctuated over the years. In the 1970s and 1980s, data showed girls trailing behind boys in a variety of academic performance measures, specifically in test scores in math and science.[5]

Data in the last twenty years shows the general trend of girls outperforming boys in academic achievement in terms of class grades across all subjects and college graduation rates, but boys scoring higher on standardized tests and being better represented in the higher-paying and more prestigious STEM fields (science, technology, engineering, and math).[5]
Gender gap in literacy
Traditionally, girls have outperformed boys in reading and writing. Although this gap may be minimal in kindergarten, it grows as students continue their education. According to the 2004 National Reading Assessment measured by the US Department of Education, the gap between boys and girls, only slightly noticeable in 4th grade, left boys 14 points behind girls during their 12th grade year.[6] On the 2008 test, female students continued to have higher average reading scores than male students at all three ages. The gap between male and female 4th graders was 7 points in 2008. By 12th grade, there was an 11-point gap between males and females.[6]
On the 2002 National Writing Assessment, boys scored on average 17 points lower than girls in 4th grade. The average gap increased to 21 points by 8th grade and widened to 24 points by senior year in high school.[7] In the more recent 2007 National Assessment of Writing Skills, female students continued to score higher than male students, though margins closed slightly from previous assessments. The average score for female eighth-graders was 20 points higher than males, down 1 point from the 2002 score. For twelfth-graders, females outscored males by 18 points as opposed to 24 points in 2002.[8]
All of these assessments were conducted on a 100-point scale.[6][7][8]
Graduation rates
Overall, women have surpassed men in terms of completing secondary and post-secondary education with the gender gap almost completely reversed. In 2006, 10.3% of males and 8.3% of females dropped out of high school.[9] In 2005/2006, women earned 62% of associate degrees, 58% of bachelor's degrees, 60.0% of master's degrees, and 48.9% of Doctorates.[10]
According to recent data, 55 percent of college students are females and 45 percent are males. From 1995 until 2005, the number of males enrolled in college increased by 18 percent, while the number of female students rose by 27 percent.[11] Males are enrolling in college in greater numbers than ever before, yet fewer than two-thirds of them are graduating with a bachelor's degree. The numbers of both men and women receiving a bachelor's degree have increased significantly, but the increasing rate of female college graduates exceeds the increasing rate for males.[12]
In 2007, the United States Census Bureau estimated that 18,423,000 males over the age of 18 held a bachelor's degree, while 20,501,000 females over the age 18 held one. In addition, fewer males held master's degrees: 6,472,000 males compared to 7,283,000 females. However, more men held professional and doctoral degrees than women. 2,033,000 males held professional degrees compared to 1,079,000, and 1,678,000 males had received a doctoral degree compared to 817,000 females.[13]
In 2016/2017, women are projected to earn 64.2% of associate degrees, 59.9% of bachelor's degrees, 62.9% of master's degrees, and 55.5% of Doctorates.[14]
Ethnicity and race
While the educational attainment of all races increased during the 1990s, with the gap between African Americans and non-Hispanic whites decreasing, differences between the races remain, especially among those with a bachelor's degree or higher. Asian Americans had the highest educational attainment of any race, followed by whites who had a higher percentage of high school graduates but a lower percentage of college graduates. Persons identifying as Hispanic or Latino, without regard to race, had the lowest educational attainment. The gap was the largest between foreign-born Asian Americans, over half (50.1%) of whom had a bachelor's degree or higher and foreign-born Hispanics, 9.8% of whom had a four-year college degree.[2]
Hispanics and Latinos also trailed far behind in terms of graduating from high school; it was the only major group for which high school graduates constituted less than 80% of the population. This large inequality might partially be explained thorough the influx of uneducated foreign-born Hispanic Americans who had not been offered the chance to complete secondary education in their home country and who had not completed secondary education in the United States.
Overall nearly half (49.8%) of Asian Americans, nearly a third (30%) of non-Hispanic Whites, 17.3% of non-Hispanic Blacks, and just over a tenth (11.4%) of Hispanics or Latinos had a four-year college degree. The same differences decrease significantly at the high school level with 89.4% of non-Hispanic whites, 87.6% of Asian Americans, 80.0% of African Americans, and 57% of Hispanics or Latinos having graduated from high school.[2]
The Racial achievement gap in the United States refers to these educational disparities between minority students and Caucasian students. Evidence of the racial achievement gap remains present today because not all groups of students are advancing at the same rates. The racial achievement gap has many individual and economic implications and there have been many efforts in education reform to narrow this gap.
Foreign born and immigrants

A trend becomes visible when comparing the foreign-born to the native-born populace of some races. Foreign-born Asian, European, and African immigrants had a higher educational attainment in terms of having earned a four-year college degree than their native-born counterparts. According to the U.S census about 43.8 percent of African immigrants achieved the most college degrees, compared to 42.5 percent of Asian-Americans, 28.9 percent for immigrants from Europe, Russia and Canada and 23.1 percent of the U.S. population as a whole.[15][16][17]
The opposite is true on the high school level and among Hispanics, where the dramatically lower educational attainment of the foreign-born population decreased the educational attainment of the general Hispanophone populace, statistically.[2]
The percentage of the foreign born with a high school diploma (67 percent) was dramatically lower than that of the native population (88 percent), but paradoxically, the percentage with a bachelor's degree was the same (27 percent)... At the bachelor's level, foreign born Blacks and non-Hispanic Whites fared better than their native counterparts. Foreign-born Hispanics, in contrast, had a smaller proportion with a bachelor's degree than the native population... The low educational attainment of foreign-born Hispanics, who compose more than 50 percent of the Hispanic population, contributes to the low attainment levels of the entire Hispanic population.
— US Census Bureau, 2003
Only among Hispanics and Latinos was the proportion of college graduates larger among the native born population. In the general population the proportion of persons with a bachelor's degree or higher was the same among the foreign-born and native-born population (27.2%). As stated above fewer foreign born Americans completed high school than native born Americans. Overall 87.5% of the native born population had graduated from high school, versus 67.2%. Among whites the difference was three percentage points, the same as for African Americans. Among Asian Americans the difference was five percentage points. It was thirty percentage points among Hispanics or Latinos.[2]
African immigrants have been the most highly educated group in the United States since the 1990s.[18][19] This phenomenon is related to the large "brain drain" in Africa.[20]
Income
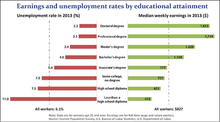
Educational attainment is strongly correlated with income in the United States. Although the incomes of both men and women are associated with higher educational attainment (higher incomes for higher educational attainment), large income gaps linked to race and gender remained at each educational level. In 2003, average incomes ranged from $13,459 for a male high-school dropout to $90,761 for a male with an advanced degree. The most significant average income difference was between those who had some college education or an Associates degree and those who had a Bachelor's degree. While those with some college averaged $31,046, those with a bachelor's degree averaged $51,194, over $20,000 (64.9%) a year more.[2]
The second most dramatic difference in average income was between those with a Bachelor's degree with $51,940 and those with an advanced degree who made $72,824, roughly $21,000 (42.2%) more. The least significant difference was between those who had graduated from high school and those who had either some college or an Associates degree. Here the difference was a mere $3,766 or 13.8%. The difference between those with a high school diploma ($30,000) and those who did not complete high school ($18,826) was $8,454 or 45%. Overall, the income in the United States for all sexes, races and levels of educational attainment was $36,308 annually.[2]
Even though African immigrants have higher educational attainment rates than any other group, they were the hardest hit during the most recent recession beginning in 2007.[16][21][22][23] This shows that race and/or ethnicity may play a role in income levels and job selection.[21]
| Criteria | Overall | Less than 9th grade | High school drop-out | High school graduate | Some college | Associates degree | Bachelor's degree | Bachelor's degree or more | Master's degree | Professional degree | Doctorate degree | |
|---|---|---|---|---|---|---|---|---|---|---|---|---|
| Median individual income | Male, age 25+ | $33,517 | $15,461 | $18,990 | $28,763 | $35,073 | $39,015 | $50,916 | $55,751 | $61,698 | $88,530 | $73,853 |
| Female, age 25+ | $19,679 | $9,296 | $10,786 | $15,962 | $21,007 | $24,808 | $31,309 | $35,125 | $41,334 | $48,536 | $53,003 | |
| Median household income | $45,016 | $18,787 | $22,718 | $36,835 | $45,854 | $51,970 | $68,728 | $73,446 | $78,541 | $100,000 | $96,830 | |
SOURCE: US Census Bureau, 2003[24][25]


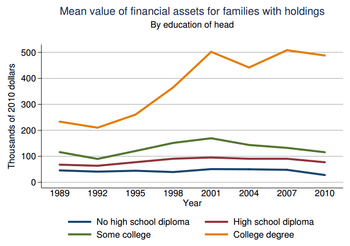
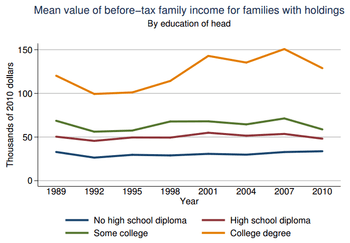
The change in median personal and household income since 1991 also varied greatly with educational attainment. While both the overall median personal and household income increased since 1991, this increase did not take place on all levels of educational attainment. The overall income increased over the course of the 1990s, reaching its high in 1999, but has been decreasing ever since. In 1991 the median household income in the US was $40,873 in 2003 dollars, while the median household income in 2003 was $45,016. In 1999, however, the median household income was $46,236, 2.7% higher than today. While this trend held true for all levels of educational attainment the extent of chorinical fluctuations in income were greatly influenced by educational attainment.[24][25]
Overall the median household and personal income decreased for those with more than a 9th grade education but less than a four-year college degree since 1991. In other words, the median household income decreased for households and individuals at the high school drop-outs and graduate, some-college, and an Associates degree level. Income did, however, increase for those with a Bachelor's degree or more. The following table shows the median household income according to the educational attainment of the householder. All data is in 2003 dollars and only applies to householders whose householder is aged twenty-five or older. The highest and lowest points of the median household income are presented in bold face.[24][25]
| Year | Overall Median | Less than 9th grade | High school drop-out | High school graduate | Some college | Associates degree | Bachelor's degree | Bachelor's degree or more | Master's degree | Professional degree | Doctorate degree |
|---|---|---|---|---|---|---|---|---|---|---|---|
| 1991 | $40,873 | $17,414 | $23,096 | $37,520 | $46,296 | $52,289 | $64,150 | $68,845 | $72,669 | $102,667 | $92,614 |
| 1993 | $40,324 | $17,450 | $22,523 | $35,979 | $44,153 | $49,622 | $64,537 | $70,349 | $75,645 | $109,900 | $93,712 |
| 1995 | $42,235 | $18,031 | $21,933 | $37,609 | $44,537 | $50,485 | $63,357 | $69,584 | $77,865 | $98,302 | $95,899 |
| 1997 | $43,648 | $17,762 | $22,688 | $38,607 | $45,734 | $51,726 | $67,487 | $72,338 | $77,850 | $105,409 | $99,699 |
| 1999 | $46,236 | $19,008 | $23,977 | $39,322 | $48,588 | $54,282 | $70,925 | $76,958 | $82,097 | $110,383 | $107,217 |
| 2001 | $45,300 | $18,830 | $24,162 | $37,468 | $47,605 | $53,166 | $69,796 | $75,116 | $81,993 | $103,918 | $96,442 |
| 2003 | $45,016 | $18,787 | $22,718 | $36,835 | $45,854 | $51,970 | $68,728 | $73,446 | $78,541 | $100,000 | $96,830 |
| Average | $43,376 | $18,183 | $23,013 | $37,620 | $46,109 | $51,934 | $66,997 | $72,376 | $78,094 | $104,368 | $94,487 |
SOURCE: US Census Bureau, 2003 Yellow indicates the year with the lowest median income while green indicates the year with the highest reported median income.[24]
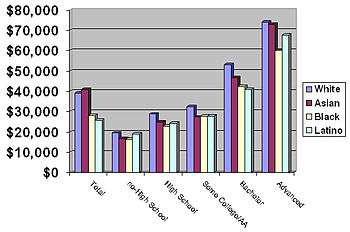
Among the races, educational attainment retains its dramatic effect on average income which varies significantly at each educational level. European Americans (White Americans) had the highest average income at every level of educational attainment. However, the proportion of those having college degrees is greater among Asian Americans than among non-Hispanic whites, and the overall highest average income is found among Asians. All races except Whites ranked last on at least one level with African Americans ranking last on the non-high school, high school and advanced degree level.[2]
Asians were second highest on the college graduate level and had the highest overall income among the general population. They also had the lowest average annual income for those with some college education or an Associates degree. Racial income difference were also significant at every level of educational attainment with the largest racial inequality being between European and African Americans who did not complete high school and those with advanced college degrees.[2]
Overall European Americans with an advanced degree had the highest average annual income with $74,122. Asian Americans had the second highest with $72,852. Hispanics and African Americans had the lowest annual incomes among those with advanced degrees averaging $67,679 and $59,944 annually. The largest racial inequity was between European Americans with a Bachelor's degree who made $53,185 and Hispanics who made $12,263 or 29.9% less with an average annual income of $40,949.[2]
Occupation

The educational attainment varied significantly among the different types of occupations. The highest occupational attainment was among those in the Professional and related fields followed by those Business, Management and financial related occupations. The professional/managerial fields were the only two occupational fields where college graduates with a Bachelor's degree or higher represented the majority. Among professional occupations, 99.1% of the population graduated from high school, 90.2% had some college education or an Associates degree and over two thirds, 68.2% had a Bachelor's degree or higher.[2]
Business and managerial occupations were second with 97.8% having graduated from high school, 79.5% having some college or an associates degree and just over half, 53.4% having a Bachelor's degree or higher. While nearly all employment fields feature a population where over 80% had graduated from high school with over a third having some college education or an Associates degree, the fields relating to agriculture, construction, manufacturing, and transportation did not. These, often described as blue collar, fields featured a labor force where less than a tenth of the population had a Bachelor's degree or higher, less than half had some college or an Associates, and less than 80% had graduated from high school.[2]
Overall the least educated occupational field was agriculture, ranking last on all educational levels. Here 55.4% had graduated from high school, roughly one fifth (20.8%) had some college education or an Associates degree and 6.8% had a Bachelor's degree or higher. While the largest occupational field, that consisting of professionals and relating occupations was also the largest field, the fields with lower educational attainment combined were larger than the professional and managerial fields combined. Overall 38.02% were employed in the professional and managerial fields while 61.89% were employed in the other white and blue collar fields were those with a bachelor's degree or higher constituted less than a third of the work force.[2]

Geography
Educational attainment among the population aged 25 and above varied rather slightly with geography region. The population of the Northeastern United States, which had the smallest population of any region with thirty-six million residents, had the highest percentage of high-school and college graduates. The western United States had the highest percentage of those with some college or an Associates degree and ranked second for college graduates. The South which had by far the largest population with roughly sixty-six million people had the lowest educational attainment at every level.[2]
The proportion of high school graduates was the largest in the Midwest while the proportion of those with some college or an Associates degree was the second and that of those with a Bachelor's degree or higher was the third largest of any region.
Social class and education
Educational attainment is one of the primary indicators of social class in the United States.[26] While the American social class system is a vaguely defined concept with many contradicting theories,[27][28] educational attainment emerges as one of the top assessments of social class. Not only is a high educational attainment a status symbol by itself, but it is also very closely related to the other two main indicators of social class: occupation and income. A graduate degree and the roughly seven to eight years of post-secondary education serve as the main requirement for entering the "professions" and becoming part of the professional middle class.[26]
Education is a major key in becoming a more privileged member of the American middle class.[26][28] Overall, educational attainment is the main entrance barrier into more privileged parts of the middle class as it is not only of high value but is also the requirement for becoming a professional and earning the corresponding income.[26] This corresponding income is typically significantly higher than that of someone without this higher level of educational attainment in the United States. Exceptions include some entrepreneurs who can rank anywhere in the class system but are usually not referred to as professional middle class unless they are of the professions.
In the United States, it is also important to differentiate between the statistical middle class, often defined as consisting of those who are neither rich nor poor, and the professional middle class. Recent research has shown that not only is the statistical middle of society (those with income roughly 80% to 120% of the national median or members of the mid-quintile) no longer able to afford the lifestyle indicative of the middle class,[29] but there also seems to be a widening income gap in between those who may be described as being middle class.
Education is not only the main requirement for becoming a member of the professional middle class, it is also key to a comfortable lifestyle and economic security.[26] Those in the statistical middle may have to fear lay-offs and cost-cutting downsizing as well as out-sourcing, while some of those in the professional middle class are less subject to economic fluctuations and are more likely to enjoy upper-middle range incomes even in the face of recessions. Increasingly however even the professional middle class is facing lay-offs and job elimination due to downsizing and replacement of full-time workers with part-time workers—this is particularly evident in colleges and universities where, by 2009, half of the faculty were part-time; another 25% were full-time but with short-term contracts, thus showing that advanced education is not necessarily associated with high salaries and economic stability.[30]
| Dennis Gilbert, 2002 | William Thompson & Joseph Hickey, 2005 | Leonard Beeghley, 2004 | |||
|---|---|---|---|---|---|
| Class | Typical characteristics | Class | Typical characteristics | Class | Typical characteristics |
| Capitalist class (1%) | Top-level executives, high-rung politicians, heirs. Ivy League education common. | Upper class (1%) | Top-level executives, celebrities, heirs; income of $500,000+ common. Ivy league education common. | The super-rich (0.9%) | Multi-millionaires whose incomes commonly exceed $350,000; includes celebrities and powerful executives/politicians. Ivy League education common. |
| Upper middle class[1] (15%) | Highly-educated (often with graduate degrees), most commonly salaried, professionals and middle management with large work autonomy. | Upper middle class[1] (15%) | Highly-educated (often with graduate degrees) professionals & managers with household incomes varying from the high 5-figure range to commonly above $100,000. | The rich (5%) | Households with net worth of $1 million or more; largely in the form of home equity. Generally have college degrees. |
| Middle class (plurality/ majority?; ca. 46%) |
College-educated workers with considerably higher-than-average incomes and compensation; a man making $57,000 and a woman making $40,000 may be typical. | ||||
| Lower middle class (30%) | Semi-professionals and craftsmen with a roughly average standard of living. Most have some college education and are white-collar. | Lower middle class (32%) | Semi-professionals and craftsmen with some work autonomy; household incomes commonly range from $35,000 to $75,000. Typically, some college education. | ||
| Working class (30%) | Clerical and most blue-collar workers whose work is highly routinized. Standard of living varies depending on number of income earners, but is commonly just adequate. High school education. | ||||
| Working class (32%) | Clerical, pink- and blue-collar workers with often low job security; common household incomes range from $16,000 to $30,000. High school education. | Working class (ca. 40–45%) |
Blue-collar workers and those whose jobs are highly routinized with low economic security; a man making $40,000 and a woman making $26,000 may be typical. High school education. | ||
| Working poor (13%) | Service, low-rung clerical and some blue-collar workers. High economic insecurity and risk of poverty. Some high school education. | ||||
| Lower class (ca. 14–20%) | Those who occupy poorly-paid positions or rely on government transfers. Some high school education. | ||||
| Underclass (12%) | Those with limited or no participation in the labor force. Reliant on government transfers. Some high school education. | The poor (ca. 12%) | Those living below the poverty line with limited to no participation in the labor force; a household income of $18,000 may be typical. Some high school education. | ||
Thompson, W. & Hickey, J. (2005). Society in Focus. Boston, MA: Pearson, Allyn & Bacon; Beeghley, L. (2004). The Structure of Social Stratification in the United States. Boston, MA: Pearson, Allyn & Bacon.
| |||||
Educational attainment in social theory
Bourdieu and cultural capital
Many scholars have studied educational attainment in the US as a form of social reproduction and stratification. In 1977, Pierre Bourdieu presented the idea that education leads to social reproduction and a stratified society by honoring the cultural capital of elite classes. Students who possess the valued cultural capital, according to Bourdieu, are rewarded with high academic achievement.[31]
When elite class members enter the workforce, they are channeled into high paying jobs and powerful positions within society, while those who did not achieve the same level of academic success fall into subordinate occupations and status levels. By rewarding the desired cultural capital with high academic achievement, upper classes are able and prepared to reach higher levels of educational attainment. Members of the working class, on the other hand, are not rewarded for their cultural capital in schools, and are instead socialized for working class jobs.
Lareau and concerted cultivation
Annette Lareau also addresses the factors that lead to social stratification in educational attainment. Lareau's idea of concerted cultivation refers to an active involvement of parents in a child's learning and development experiences by creating and controlling organized activities for their children. According to Lareau, middle-class parents engage in concerted cultivation to teach their children, while lower- and working-class parents do not. Laureau further explains that schools firmly encourage and expect parents to use concerted cultivation as a child-rearing strategy.[32]
The child-rearing practices of lower- and working-class families thus do not comply with the standards of educational institutions. As a result, lower- and working-class students develop a sense of "distance, distrust, and constraint" in educational institutions, while children of middle-class families gain a sense of entitlement. These differences in child-rearing practices lead to children of lower- and working-class families to lack the necessary life skills that the children of the middle class possess, further isolating them from educational opportunities. In the United States, education attainment typically is viewed as a sign of social status.
Collins and credentialism
Randall Collins contributed the idea of credentialism to the study of class-based differences in educational attainment. Collins maintains that public schools are socializing institutions that teach and reward middle-class values of competition and achievement. In this view, elites are selectively separated from other students and placed into prestigious schools and colleges, where they are trained to hold positions of power.[33]
By teaching middle-class culture through the public education system, the elite class ensures a monopoly over positions of power, while others acquire the credentials to compete in a subordinate job market and economy. In this way, schools of medicine, law, and elite institutions have remained closed to members of lower classes.
See also
- American middle class
- Education in the United States
- Income inequality in the United States
- Basic income in the United States
- Household income in the United States
- Literacy in the United States
- Poverty in the United States
- List of U.S. States by Education attainment
- Racial achievement gap in the United States
General:
References
- ↑ Ryan, Camille; Siebens, Julie (February 2012). "Educational Attainment in the United States: 2009" (PDF). U.S. Census Bureau. Retrieved February 25, 2013.
- 1 2 3 4 5 6 7 8 9 10 11 12 13 14 15 16 17 18 19 20 "US Census Bureau report on educational attainment in the United States, 2003" (PDF). Retrieved July 31, 2006.
- ↑ Note that these add up to more than 100% because they are cumulative; e.g. it is assumed that all people with doctorates also have undergraduate and high school degrees, and are thus counted twice in the "lower" categories. Age 25 is used rather than age 18 because there are few people aged 18 or over with advanced degrees. "Educational Attainment in the United States: 2014". U.S. Census Bureau. Retrieved January 29, 2015. Percentages are calculated based on Census data by counting people that had attained that level or higher.
- ↑ Census. "Educational Attainment in the United States: 2015" (PDF).
- 1 2 Kafir, Krista (April 2007). "Taking the Boy Crisis in Education Seriously: How School Choice can Boost Achievement Among Boys and Girls." Independent Women's Forum.
- 1 2 3 Perie, M. (2005). NAEP 2004 Trends in Academic Progress. Washington, DC: US Department of Education.
- 1 2 Persky, H. (2003). The Nation's Report Card: Writing 2002. US Department of Education.
- 1 2 Salahu-Din, Debra (2008). The Nation's Report Card: Writing 2007. US Department of Education.
- ↑ "Percentage of high school dropouts among persons 16 through 24 years old (status dropout rate), by sex and race/ethnicity: Selected years, 1960 through 2006". Nces.ed.gov. Retrieved April 24, 2012.
- ↑ "Historical summary of faculty, students, degrees, and finances in degree-granting institutions: Selected years, 1869–70 through 2005–06". Nces.ed.gov. Retrieved April 24, 2012.
- ↑ Digest of Education Statistics 2007
- ↑ Mead, Sara. (2006). The Evidence Suggests Otherwise: The Truth About Boys and Girls. Washington: Education Sector.
- ↑ U.S. Census Bureau, Current Population Survey, Annual Social and Economic Supplement 2007.
- ↑ "Degrees conferred by degree-granting institutions, by level of degree and sex of student: Selected years, 1869–70 through 2016–17". Nces.ed.gov. Retrieved April 24, 2012.
- ↑ "African Immigrants are the Most Educated". Africaresource.com. April 28, 2007. Retrieved April 24, 2012.
- 1 2 "Migration Information Source - African Immigrants in the United States". Migrationinformation.org. Retrieved April 24, 2012.
- ↑ "AAME :". Inmotionaame.org. Retrieved April 24, 2012.
- ↑ "Affirmative Action Minorities - Affirmative Action College Admissions". Racerelations.about.com. Retrieved April 24, 2012.
- ↑ (Logan & Deane, 2003; Williams, 2005; The Economist, 1996; Arthur, 2000; Selassie, 1998).
- ↑ "AAME : image". Inmotionaame.org. Retrieved April 24, 2012.
- 1 2 Bradford, Harry (August 3, 2011). "Foreign-Born Blacks Hit Hardest Of All Immigrant Groups By Jobs Crisis". Huffingtonpost.com. Retrieved April 24, 2012.
- ↑ "Migration Information Source - Characteristics of the African Born in the United States". Migrationinformation.org. Retrieved April 24, 2012.
- ↑ http://www.aracorporation.org/files/14._africans_most_educated.pd. Retrieved April 24, 2012. Missing or empty
|title=(help) - 1 2 3 4 5 "Educational attainment and median household income". Archived from the original on September 3, 2006. Retrieved September 24, 2006.
- 1 2 3 "Personal income and educational attainment, US Census Bureau". Archived from the original on September 7, 2006. Retrieved September 24, 2006.
- 1 2 3 4 5 Ehrenreich, Barbara (1989). Fear of Falling, The Inner Life of the Middle Class. New York, NY: Harper Collins. ISBN 0-06-097333-1.
- ↑ "Middle class according to The Drum Major Institute for public policy". Retrieved July 25, 2006.
- 1 2 Fussel, Paul (1983). Class, A Guide through the American status system. New York, NY: Touchstone. ISBN 0-671-79225-3.
- ↑ "Middle income can't buy Middle class lifestyle". Retrieved July 25, 2006.
- ↑ James Monks. "Who are the Part-time Faculty?" Academe, July–August 2009. http://www.aaup.org/article/who-are-part-time-faculty#.UsU90fQW0oo
- ↑ Bourdieu, P. (1977) Cultural Reproduction and Social Reproduction. In: Karabel, J., & Halsey, A. H. (eds.) Power and Ideology in Education. Oxford University Press, New York, pp. 487-511.
- ↑ Lareau, A. (2003). Unequal Childhoods; Class, Race, and Family Life. Berkeley, CA: University of California Press. ISBN 0-520-23950-4.
- ↑ Collins, R (1979). The Credential Society; An Historical Sociology of Education and Stratification. New York, NY: Academic Press. ISBN 0-12-181360-6.
Further reading
- Sunny Decker (1969), An Empty Spoon, New York: Harper & Row.
- James Herndon (1968/1969), The Way It Spozed to Be, reprint, New York: Bantam.
- James Herndon (1971/1997), How to Survive in Your Native Land, reprint, Portsmouth, NH: Boynton/Cook.
- James Herndon (1985), Notes from a Schoolteacher, New York: Simon and Schuster.
- Holly Yettick and Sterling C. Lloyd (2015), "Graduation Rate Hits High, But Some Groups Lag," Education Week.
External links
- Educational Attainment in the United States: 2003, U.S. Census Bureau
- The Big Payoff: Educational Attainment and Synthetic Estimates of Work-Life Earnings, U.S. Census Bureau
- Map: Graduation Rate by State, Student Group, Education Week
| |||||||||||||||||||||||||||||||||||||||||||||||
| |||||||||||||||||||||||||||||||||||||||||||||||
| |||||||||||||||||||||||||||||||||||||||||||||||
| |||||||||||||||||||||||||||||||||||||||||||||||