Lawrence County, Ohio
| Lawrence County, Ohio | ||
|---|---|---|
 | ||
| ||
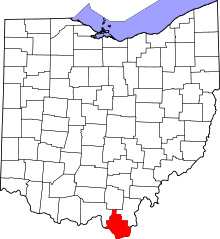 Location in the U.S. state of Ohio | ||
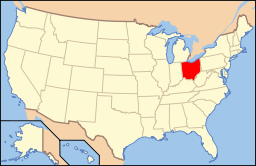 Ohio's location in the U.S. | ||
| Founded | March 1, 1817 | |
| Named for | James Lawrence | |
| Seat | Ironton | |
| Largest city | Ironton | |
| Area | ||
| • Total | 457 sq mi (1,184 km2) | |
| • Land | 453 sq mi (1,173 km2) | |
| • Water | 3.9 sq mi (10 km2), 0.9% | |
| Population | ||
| • (2010) | 62,450 | |
| • Density | 138/sq mi (53/km²) | |
| Congressional district | 6th | |
| Time zone | Eastern: UTC-5/-4 | |
| Website |
www | |

Lawrence County is a county located in the U.S. state of Ohio. As of the 2010 census, the population was 62,450.[1] Its county seat is Ironton.[2] The county was created in 1815 and later organized in 1817.[3] It is named for James Lawrence, the naval officer famous for the line "do not give up the ship".[4]
Lawrence County is part of the Huntington-Ashland, WV-KY-OH Metropolitan Statistical Area, which is also included in the Charleston-Huntington-Ashland, WV-OH-KY Combined Statistical Area.[5]
History
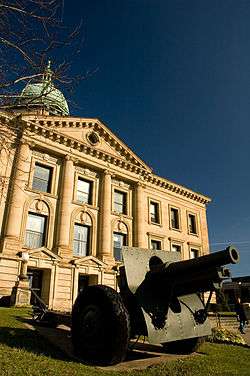
The earliest settlers, Luke Kelly, his family and May Keyser, settled at Hanging Rock, along the Ohio River in 1796.[6] Lawrence County was formed on December 20, 1816 from parts of Gallia and Scioto Counties, with the county seat being at Burlington.[6] In 1851 the county seat was moved from Burlington to Ironton. A new court House was built at that time but it burned in 1857. The present Lawrence County Courthouse was built in 1908.
Citizens from Lawrence County served in the Mexican-American War with at least one having died during that conflict. About 3200 of Lawrence County's men were soldiers in the Union Army by 1862 in the American Civil War.[7] World War I saw 2200 of Lawrence County's men serving the U.S.A. of which 99 died.[8]
When first settled, Lawrence County was rich in natural resources such as iron, timber, coal, natural gas, oil, and salt. By the beginning of the twentieth century, many of these had been depleted.
Geography
According to the U.S. Census Bureau, the county has a total area of 457 square miles (1,180 km2), of which 453 square miles (1,170 km2) is land and 3.9 square miles (10 km2) (0.9%) is water.[9] It is the southernmost county in the state of Ohio.
Adjacent counties
- Jackson County (north)
- Gallia County (northeast)
- Cabell County, West Virginia (southeast)
- Wayne County, West Virginia (south)
- Boyd County, Kentucky (southwest)
- Greenup County, Kentucky (southwest)
- Scioto County (northwest)
National protected area
- Wayne National Forest (part)
Demographics
| Historical population | |||
|---|---|---|---|
| Census | Pop. | %± | |
| 1820 | 3,499 | — | |
| 1830 | 5,367 | 53.4% | |
| 1840 | 9,738 | 81.4% | |
| 1850 | 15,246 | 56.6% | |
| 1860 | 23,249 | 52.5% | |
| 1870 | 31,380 | 35.0% | |
| 1880 | 39,068 | 24.5% | |
| 1890 | 39,556 | 1.2% | |
| 1900 | 39,534 | −0.1% | |
| 1910 | 39,488 | −0.1% | |
| 1920 | 39,540 | 0.1% | |
| 1930 | 44,541 | 12.6% | |
| 1940 | 46,705 | 4.9% | |
| 1950 | 49,115 | 5.2% | |
| 1960 | 55,438 | 12.9% | |
| 1970 | 56,868 | 2.6% | |
| 1980 | 63,849 | 12.3% | |
| 1990 | 61,834 | −3.2% | |
| 2000 | 62,319 | 0.8% | |
| 2010 | 62,450 | 0.2% | |
| Est. 2015 | 61,109 | [10] | −2.1% |
| U.S. Decennial Census[11] 1790-1960[12] 1900-1990[13] 1990-2000[14] 2010-2013[1] | |||
2000 census
As of the census[15] of 2000, there were 62,319 people, 24,732 households, and 17,807 families residing in the county. The population density was 137 people per square mile (53/km²). There were 27,189 housing units at an average density of 60 per square mile (23/km²). The racial makeup of the county was 96.55% White, 2.09% Black or African American, 0.18% Native American, 0.19% Asian, 0.01% Pacific Islander, 0.11% from other races, and 0.88% from two or more races. 0.57% of the population were Hispanic or Latino of any race.
There were 24,732 households out of which 32.00% had children under the age of 18 living with them, 56.00% were married couples living together, 11.90% had a female householder with no husband present, and 28.00% were non-families. 24.90% of all households were made up of individuals and 11.20% had someone living alone who was 65 years of age or older. The average household size was 2.49 and the average family size was 2.96.
In the county, the population was spread out with 24.50% under the age of 18, 8.60% from 18 to 24, 28.00% from 25 to 44, 24.50% from 45 to 64, and 14.40% who were 65 years of age or older. The median age was 38 years. For every 100 females there were 92.20 males. For every 100 females age 18 and over, there were 88.40 males.
The median income for a household in the county was $29,127, and the median income for a family was $35,308. Males had a median income of $30,622 versus $20,961 for females. The per capita income for the county was $14,678. About 15.10% of families and 18.90% of the population were below the poverty line, including 27.30% of those under age 18 and 12.90% of those age 65 or over.
2010 census
As of the 2010 United States Census, there were 62,450 people, 24,974 households, and 17,405 families residing in the county.[16] The population density was 137.7 inhabitants per square mile (53.2/km2). There were 27,603 housing units at an average density of 60.9 per square mile (23.5/km2).[17] The racial makeup of the county was 95.9% white, 2.0% black or African American, 0.4% Asian, 0.2% American Indian, 0.2% from other races, and 1.4% from two or more races. Those of Hispanic or Latino origin made up 0.7% of the population.[16] In terms of ancestry, 18.0% were American, 15.4% were German, 12.9% were Irish, and 10.8% were English.[18]
Of the 24,974 households, 32.9% had children under the age of 18 living with them, 51.0% were married couples living together, 13.2% had a female householder with no husband present, 30.3% were non-families, and 26.1% of all households were made up of individuals. The average household size was 2.47 and the average family size was 2.95. The median age was 40.1 years.[16]
The median income for a household in the county was $36,461 and the median income for a family was $46,732. Males had a median income of $38,170 versus $28,251 for females. The per capita income for the county was $19,452. About 15.2% of families and 19.4% of the population were below the poverty line, including 28.0% of those under age 18 and 11.9% of those age 65 or over.[19]
Politics
| Year | Republican | Democrat |
|---|---|---|
| 2016 | 69.66% 18,240 | 26.16% 6,849 |
| 2012 | 56.50% 14,651 | 41.43% 10,744 |
| 2008 | 56.28% 15,415 | 41.12% 11,262 |
| 2004 | 55.77% 15,455 | 43.74% 12,120 |
| 2000 | 51.25% 12,531 | 46.24% 11,307 |
Government
Lawrence County has a 3-member Board of County Commissioners that oversee the various County departments, similar to all but 2 of the 88 Ohio counties. Lawrence County's elected commissioners are:
- County Commissioners: Bill Pratt (R), Les Boggs (R), and Freddie Hayes, Jr. (R).[21]
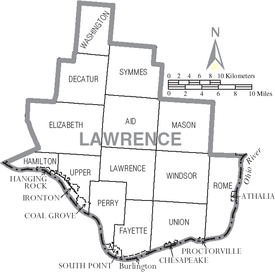
Communities
City
- Ironton (county seat)
Villages
Townships
Census-designated place
Unincorporated communities
See also
References
- 1 2 "State & County QuickFacts". United States Census Bureau. Retrieved February 8, 2015.
- ↑ "Find a County". National Association of Counties. Retrieved 2011-06-07.
- ↑ "Ohio: Individual County Chronologies". Ohio Atlas of Historical County Boundaries. The Newberry Library. 2007. Retrieved February 14, 2015.
- ↑ Gannett, Henry (1905). The Origin of Certain Place Names in the United States. U.S. Government Printing Office. p. 182.
- ↑ "Population statistics" (PDF).
- 1 2 Brown, Paul M. (1966). "A Story About Lawrence County, Ohio". Huntington, WV: Paul Brown Publishing Co.: 15 (unnumbered). OCLC 2667859.
- ↑ Ironton Register, October 9, 1862
- ↑ "WW I Stories".
- ↑ "2010 Census Gazetteer Files". United States Census Bureau. August 22, 2012. Retrieved February 8, 2015.
- ↑ "County Totals Dataset: Population, Population Change and Estimated Components of Population Change: April 1, 2010 to July 1, 2015". Retrieved July 2, 2016.
- ↑ "U.S. Decennial Census". United States Census Bureau. Retrieved February 8, 2015.
- ↑ "Historical Census Browser". University of Virginia Library. Retrieved February 8, 2015.
- ↑ Forstall, Richard L., ed. (March 27, 1995). "Population of Counties by Decennial Census: 1900 to 1990". United States Census Bureau. Retrieved February 8, 2015.
- ↑ "Census 2000 PHC-T-4. Ranking Tables for Counties: 1990 and 2000" (PDF). United States Census Bureau. April 2, 2001. Retrieved February 8, 2015.
- ↑ "American FactFinder". United States Census Bureau. Retrieved 2008-01-31.
- 1 2 3 "DP-1 Profile of General Population and Housing Characteristics: 2010 Demographic Profile Data". United States Census Bureau. Retrieved 2015-12-27.
- ↑ "Population, Housing Units, Area, and Density: 2010 - County". United States Census Bureau. Retrieved 2015-12-27.
- ↑ "DP02 SELECTED SOCIAL CHARACTERISTICS IN THE UNITED STATES – 2006-2010 American Community Survey 5-Year Estimates". United States Census Bureau. Retrieved 2015-12-27.
- ↑ "DP03 SELECTED ECONOMIC CHARACTERISTICS – 2006-2010 American Community Survey 5-Year Estimates". United States Census Bureau. Retrieved 2015-12-27.
- ↑ "Dave Leip's Atlas of U.S. Presidential Elections". Retrieved 2016-04-02.
- ↑ "Lawrence County, Ohio". County Commissioner of Ohio Homepage. Retrieved September 30, 2013.
External links
 |
Scioto County | Jackson County | Gallia County | |
| |
||||
| ||||
| | ||||
| Greenup County, Kentucky, Boyd County, Kentucky |
Wayne County, West Virginia | Cabell County, West Virginia |
Municipalities and communities of Lawrence County, Ohio, United States | ||
|---|---|---|
| City | | |
| Villages | ||
| Townships | ||
| CDP | ||
| Unincorporated communities | ||
| Footnotes | ‡This populated place also has portions in an adjacent county or counties | |
| Principal cities | 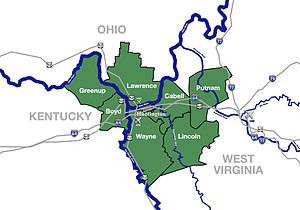 | |
|---|---|---|
| Municipalities with population over 5,000 | ||
| Municipalities with population 1,000–5,000 | ||
| Municipalities with population under 1,000 | ||
| West Virginia counties | ||
| Kentucky counties | ||
| Ohio counties | ||
Coordinates: 38°35′N 82°32′W / 38.59°N 82.54°W