Demographics of Malta
This article is about the demographic features of the population of Malta, including population density, ethnicity, religious affiliations and other aspects of the population.
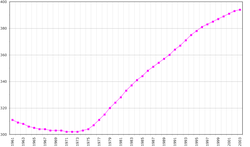
| Census population and average annual growth rate | ||
|---|---|---|
| Year | Pop. | ±% |
| 1842 | 114,499 | — |
| 1851 | 123,496 | +7.9% |
| 1861 | 134,055 | +8.6% |
| 1871 | 141,775 | +5.8% |
| 1881 | 149,782 | +5.6% |
| 1891 | 165,037 | +10.2% |
| 1901 | 184,742 | +11.9% |
| 1911 | 211,564 | +14.5% |
| 1921 | 212,258 | +0.3% |
| 1931 | 241,621 | +13.8% |
| 1948 | 305,991 | +26.6% |
| 1957 | 319,620 | +4.5% |
| 1967 | 314,216 | −1.7% |
| 1985 | 345,418 | +9.9% |
| 1995 | 378,132 | +9.5% |
| 2005 | 404,962 | +7.1% |
| 2010 | 417,432 | +3.1% |
| Source:[1] | ||
Characteristics
Malta is the most densely populated country in the EU and one of the most densely populated countries in the world, with about 1,265 inhabitants per square kilometre (3,000 per square mile). This compares with about 32 per square kilometre (85 per square mile) for the United States. A census (held every 10 years) was held in November 2005.
Inhabited since prehistoric times, Malta was first colonized by Sicilians. Subsequently, Phoenicians, Romans, Byzantines, Arabs in 870 CE[2] who may have completely depopulated the islands[3] but in 1224 were themselves expelled from Malta,[4] Normans, Sicilians, Spanish, French and the British have influenced Maltese life and culture to varying degrees.
Roman Catholicism is established by law as the religion of Malta with 98%; however, full liberty of conscience and freedom of worship is guaranteed, and a number of faiths have places of worship on the island (rather small groups, a combined total of 2% of the people are Protestants, Eastern Orthodox, Muslims and Jews).
Malta has two official languages--Maltese (a Semitic language derived from Siculo-Arabic and heavily influenced by Sicilian and Italian), and English. Both languages are compulsory subjects in Maltese primary and secondary schools. A large portion of the population is also fluent in Italian, which was, until 1936, the national language of Malta. The literacy rate has reached 93%, compared to 63% in 1946. Schooling is compulsory until age 16.
Age distribution
Since 2000, the shift in the age composition towards an older population continued to materialise. In fact, the average age of the Maltese population increased from 38.5 in 2005 to 40.5 in 2011. This resulted from the increase in the number of persons aged 55 and over, together with a decrease in the number of persons under 25 years of age. The average in Gozo and Comino (41.6 years) was higher than that observed for Malta. Persons aged 65 and over more represent 16.3% of the total population in 2011, compared to 13.7% in 2005. In contrast, persons aged 14 and under make up 14.8% of the population in 2011, compared to 17.2% in 2005.[5]
Emigration
Malta has long been a country of emigration, with big Maltese communities in English-speaking countries abroad.
Mass emigration picked up in the 19th century, reaching its peak in the decades after World War II. Migration was initially to north African countries (particularly Algeria, Tunisia and Egypt); later Maltese migrants headed towards the United Kingdom, the United States, Canada and Australia. There is little trace left of the Maltese communities in north Africa, most of them having been displaced, after the rise of independence movements, to places like Marseille, the United Kingdom or Australia. Although migration has ceased to be a social phenomenon of significance there are still important Maltese communities in Australia, Canada, the United States and the United Kingdom. Since Malta joined the EU in 2004 expatriate communities emerged in a number of European countries particularly in Belgium and Luxembourg.
Immigration

At the 2005 Census the non-Maltese population numbered 12,112 (3.0% of the total population). Of these, people with British (4,713), Italian (585), German (518) and Libyan (493) citizenship were most common.[6] Of the total population of 416,055 persons in 2011, 20,086, or 4.8%, are non-Maltese nationals, an increase of 65.8% over 2005.[7]
Most of the foreign community in Malta, predominantly active or retired British nationals and their dependents, is centred on Sliema and surrounding modern suburbs. Other smaller foreign groups include Italians, French, and Lebanese, many of whom have assimilated into the Maltese nation over the decades.[8]
Since the late 20th century, Malta has become a transit country for migration routes from Africa towards Europe.[9]
In 1990–1991, Malta hosted a number of Iraqi asylum-seekers, that were later resettled elsewhere, especially in North America.[10] As from 2001, Malta has received a high number of landings of migrants from sub-Saharan Africa, many of whom were entitled to international protection. 2006 and 2007 saw about 1800 arriving each year.[11] Landings included 1173 people in 2009, 28 in 2010, 1577 in 2011, 2023 in 2012, and 741 up to mid July 2013.[12] Most of such persons were then resettled elsewhere in Europe or North America.
Between 2008 and 2012 Malta received, on average, the highest number of asylum seekers compared to its national population: 21.7 applicants per 1,000 inhabitants.[13] In 2011, most of these asylum applications were submitted by nationals of Somalia, Nigeria, Eritrea and Syria.[14] In 2012, more than half of the requests were by Somalian nationals alone.[15]
As a member of the European Union and of the Schengen agreement, Malta is bound by the Dublin Regulation to process all claims for asylum by those asylum seekers that enter EU territory for the first time in Malta.[16]
Malta has in the past considered adopting a push-back policy towards approaching migrants, pushing their boats back to Libya.[17] Such a policy, contrary to international law and the principle of non-refoulement, has been condemned by the European Court of Human Rights in a case against Italy, as it does not allow prospective asylum seekers to file their claims for international protection.[18]
Irregular migrants (formal Maltese: immigranti irregolari, informal: klandestini) who land in Malta are subject to a compulsory detention policy, being held in several camps organised by the Armed Forces of Malta (AFM), including those near Ħal Far and Ħal Safi. The compulsory detention policy has been denounced by several NGOs, and in July 2010, the European Court of Human Rights found that Malta's detention of migrants was arbitrary, lacking in adequate procedures to challenge detention, and in breach of its obligations under the European Convention on Human Rights.[19][20]
Very few migrants arrived in Malta in 2015, despite the fact that the rest Europe is experiencing a migrant crisis. Most migrants who were rescued between Libya and Malta were taken to Italy, and some refused to be brought to Malta.[21]
Vital statistics
Statistics from United Nations[22] and National Statistics Office Malta[23]
| Average population (x 1000) | Live births | Deaths | Natural change | Crude birth rate (per 1000) | Crude death rate (per 1000) | Natural change (per 1000) | Infant mortality rate | |
|---|---|---|---|---|---|---|---|---|
| 1932 | 246 | 8 000 | 5 150 | 2 850 | 32.5 | 20.9 | 11.6 | |
| 1933 | 250 | 8 300 | 5 100 | 3 200 | 33.2 | 20.4 | 12.8 | |
| 1934 | 254 | 8 544 | 5 702 | 2 842 | 33.6 | 22.4 | 11.2 | |
| 1935 | 256 | 8 701 | 6 018 | 2 683 | 34.0 | 23.5 | 10.5 | |
| 1936 | 259 | 8 875 | 4 617 | 4 258 | 34.3 | 17.8 | 16.4 | |
| 1937 | 263 | 8 879 | 5 304 | 3 575 | 33.8 | 20.2 | 13.6 | |
| 1938 | 267 | 8 704 | 5 399 | 3 305 | 32.6 | 20.2 | 12.4 | |
| 1939 | 269 | 8 930 | 5 385 | 3 545 | 33.2 | 20.0 | 13.2 | |
| 1940 | 270 | 8 808 | 6 144 | 2 664 | 32.6 | 22.8 | 9.9 | |
| 1941 | 271 | 7 352 | 6 444 | 908 | 27.1 | 23.8 | 3.4 | |
| 1942 | 270 | 6 768 | 8 603 | -1 835 | 25.1 | 31.9 | -6.8 | |
| 1943 | 271 | 8 452 | 5 578 | 2 874 | 31.2 | 20.6 | 10.6 | |
| 1944 | 276 | 10 963 | 3 700 | 7 263 | 39.7 | 13.4 | 26.3 | |
| 1945 | 283 | 10 998 | 4 016 | 6 982 | 38.9 | 14.2 | 24.7 | |
| 1946 | 291 | 11 304 | 4 050 | 7 254 | 38.8 | 13.9 | 24.9 | |
| 1947 | 300 | 11 612 | 3 838 | 7 774 | 38.7 | 12.8 | 25.9 | |
| 1948 | 306 | 11 029 | 3 737 | 7 292 | 36.0 | 12.2 | 23.8 | |
| 1949 | 311 | 10 590 | 3 326 | 7 264 | 34.1 | 10.7 | 23.4 | |
| 1950 | 312 | 10 281 | 3 224 | 7 057 | 33.0 | 10.3 | 22.6 | |
| 1951 | 313 | 9 511 | 3 476 | 6 035 | 30.4 | 11.1 | 19.3 | |
| 1952 | 317 | 9 226 | 3 365 | 5 861 | 29.1 | 10.6 | 18.5 | |
| 1953 | 317 | 8 977 | 2 848 | 6 129 | 28.3 | 9.0 | 19.3 | |
| 1954 | 320 | 8 991 | 3 071 | 5 920 | 28.1 | 9.6 | 18.5 | |
| 1955 | 314 | 8 560 | 2 683 | 5 877 | 27.3 | 8.5 | 18.7 | |
| 1956 | 314 | 8 418 | 2 918 | 5 500 | 26.8 | 9.3 | 17.5 | |
| 1957 | 319 | 8 794 | 2 955 | 5 839 | 27.6 | 9.3 | 18.3 | |
| 1958 | 322 | 8 528 | 2 657 | 5 871 | 26.5 | 8.3 | 18.2 | |
| 1959 | 325 | 8 499 | 2 836 | 5 663 | 26.2 | 8.7 | 17.4 | |
| 1960 | 329 | 8 565 | 2 819 | 5 746 | 26.0 | 8.6 | 17.5 | |
| 1961 | 329 | 7 674 | 2 937 | 4 737 | 23.3 | 8.9 | 14.4 | |
| 1962 | 329 | 7 513 | 2 840 | 4 673 | 22.8 | 8.6 | 14.2 | |
| 1963 | 328 | 6 672 | 2 981 | 3 691 | 20.3 | 9.1 | 11.3 | |
| 1964 | 324 | 6 394 | 2 756 | 3 638 | 19.7 | 8.5 | 11.2 | |
| 1965 | 319 | 5 628 | 3 001 | 2 627 | 17.6 | 9.4 | 8.2 | |
| 1966 | 317 | 5 340 | 2 865 | 2 475 | 16.8 | 9.0 | 7.8 | |
| 1967 | 319 | 5 309 | 2 985 | 2 324 | 16.6 | 9.4 | 7.3 | |
| 1968 | 319 | 5 145 | 2 883 | 2 262 | 16.1 | 9.0 | 7.1 | |
| 1969 | 323 | 5 096 | 3 024 | 2 072 | 15.8 | 9.4 | 6.4 | |
| 1970 | 303 | 5 314 | 3 070 | 2 244 | 17.5 | 10.1 | 7.4 | |
| 1971 | 303 | 5 562 | 3 090 | 2 472 | 18.4 | 10.2 | 8.2 | |
| 1972 | 303 | 5 385 | 2 891 | 2 494 | 17.8 | 9.5 | 8.2 | |
| 1973 | 303 | 5 631 | 2 935 | 2 696 | 18.6 | 9.7 | 8.9 | |
| 1974 | 303 | 5 691 | 2 747 | 2 944 | 18.8 | 9.1 | 9.7 | |
| 1975 | 304 | 6 007 | 2 900 | 3 107 | 19.8 | 9.5 | 10.2 | |
| 1976 | 307 | 5 927 | 2 967 | 2 960 | 19.3 | 9.7 | 9.6 | |
| 1977 | 310 | 5 937 | 2 872 | 3 065 | 19.2 | 9.3 | 9.9 | |
| 1978 | 319 | 5 641 | 3 263 | 2 378 | 17.7 | 10.2 | 7.5 | |
| 1979 | 320 | 5 823 | 2 968 | 2 855 | 18.2 | 9.3 | 8.9 | |
| 1980 | 324 | 5 602 | 3 215 | 2 387 | 17.3 | 9.9 | 7.4 | |
| 1981 | 327 | 5 592 | 3 062 | 2 530 | 17.1 | 9.4 | 7.7 | |
| 1982 | 330 | 5 912 | 3 050 | 2 862 | 17.9 | 9.2 | 8.7 | |
| 1983 | 334 | 5 651 | 3 137 | 2 514 | 16.9 | 9.4 | 7.5 | |
| 1984 | 337 | 5 571 | 2 903 | 2 668 | 16.5 | 8.6 | 7.9 | |
| 1985 | 340 | 5 430 | 2 837 | 2 593 | 16.0 | 8.4 | 7.6 | |
| 1986 | 347 | 5 245 | 2 824 | 2 421 | 15.1 | 8.1 | 7.0 | |
| 1987 | 350 | 5 314 | 2 908 | 2 406 | 15.2 | 8.3 | 6.9 | |
| 1988 | 353 | 5 533 | 2 708 | 2 825 | 15.7 | 7.7 | 8.0 | |
| 1989 | 356 | 5 584 | 2 610 | 2 974 | 15.7 | 7.3 | 8.3 | |
| 1990 | 360 | 5 368 | 2 745 | 2 623 | 14.9 | 7.6 | 7.3 | |
| 1991 | 364 | 5 302 | 2 875 | 2 427 | 14.6 | 7.9 | 6.7 | |
| 1992 | 368 | 5 474 | 2 900 | 2 574 | 14.9 | 7.9 | 7.0 | |
| 1993 | 371 | 5 147 | 2 692 | 2 455 | 13.9 | 7.2 | 6.6 | |
| 1994 | 375 | 4 826 | 2 698 | 2 128 | 12.9 | 7.2 | 5.7 | |
| 1995 | 377 | 4 613 | 2 708 | 1 905 | 12.2 | 7.2 | 5.0 | |
| 1996 | 380 | 5 038 | 2 765 | 2 273 | 13.3 | 7.3 | 6.0 | |
| 1997 | 383 | 4 848 | 2 888 | 1 960 | 12.7 | 7.5 | 5.1 | |
| 1998 | 385 | 4 670 | 3 044 | 1 626 | 12.1 | 7.9 | 4.2 | |
| 1999 | 388 | 4 403 | 3 097 | 1 306 | 11.4 | 8.0 | 3.4 | |
| 2000 | 390 | 4 392 | 2 957 | 1 435 | 11.3 | 7.6 | 3.7 | 6.1 |
| 2001 | 393 | 3 957 | 2 935 | 1 022 | 10.1 | 7.5 | 2.6 | 4.4 |
| 2002 | 396 | 3 918 | 3 031 | 887 | 9.9 | 7.7 | 2.2 | 6.0 |
| 2003 | 399 | 4 050 | 3 164 | 886 | 10.2 | 7.9 | 2.2 | 5.9 |
| 2004 | 401 | 3 887 | 2 999 | 888 | 9.7 | 7.5 | 2.2 | 5.9 |
| 2005 | 404 | 3 858 | 3 130 | 728 | 9.6 | 7.8 | 1.8 | 6.0 |
| 2006 | 406 | 3 885 | 3 216 | 669 | 9.6 | 7.9 | 1.6 | 3.6 |
| 2007 | 409 | 3 871 | 3 111 | 760 | 9.5 | 7.6 | 1.9 | 6.5 |
| 2008 | 410 | 4 126 | 3 243 | 883 | 10.1 | 7.9 | 2.2 | 8.2 |
| 2009 | 413 | 4 143 | 3 221 | 922 | 10.0 | 7.8 | 2.2 | 5.3 |
| 2010 | 415 | 4 008 | 3 010 | 998 | 9.7 | 7.3 | 2.4 | 5.5 |
| 2011 | 416 | 4 283 | 3 266 | 1 017 | 10.3 | 7.9 | 2.4 | |
| 2012 | 419 | 4 231 | 3 418 | 813 | 10.1 | 8.2 | 1.9 | |
| 2013 | 423 | 4 127 | 3 270 | 857 | 9.9 | 7.7 | 2.2 | |
| 2014 | 427 | 4 311 | 10.1 | |||||
| 2015 | 429 | 4 325 | 3 442 | 883 | 10.1 | 8.0 | 2.1 |
CIA World Factbook demographic statistics
The following demographic statistics are from the CIA World Factbook, unless otherwise indicated.
Largest Cities:
Life expectancy at birth:
total population:
79.01 years
male:
76.83 years
female:
81.31 years (2006 est.)
Total fertility rate: 1.5 children born/woman (2006 est.)
Religions: Roman Catholic Church in Malta 98%
Languages: Maltese (official de facto), English (official de jure), Italian (widely understood)
See also
References
- ↑ Census in Malta
- ↑ The Arabs in Malta / G. Wettinger. In: Malta: Studies of its Heritage and History / ed. Mid-Med Bank (Malta, 1986), pp. 87-104.
- ↑ Ibn Hauqal and Tenth-century Malta / A. Luttrell. In: Hyphen: A Journal of Melitensia and the Humanities. / (Malta 1987), pp 157–160
- ↑ http://www.aboutmalta.com/history/time-Line.htm
- ↑ Census 2011 Preliminary Report
- ↑ Census 2005
- ↑
- ↑ Genetic origin of Maltese people originated from southern Italians
- ↑ "Malta guards Europe's gates against African immigrants". Los Angeles Times. Retrieved 30 April 2012.
- ↑ The New Federalist
- ↑ TPPI Report, p.1
- ↑ Frontex watch
- ↑ UNHCR, p. 13
- ↑ [Ibidem, p. 26]
- ↑ [Ibidem, p. 45]
- ↑ "Maltese Anger Mounts Over Rising Illegal Immigration". Deutsche Welle. Retrieved 30 April 2012.
- ↑ http://www.maltatoday.com.mt/en/newsdetails/news/national/Joseph-Muscat-rattles-EU-cage-on-pushbacks-20130706
- ↑ Times of Malta
- ↑ Human Rights Watch
- ↑ "Malta faces problems with children of illegal immigrants". Times of Malta. Retrieved 30 April 2012.
- ↑ "Rescued migrants refusing to be brought to Malta". Times of Malta. 26 September 2015. Retrieved 26 September 2015.
- ↑ http://unstats.un.org/unsd/demographic/products/dyb/dybsets/1948%20DYB.pdf United Nations. Demographic Yearbook 1948
- ↑ National Statistics Office Malta