Demographics of Austria
This article is about the demographic features of the population of Austria, including population density, ethnicity, education level, health of the populace, economic status, religious affiliations and other aspects of the population.
Austrians are a homogeneous people, although four decades of strong immigration have significantly changed the composition of the population of Austria.
According to the 2001 population census, 88.6% are native German speakers (96% Austro-Bavarian dialects and 4% Alemanic dialects) while the remaining 11.4% speak several minority languages. The non-German speakers of Austria can be divided into two groups: traditional minorities, who are related to territories formerly part of the Habsburg Monarchy, and new minorities, resulting from recent immigration.
Population


The following demographic statistics are from the CIA World Factbook and Statistik Austria.
Nationality
- noun: Austrian(s)
- adjective: Austrian
Population
- 8,572,895 (2014 est.)
- country comparison to the world: 93
Age structure
- 0-14 years: 13.6% (male 573,146/female 546,596)
- 15-24 years: 11.6% (male 488,564/female 468,891)
- 25-54 years: 42.9% (male 1,766,729/female 1,756,880)
- 55-64 years: 12.7% (male 515,913/female 528,988)
- 65 years and over: 19.2% (male 670,750/female 906,605) (2014 est.)
- 0–14 years: 14.5% (male 609,748/female 581,144)
- 15–64 years: 67.5% (male 2,785,091/female 2,756,402)
- 65 years and over: 18% (male 612,613/female 865,283) (2009 est.)
- 0-14 years: 14% (male 590,855/female 563,300)
- 15-64 years: 67.7% (male 2,793,725/female 2,769,840)
- 65 years and over: 18.2% (male 627,456/female 872,104) (2011 est.)
Median age
- Total: 44.3 years
- Male: 43.2 years
- Female: 45.3 years (2014 est.)
- Total: 43 years
- Male: 41.9 years
- Female: 44 years (2011 est.)
Birth rate
- 8.76 births/1,000 population (2014 est.)
- country comparison to the world: 214
Death rate
- 10.38 deaths/1,000 population (July 2014 est.)
- country comparison to the world: 42
Net migration rate
- 1.76 migrant(s)/1,000 population (2014 est.)
- country comparison to the world: 50
Population growth rate
- 0.01% (2014 est.)
- country comparison to the world: 191
Total fertility rate
- 1.43 children born/woman (2012 est.)
- country comparison to the world: 202
Urbanization
- Urban population: 67.7% of total population (2011)
- Rate of urbanization: 0.48% annual rate of change (2010-15 est.)
Sex ratio
- At birth: 1.05 male(s)/female
- 0-14 years: 1.05 male(s)/female
- 15-24 years: 1.04 male(s)/female
- 25-54 years: 1.01 male(s)/female
- 55-64 years: 0.95 male(s)/female
- 65 years and over: 0.73 male(s)/female
- Total population: 0.95 male(s)/female (2014 est.)
Infant mortality rate
- Total: 4.16 deaths/1,000 live births
- country comparison to the world: 196
- Male: 5.01 deaths/1,000 live births
- Female: 3.27 deaths/1,000 live births (2014 est.)
Maternal mortality rate
- 4 deaths/100,000 live births (2010)
- country comparison to the world: 178
Life expectancy at birth
- Total population: 80.17 years
- country comparison to the world: 32
- Male: 77.25 years
- Female: 83.24 years (2014 est.)
HIV/AIDS
- Adult prevalence rate: 0.3% (2009 est.)
- country comparison to the world: 90
- People living with HIV/AIDS: 15,000 (2009 est.)
- country comparison to the world: 84
- New Infections with HIV/AIDS: 453 (2005)
- Deaths: 54 (2004)
Health expenditures
- 11% of GDP (2009)
- country comparison to the world: 20
Physicians density
- 4.749 physicians/1,000 population (2009)
- country comparison to the world: 6
Hospital bed density
- 7.6 beds/1,000 population (2010)
- country comparison to the world: 9
Education expenditures
- 5.9% of GDP (2007)
- country comparison to the world: 44
Literacy
- Definition: age 15 and over can read and write
- Total population: 98%
- Male: NA%
- Female: NA%
- Illiterates: some 3–4% of Austrians are functionally illiterate[1]
Vital statistics since 1900
Data according to Statistik Austria.[2]
| Average population (x 1000) | Live births | Deaths | Natural change | Crude birth rate (per 1000) | Crude death rate (per 1000) | Natural change (per 1000) | Total fertility rate | Infant mortality rate (per 1000 births) | Life expectancy males | Life expectancy females | Net reproduction rate | |
|---|---|---|---|---|---|---|---|---|---|---|---|---|
| 1900 | 5 973 | 187 094 | 138 509 | 48 585 | 31.3 | 23.2 | 8.1 | |||||
| 1901 | 6 035 | 189 539 | 134 234 | 55 305 | 31.4 | 22.2 | 9.2 | |||||
| 1902 | 6 099 | 191 926 | 134 479 | 57 447 | 31.5 | 22.0 | 9.4 | |||||
| 1903 | 6 164 | 184 244 | 133 435 | 50 809 | 29.9 | 21.6 | 8.2 | |||||
| 1904 | 6 228 | 187 963 | 131 309 | 56 654 | 30.2 | 21.1 | 9.1 | |||||
| 1905 | 6 292 | 181 685 | 142 673 | 39 012 | 28.9 | 22.7 | 6.2 | |||||
| 1906 | 6 357 | 184 477 | 129 084 | 55 393 | 29.0 | 20.3 | 8.7 | |||||
| 1907 | 6 421 | 181 026 | 132 006 | 49 020 | 28.2 | 20.6 | 7.6 | |||||
| 1908 | 6 485 | 184 477 | 136 434 | 48 043 | 28.4 | 21.0 | 7.4 | |||||
| 1909 | 6 550 | 180 106 | 134 152 | 45 954 | 27.5 | 20.5 | 7.0 | |||||
| 1910 | 6 614 | 176 588 | 127 243 | 49 345 | 26.7 | 19.2 | 7.5 | |||||
| 1911 | 6 669 | 168 916 | 132 615 | 36 301 | 25.3 | 19.9 | 5.4 | |||||
| 1912 | 6 724 | 170 555 | 122 759 | 47 796 | 25.4 | 18.3 | 7.1 | |||||
| 1913 | 6 767 | 163 354 | 124 388 | 38 966 | 24.1 | 18.4 | 5.8 | |||||
| 1914 | 6 680 | 161 692 | 124 560 | 37 132 | 24.2 | 18.6 | 5.6 | |||||
| 1915 | 6 690 | 125 680 | 144 259 | -18 579 | 18.8 | 21.6 | -2.8 | |||||
| 1916 | 6 660 | 98 895 | 139 324 | -40 429 | 14.8 | 20.9 | -6.1 | |||||
| 1917 | 6 610 | 92 289 | 150 346 | -58 057 | 14.0 | 22.7 | -8.8 | |||||
| 1918 | 6 543 | 92 560 | 172 573 | -80 013 | 14.1 | 26.4 | -12.2 | |||||
| 1919 | 6 420 | 118 518 | 130 658 | -12 140 | 18.5 | 20.4 | -1.9 | |||||
| 1920 | 6 455 | 146 644 | 122 775 | 23 869 | 22.7 | 19.0 | 3.7 | |||||
| 1921 | 6 504 | 151 138 | 110 451 | 40 687 | 23.2 | 17.0 | 6.3 | |||||
| 1922 | 6 528 | 150 958 | 113 467 | 37 491 | 23.1 | 17.4 | 5.7 | |||||
| 1923 | 6 543 | 146 885 | 99 924 | 46 961 | 22.4 | 15.3 | 7.2 | |||||
| 1924 | 6 562 | 142 141 | 98 055 | 44 086 | 21.7 | 14.9 | 6.7 | |||||
| 1925 | 6 582 | 135 841 | 94 988 | 40 853 | 20.6 | 14.4 | 6.2 | |||||
| 1926 | 6 603 | 127 250 | 98 905 | 28 345 | 19.3 | 15.0 | 4.3 | |||||
| 1927 | 6 623 | 118 669 | 99 080 | 19 589 | 17.9 | 15.0 | 3.0 | |||||
| 1928 | 6 643 | 116 729 | 95 959 | 20 770 | 17.6 | 14.4 | 3.1 | |||||
| 1929 | 6 664 | 112 047 | 97 300 | 14 747 | 16.8 | 14.6 | 2.2 | |||||
| 1930 | 6 684 | 112 330 | 90 315 | 22 015 | 16.8 | 13.5 | 3.3 | |||||
| 1931 | 6 705 | 106 324 | 93 895 | 12 429 | 15.9 | 14.0 | 1.9 | |||||
| 1932 | 6 725 | 102 277 | 93 599 | 8 678 | 15.2 | 13.9 | 1.3 | |||||
| 1933 | 6 746 | 96 369 | 88 977 | 7 392 | 14.3 | 13.2 | 1.1 | |||||
| 1934 | 6 755 | 91 567 | 85 685 | 5 882 | 13.6 | 12.7 | 0.9 | |||||
| 1935 | 6 761 | 88 689 | 92 524 | -3 835 | 13.1 | 13.7 | -0.6 | |||||
| 1936 | 6 758 | 88 264 | 89 078 | - 814 | 13.1 | 13.2 | -0.1 | |||||
| 1937 | 6 755 | 86 351 | 90 035 | -3 684 | 12.8 | 13.3 | -0.5 | |||||
| 1938 | 6 753 | 93 812 | 94 755 | - 943 | 13.9 | 14.0 | -0.1 | |||||
| 1939 | 6 658 | 137 825 | 101 709 | 36 116 | 20.7 | 15.3 | 5.4 | |||||
| 1940 | 6 705 | 145 926 | 99 475 | 46 451 | 21.8 | 14.8 | 6.9 | |||||
| 1941 | 6 731 | 135 398 | 94 121 | 41 277 | 20.1 | 14.0 | 6.1 | |||||
| 1942 | 6 799 | 116 172 | 90 510 | 25 662 | 17.1 | 13.3 | 3.8 | |||||
| 1943 | 6 815 | 122 443 | 94 269 | 28 174 | 18.0 | 13.8 | 4.1 | |||||
| 1944 | 6 837 | 126 938 | 109 622 | 17 316 | 18.6 | 16.0 | 2.5 | |||||
| 1945 | 6 793 | 101 369 | 173 767 | -72 398 | 14.9 | 25.6 | -10.7 | |||||
| 1946 | 7 000 | 111 302 | 94 077 | 17 225 | 15.9 | 13.4 | 2.5 | 2.01 | 81.4 | |||
| 1947 | 6 971 | 128 953 | 90 027 | 38 926 | 18.5 | 12.9 | 5.6 | 2.35 | 78.3 | |||
| 1948 | 6 953 | 123 221 | 84 213 | 39 008 | 17.7 | 12.1 | 5.6 | 2.25 | 76.2 | |||
| 1949 | 6 942 | 113 375 | 89 247 | 24 128 | 16.3 | 12.9 | 3.5 | 2.07 | 75.2 | |||
| 1950 | 6 935 | 107 854 | 85 710 | 22 144 | 15.6 | 12.4 | 3.2 | 2.09 | 66.1 | |||
| 1951 | 6 934 | 102 764 | 88 253 | 14 511 | 14.8 | 12.7 | 2.1 | 2.02 | 61.3 | |||
| 1952 | 6 928 | 103 012 | 83 372 | 19 640 | 14.9 | 12.0 | 2.8 | 2.06 | 51.9 | |||
| 1953 | 6 932 | 102 867 | 83 399 | 19 468 | 14.8 | 12.0 | 2.8 | 2.09 | 49.9 | |||
| 1954 | 6 940 | 103 985 | 84 632 | 19 353 | 15.0 | 12.2 | 2.8 | 2.15 | 48.3 | |||
| 1955 | 6 947 | 108 575 | 84 995 | 23 580 | 15.6 | 12.2 | 3.4 | 2.29 | 45.6 | |||
| 1956 | 6 952 | 115 827 | 86 824 | 29 003 | 16.7 | 12.5 | 4.2 | 2.48 | 43.3 | |||
| 1957 | 6 966 | 118 712 | 89 298 | 29 414 | 17.0 | 12.8 | 4.2 | 2.57 | 44.2 | |||
| 1958 | 6 987 | 119 755 | 85 980 | 33 775 | 17.1 | 12.3 | 4.8 | 2.60 | 40.7 | |||
| 1959 | 7 014 | 124 377 | 87 970 | 36 407 | 17.7 | 12.5 | 5.2 | 2.69 | 39.8 | |||
| 1960 | 7 048 | 125 945 | 89 603 | 36 342 | 17.9 | 12.7 | 5.2 | 2.70 | 37.5 | |||
| 1961 | 7 087 | 131 563 | 85 673 | 45 890 | 18.6 | 12.1 | 6.5 | 2.79 | 32.7 | 1.29 | ||
| 1962 | 7 130 | 133 253 | 90 854 | 42 399 | 18.7 | 12.7 | 5.9 | 2.80 | 32.8 | 1.30 | ||
| 1963 | 7 176 | 134 809 | 91 579 | 43 230 | 18.8 | 12.8 | 6.0 | 2.82 | 31.3 | 1.31 | ||
| 1964 | 7 224 | 133 841 | 89 081 | 44 760 | 18.6 | 12.3 | 6.2 | 2.80 | 29.2 | 1.30 | ||
| 1965 | 7 271 | 129 924 | 94 273 | 35 651 | 17.9 | 13.0 | 4.9 | 2.71 | 28.3 | 1.26 | ||
| 1966 | 7 322 | 128 577 | 91 440 | 37 137 | 17.6 | 12.5 | 5.1 | 2.66 | 28.1 | 1.24 | ||
| 1967 | 7 377 | 127 404 | 95 438 | 31 966 | 17.4 | 13.0 | 4.4 | 2.62 | 26.4 | 1.23 | ||
| 1968 | 7 415 | 126 115 | 96 014 | 30 101 | 17.1 | 13.0 | 4.1 | 2.59 | 25.5 | 1.21 | ||
| 1969 | 7 441 | 121 377 | 98 715 | 22 662 | 16.4 | 13.4 | 3.1 | 2.50 | 25.4 | 1.17 | ||
| 1970 | 7 467 | 112 301 | 98 819 | 13 482 | 15.1 | 13.3 | 1.8 | 2.29 | 25.9 | 66.5 | 73.4 | 1.07 |
| 1971 | 7 500 | 108 510 | 97 334 | 11 176 | 14.6 | 13.1 | 1.5 | 2.20 | 26.1 | 66.6 | 73.7 | 1.03 |
| 1972 | 7 544 | 104 033 | 95 323 | 8 710 | 13.9 | 12.7 | 1.2 | 2.09 | 25.2 | 66.9 | 74.0 | 0.98 |
| 1973 | 7 586 | 98 041 | 92 768 | 5 273 | 13.0 | 12.3 | 0.7 | 1.94 | 23.8 | 67.5 | 74.6 | 0.91 |
| 1974 | 7 599 | 97 430 | 94 324 | 3 106 | 12.9 | 12.5 | 0.4 | 1.91 | 23.5 | 67.5 | 74.7 | 0.90 |
| 1975 | 7 579 | 93 757 | 96 041 | -2 284 | 12.4 | 12.7 | -0.3 | 1.83 | 20.5 | 67.7 | 74.7 | 0.86 |
| 1976 | 7 566 | 87 446 | 95 140 | -7 694 | 11.6 | 12.6 | -1.0 | 1.69 | 18.2 | 68.2 | 75.1 | 0.80 |
| 1977 | 7 568 | 85 595 | 92 402 | -6 807 | 11.3 | 12.2 | -0.9 | 1.63 | 16.8 | 68.5 | 75.5 | 0.77 |
| 1978 | 7 562 | 85 402 | 94 617 | -9 215 | 11.3 | 12.5 | -1.2 | 1.61 | 15.0 | 68.5 | 75.7 | 0.76 |
| 1979 | 7 549 | 86 388 | 92 012 | -5 624 | 11.4 | 12.2 | -0.7 | 1.60 | 14.7 | 68.8 | 76.0 | 0.76 |
| 1980 | 7 549 | 90 872 | 92 442 | -1 570 | 12.0 | 12.2 | -0.2 | 1.65 | 14.3 | 69.0 | 76.1 | 0.78 |
| 1981 | 7 569 | 93 867 | 92 585 | 1 282 | 12.4 | 12.2 | 0.2 | 1.67 | 12.7 | 69.3 | 76.4 | 0.80 |
| 1982 | 7 574 | 94 840 | 91 339 | 3 501 | 12.5 | 12.1 | 0.5 | 1.66 | 12.8 | 69.4 | 76.6 | 0.79 |
| 1983 | 7 562 | 90 118 | 93 041 | -2 923 | 11.9 | 12.3 | -0.4 | 1.56 | 11.9 | 69.5 | 76.6 | 0.74 |
| 1984 | 7 561 | 89 234 | 88 466 | 768 | 11.8 | 11.7 | 0.1 | 1.52 | 11.4 | 70.0 | 77.2 | 0.73 |
| 1985 | 7 565 | 87 440 | 89 578 | -2 138 | 11.6 | 11.8 | -0.3 | 1.47 | 11.2 | 70.4 | 77.3 | 0.70 |
| 1986 | 7 570 | 86 964 | 87 071 | - 107 | 11.5 | 11.5 | -0.0 | 1.45 | 10.3 | 70.9 | 77.7 | 0.69 |
| 1987 | 7 575 | 86 503 | 84 907 | 1 596 | 11.4 | 11.2 | 0.2 | 1.43 | 9.8 | 71.4 | 78.1 | 0.68 |
| 1988 | 7 585 | 88 052 | 83 263 | 4 789 | 11.6 | 11.0 | 0.6 | 1.45 | 8.1 | 71.9 | 78.6 | 0.69 |
| 1989 | 7 620 | 88 759 | 83 407 | 5 352 | 11.6 | 10.9 | 0.7 | 1.44 | 8.3 | 71.9 | 78.7 | 0.69 |
| 1990 | 7 678 | 90 454 | 82 952 | 7 502 | 11.8 | 10.8 | 1.0 | 1.46 | 7.8 | 72.2 | 78.9 | 0.70 |
| 1991 | 7 755 | 94 629 | 83 428 | 11 201 | 12.2 | 10.8 | 1.4 | 1.51 | 7.5 | 72.3 | 79.0 | 0.72 |
| 1992 | 7 841 | 95 302 | 83 162 | 12 140 | 12.2 | 10.6 | 1.5 | 1.51 | 7.5 | 72.5 | 79.2 | 0.72 |
| 1993 | 7 906 | 95 227 | 82 517 | 12 710 | 12.0 | 10.4 | 1.6 | 1.50 | 6.5 | 72.8 | 79.4 | 0.72 |
| 1994 | 7 936 | 92 415 | 80 684 | 11 731 | 11.6 | 10.2 | 1.5 | 1.47 | 6.3 | 73.1 | 79.7 | 0.70 |
| 1995 | 7 948 | 88 669 | 81 171 | 7 498 | 11.2 | 10.2 | 0.9 | 1.42 | 5.4 | 73.3 | 80.0 | 0.68 |
| 1996 | 7 959 | 88 809 | 80 790 | 8 019 | 11.2 | 10.2 | 1.0 | 1.45 | 5.1 | 73.7 | 80.1 | 0.69 |
| 1997 | 7 968 | 84 045 | 79 432 | 4 613 | 10.5 | 10.0 | 0.6 | 1.39 | 4.7 | 74.0 | 80.6 | 0.67 |
| 1998 | 7 977 | 81 233 | 78 339 | 2 894 | 10.2 | 9.8 | 0.4 | 1.37 | 4.9 | 74.5 | 80.8 | 0.66 |
| 1999 | 7 992 | 78 138 | 78 200 | - 62 | 9.8 | 9.8 | 0.0 | 1.34 | 4.4 | 74.8 | 80.9 | 0.64 |
| 2000 | 8 012 | 78 268 | 76 780 | 1 488 | 9.8 | 9.6 | 0.2 | 1.36 | 4.8 | 75.1 | 81.1 | 0.66 |
| 2001 | 8 042 | 75 458 | 74 767 | 691 | 9.4 | 9.3 | 0.1 | 1.33 | 3.7 | 75.6 | 81.6 | 0.64 |
| 2002 | 8 082 | 78 399 | 76 131 | 2 268 | 9.7 | 9.4 | 0.3 | 1.39 | 4.3 | 75.8 | 81.7 | 0.67 |
| 2003 | 8 121 | 76 944 | 77 209 | - 265 | 9.5 | 9.5 | -0.0 | 1.38 | 4.0 | 75.9 | 81.5 | 0.66 |
| 2004 | 8 172 | 78 968 | 74 292 | 4 676 | 9.7 | 9.1 | 0.6 | 1.42 | 4.0 | 76.4 | 82.1 | 0.68 |
| 2005 | 8 228 | 78 190 | 75 189 | 3 001 | 9.5 | 9.1 | 0.4 | 1.41 | 3.7 | 76.6 | 82.2 | 0.68 |
| 2006 | 8 269 | 77 914 | 74 295 | 3 619 | 9.4 | 9.0 | 0.4 | 1.41 | 4.0 | 77.1 | 82.7 | 0.68 |
| 2007 | 8 301 | 76 250 | 74 625 | 1 625 | 9.2 | 9.0 | 0.2 | 1.38 | 3.8 | 77.3 | 82.8 | 0.67 |
| 2008 | 8 337 | 77 752 | 75 083 | 2 669 | 9.3 | 9.0 | 0.3 | 1.41 | 3.3 | 77.6 | 83.0 | 0.68 |
| 2009 | 8 363 | 76 344 | 77 381 | -1 037 | 9.1 | 9.3 | -0.2 | 1.39 | 3.7 | 77.4 | 82.9 | 0.67 |
| 2010 | 8 388 | 78 742 | 77 199 | 1 543 | 9.4 | 9.2 | 0.2 | 1.44 | 3.8 | 77.7 | 83.2 | 0.69 |
| 2011 | 8 421 | 78 109 | 76 479 | 1 630 | 9.3 | 9.1 | 0.2 | 1.43 | 3.8 | 78.1 | 83.4 | 0.69 |
| 2012 | 8 464 | 78 952 | 79 436 | -484 | 9.3 | 9.4 | -0.1 | 1.43 | 3.2 | 78.3 | 83.3 | |
| 2013 | 8 518 | 79 330 | 79 526 | -196 | 9.3 | 9.3 | -0.0 | 1.45 | 3.1 | |||
| 2014 | 8 584 | 81 722 | 78 252 | 3 470 | 9.6 | 9.1 | 0.5 | 1.46 | ||||
| 2015 | 8 700 | 84 381 | 83 073 | 1 308 | 9.7 | 9.5 | 0.2 | 1.50 |
Current natural increase [3]
- Number of births January-June 2015 =
 41,155
 - Number of births January-June 2016 = 42,341
- Number of deaths January-June 2015 =
 43,208
 - Number of deaths January-June 2016 =
 40,044
- Natural population growth January-June 2015 =
 -2,053
 - Natural population growth January-June 2016 = 2,297
Fertility
- Total Fertility Rate by religion:
2001: Roman Catholic – 1.52; Protestant – 1.21; Islam – 2.23 Other religions – 1.44; Nonreligious – 1.34
2015: Roman Catholic – 1.74; Protestant – 1.53; Islam – 1.47 Other religions – 1.31; Nonreligious – 1.16
Note that the Muslim population in Austria in 2015 is mostly Turks and Bosniaks, who have transitioned to low birth rates.
In 2014, 81,722 new babies were born in Austria, of which, 11,029 had a Muslim mother, 45,500 had a Roman Catholic mother, 2,936 had a Protestant mother, and 22,257 had either a nonreligious mother or one of another religion.
[4]
- Births out of wedlock – 38.4%
Total Fertility Rate by state (2013):
Upper Austria: 1.46
Lower Austria: 1.69
Burgenland: 1.77
Styria: 1.36
Carinthia: 1.34
Salzburg: 1.48
Tyrol: 1.68
Vorarlberg: 1.37
Vienna: 1.25
Total Austria: 1.43
Ethnic groups
Traditional ethnic minorities in Austria
Only three numerically significant traditional minority groups exist – 14,000 Carinthian Slovenes (according to the 2001 census – unofficial estimates of Slovene organisations put the number at 50,000) in Austrian Carinthia (south central Austria) and about 25,000 Croats and 20,000 Hungarians in Burgenland (on the Hungarian border). The Slovenes (also called 'Windischer') form a closely knit community. Their rights as well as those of the Croats are protected by law and generally respected in practice. The present boundaries of Austria, once the center of the Habsburg Empire that constituted the second-largest state in Europe, were established in accordance with the Treaty of Saint-Germain-en-Laye in 1919. Some Austrians, particularly near Vienna, still have relatives in countries that made up the Monarchy, namely Croatia, Czech Republic, Slovakia, Slovenia and Hungary.
New ethnic minorities in Austria
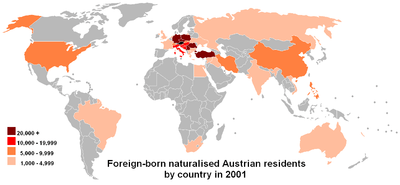
According to the Austrian Statistical Bureau, 814,800 foreigners legally lived in Austria in mid-2006, representing 9.8% of the total population, one of the highest rates in Europe.
Of these foreign residents, 305,100 came from the former Yugoslavia and 110,800 from Turkey.
Owing to a growing naturalization rate, 330,000 people have been naturalized between 1985 and the end of 2003, representing about 4% of the 7.4 million Austrian citizens living today in the country.
Of these new citizens 110,000 came from the former Yugoslavia and 90,000 from Turkey. Considering pre-1985 naturalizations, in 2005 at least 18% (in Vienna more than 30%) of the population was either foreign or of foreign origin. Native Austrians have had stagnant demographics since World War I, and have been in absolute decline since the 1970s.
Immigration
As of 2011, Statistik Austria official estimates have shown that 81% of residents, or 6.75 million[6] had no migration background and more than 19% or 1.6 million inhabitants[6] had at least one parent of immigrant background. There are more than 415,000 descendants of foreign-born immigrants[6] residing in Austria, the great majority of whom have been naturalized.
According to Eurostat, there were 1.27 million foreign-born residents in Austria in 2010, corresponding to 15.2% of the total population. Of these, 764,000 (9.1%) were born outside the EU and 512,000 (6.1%) were born in another EU member state.[7]
350,000 ethnic Turks[8] (including a minority of Turkish Kurds) currently live in Austria. At about 3% of the total population, they make up the biggest single ethnic minority in Austria.
13,000 Turks were naturalized in 2003 and an unknown number arrived in Austria at the same time. While 2,000 Turks left Austria in the same year, 10,000 arrived in the country, confirming a strong trend of growth.[9]
Languages
- German (official nationwide) 88.8% (94% Bavarian, 6% Alemanic)
- Serbian 2.4%
- Turkish 2.3%
- Croatian 1.3% (official in Burgenland)
- Slovene (official in Carinthia) 0.2–0.5%
- Hungarian (official in Burgenland) 0.2%
- Czech 0.2%
- Slovak 0.1%
- Yiddish ?%
- Romany ?%
- Languages of the recent immigrant groups around 10% (Census 2001)
The role of religion
About 73.6% of all Austrians are Roman Catholic.[10] The church abstains from political activity; however, lay Catholic organizations are aligned with the conservative People's Party. The Social Democratic Party continues to have an anticlerical stance. Small Lutheran minorities are located mainly in Vienna, Carinthia, and Burgenland. An estimated 15,000 Jews or adherents of Judaism live in Austria, primarily in Vienna – a remnant of the post-World War II community after the Nazi Holocaust. Immigration during the last decades has increased the percentage of Muslims to 4.2%.[10]
- Roman Catholic 73.6%, Protestant 4.7%, Muslim 4.2%, in 2014 about 600,000-650,000, about 7.5% (other 3.5%, unspecified 2%, none 12%[11])
- Roman Catholicism in Austria
- Buddhism in Austria
- Hinduism in Austria
- Islam in Austria
- History of the Jews in Austria
- Pre-Christian Alpine traditions
References
 This article incorporates public domain material from the CIA World Factbook document "2006 edition".
- ↑ http://science.orf.at/science/lenz/117377
- ↑ Statistik Austria
- ↑ "Population". Statistics Austria. Retrieved 5 November 2016.
- ↑ http://statcube.at/superwebguest/autoLoad.do?db=degeborene_ext
- ↑ http://paa2007.princeton.edu/download.aspx?submissionId=70869
- 1 2 3 http://medienservicestelle.at/migration_bewegt/wp-content/uploads/2012/07/IBIB_2012_Integrationsbericht.pdf STATISTIK AUSTRIA Kommission für Migrations- und Integrationsforschung der Österreichischen Akademie der Wissenschaften, Wien 2012,p23.
- ↑ 6.5% of the EU population are foreigners and 9.4% are born abroad, Eurostat, Katya VASILEVA, 34/2011.
- ↑ BBC (2010-11-10). "Turkey's ambassador to Austria prompts immigration spat". BBC News. Retrieved 2010-11-10.
- ↑ http://news.bbc.co.uk/1/hi/world/europe/2593717.stm
- 1 2 CIA World Factbook
- ↑ http://www.statistik.at/gz/vz_religion.shtml 2001 census]
Further reading
- Statistik Austria – Census 2001
- Statistik Austria – Monthly Statistical Tables – Vital Statistics
- Statistik Austria – Quarterly Population Estimates
- Website of the VID (Vienna Institute of Demography)
External links
| Wikimedia Commons has media related to Demographics of Austria. |
|