Demographics of Greece
| Demographics of the Hellenic Republic | |
|---|---|
 | |
| Population | 10,955,000 (2015 est.)[1] |
| Growth rate | -1.01 people/1,000 population (2010 est.) |
| Birth rate | 9.45 births/1,000 population (2010 est.) |
| Death rate | 10.51 deaths/1,000 population (July 2010 est.) |
| Life expectancy | 79.66 years |
| • male | 77.11 years |
| • female | 82.37 years (2010 est.) |
| Fertility rate | 1.42 children born/woman (2011 est.)[2] |
| Infant mortality rate | 4.92 deaths per 1,000 live births (2012 est.)[3] |
| Age structure | |
| 0–14 years | 14.4% |
| 15–64 years | 66.6% |
| 65 and over | 19.0% |
| Sex ratio | |
| At birth | 1.06 male(s)/female (2008 est.) |
| Under 15 | 1.06 male(s)/female |
| 15–64 years | 1.00 male(s)/female |
| 65 and over | 0.78 male(s)/female |
| Nationality | |
| Nationality | noun: Greek(s) adjective: Greek |
| Major ethnic | Greeks |
| Minor ethnic | Albanians, Roma, Turks, Bulgarians and Pomaks,[4] Romanians, Russians, Georgians and Armenians[5] |
| Language | |
| Official | Greek |
| Spoken | Greek (Majority), Arvanitika, Macedonian/Bulgarian, Pomak, Aromanian, Turkish |
This article is about the demographic features of the population of Greece, including ethnicity, education level, health of the populace, economic status, religious affiliations and other aspects of the population.
The Demographics of Greece refer to the demography of the population that inhabits the Greek peninsula. The population of Greece was estimated by the United Nations to 10,955,000 in 2015.
Historical overview
Greece was inhabited as early as the Paleolithic period. Prior to the 2nd millennium BC, the Greek peninsula was inhabited by various pre-Hellenic peoples, the most notable of which were the Pelasgians. The Greek language ultimately dominated the peninsula and Greece's mosaic of small city-states became culturally similar. The population estimates on the Greeks during the 4th century BC, is approximately 3.5 million on the Greek peninsula and 4 to 6.5 million in the rest of the entire Mediterranean Basin,[6] including all colonies such as those in Magna Graecia, Asia Minor and the shores of the Black Sea.
During the history of the Byzantine Empire, the Greek peninsula was occasionally invaded by the foreign peoples like Goths, Avars, Slavs, Normans, Franks and other Romance-speaking peoples who had betrayed the Crusades. The only group, however, that planned to establish permanent settlements in the region were the Slavs. They settled in isolated valleys of the Peloponnese and Thessaly, establishing segregated communities that were referred by the Byzantines as Sclaveni. Traces of Slavic culture in Greece are very rare and by the 9th century, the Sclaveni in Greece were largely assimilated. However, some Slavic communities managed to survive in rural Macedonia. At the same time a large Sephardi Jewish emigrant community from the Iberian peninsula established itself in Thessaloniki, while there were population movements of Arvanites and Vlachs, who established communities in several parts of the Greek peninsula. The Byzantine Empire ultimately fell to Ottoman Turks in the 15th century and as a result Ottoman colonies were established in the Balkans, notably in Macedonia, the Peloponnese and Crete. Many Greeks either fled to other European nations or to geographically isolated areas (i.e. mountains and heavily forested territories) in order to escape foreign rule. For those reasons, the population decreased in the plains, while increasing on the mountains. The population transfers with Bulgaria and Turkey that took place in the early 20th century, added in total some two million Greeks from to the demography of the Greek Kingdom.
Urbanization
| | |||||||||
|---|---|---|---|---|---|---|---|---|---|
| Rank | Name | Region | Pop. | ||||||
.jpg) Athens  Thessaloniki |
1 | Athens | Attica | 3,168,846 | 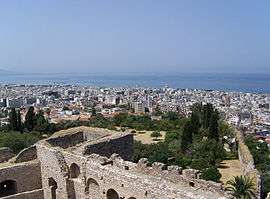 Patras 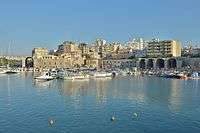 Heraklion | ||||
| 2 | Thessaloniki | Central Macedonia | 806,635 | ||||||
| 3 | Patras | Western Greece | 195,265 | ||||||
| 4 | Heraklion | Crete | 157,452 | ||||||
| 5 | Larissa | Thessaly | 144,651 | ||||||
| 6 | Volos | Thessaly | 130,094 | ||||||
| 7 | Acharnes | Attica | 100,723 | ||||||
| 8 | Chania | Crete | 88,525 | ||||||
| 9 | Ioannina | Epirus | 85,803 | ||||||
| 10 | Chalcis | Central Greece | 74,564 | ||||||
Population

According to the 2001 census the population of Greece was 10,964,020. Eurostat estimations as of January 2008 gave the number of 11,214,992 inhabitants in the Greek peninsula. According to the official 2011 census, which used sophisticated methodology, the population of Greece was 10,816,286.
| Census | Population | Change |
| 1971 | 8,768,372 | - |
| 1981 | 9,739,589 | 11.1% |
| 1991 | 10,259,900 | 5.3% |
| 2001 | 10,964,020 | 6.9% |
| 2011 | 10,816,286 | -0.88% |
By region
Greece is divided into nine geographic regions. The population of each region according to the 2001 census:
| Region | Population |
|---|---|
| Aegean Islands | 508,807 |
| Central Greece | 4,591,568 |
| Crete | 601,131 |
| Epirus | 353,822 |
| Ionian Islands | 212,984 |
| Macedonia | 2,424,765 |
| Peloponnese | 1,155,019 |
| Thessaly | 753,888 |
| Thrace | 362,038 |
| Total | 10,964,020 |
Cyprus 2250000
Age structure
Being part of the phenomenon of the aging of Europe, the Greek population shows a rapid increase of the percentage of the elderly people. Greece's population census of 1961 found that 10.9% of the total population was above the age of 65, while the percentage of this group age increased to 19.0% in 2011. On the contrary, the percentage of the population of the ages 0–14 had a total decrease of 10.2% between 1961 and 2011.
| Age group | 1971 | 1981 | 1991 | 2001 | 2011 | |||||
|---|---|---|---|---|---|---|---|---|---|---|
| Population | % | Population | % | Population | % | Population | % | Population | % | |
| 0–14 | 2,223,904 | 25.4 | 2,307,297 | 23.7 | 1,974,867 | 19.2 | 1,664,085 | 15.2 | 1,576,500 | 14.4 |
| 15–64 | 5,587,352 | 63.7 | 6,192,751 | 63.6 | 6,880,681 | 67.1 | 7,468,395 | 68.1 | 7,122,830 | 66.6 |
| 65+ | 957,116 | 10.9 | 1,239,541 | 12.7 | 1,404,352 | 13.7 | 1,831,540 | 16.7 | 2,108,807 | 19.0 |
| Total | 8,768,372 | 9,739,589 | 10,259,900 | 10,964,020 | 10,816,286 | |||||
Vital statistics[8][9][10]
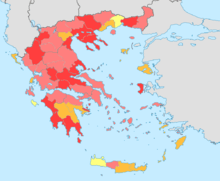
|
1.5 - 1.7
1.4 - 1.5
1.3 - 1.4
< 1.3 |
| Average population (x 1000) | Live births | Deaths | Natural change | Crude birth rate (per 1000) | Crude death rate (per 1000) | Natural change (per 1000) | Fertility rates | |
|---|---|---|---|---|---|---|---|---|
| 1921 | 5 050 | 107 000 | 69 000 | 38 000 | 21.2 | 13.7 | 7.5 | |
| 1922 | 5 097 | 110 000 | 82 000 | 18 000 | 21.6 | 16.1 | 3.5 | |
| 1923 | 6 010 | 113 926 | 102 042 | 11 884 | 19.0 | 17.0 | 2.0 | |
| 1924 | 6 000 | 117 014 | 93 320 | 23 694 | 19.5 | 15.6 | 3.9 | |
| 1925 | 5 958 | 156 367 | 88 633 | 67 734 | 26.2 | 14.9 | 11.4 | |
| 1926 | 6 042 | 181 278 | 84 136 | 97 142 | 30.0 | 13.9 | 16.1 | |
| 1927 | 6 127 | 176 527 | 100 020 | 76 507 | 28.8 | 16.3 | 12.5 | |
| 1928 | 6 210 | 189 250 | 105 665 | 83 585 | 30.5 | 17.0 | 13.5 | |
| 1929 | 6 286 | 181 870 | 115 561 | 66 309 | 28.9 | 18.4 | 10.5 | |
| 1930 | 6 367 | 199 565 | 103 811 | 95 754 | 31.3 | 16.3 | 15.0 | |
| 1931 | 6 463 | 199 243 | 114 369 | 84 874 | 30.8 | 17.7 | 13.1 | |
| 1932 | 6 544 | 185 523 | 117 593 | 67 930 | 28.4 | 18.0 | 10.4 | |
| 1933 | 6 625 | 189 583 | 111 447 | 78 136 | 28.6 | 16.8 | 11.8 | |
| 1934 | 6 727 | 208 929 | 100 651 | 108 278 | 31.1 | 15.0 | 16.1 | |
| 1935 | 6 837 | 192 511 | 101 416 | 91 095 | 28.2 | 14.8 | 13.3 | |
| 1936 | 6 936 | 193 343 | 105 005 | 88 338 | 27.9 | 15.1 | 12.7 | |
| 1937 | 7 029 | 183 878 | 105 674 | 78 204 | 26.2 | 15.0 | 11.1 | |
| 1938 | 7 122 | 184 509 | 93 766 | 90 743 | 25.9 | 13.2 | 12.7 | |
| 1939 | 7 222 | 178 852 | 100 459 | 78 393 | 24.8 | 13.9 | 10.9 | |
| 1940 | 7 319 | 179 480 | 93 830 | 85 670 | 24.5 | 12.8 | 11.7 | |
| 1941 | 7 370 | 134 760 | 125 710 | 9 050 | 18.3 | 17.1 | 1.2 | |
| 1942 | 7 350 | 132 640 | 191 030 | -58 390 | 18.0 | 26.0 | -7.9 | |
| 1943 | 7 280 | 122 170 | 111 320 | 10 850 | 16.8 | 15.3 | 1.5 | |
| 1944 | 7 300 | 145 530 | 110 810 | 34 720 | 19.9 | 15.2 | 4.8 | |
| 1945 | 7 310 | 183 470 | 85 540 | 97 930 | 25.1 | 11.7 | 13.4 | |
| 1946 | 7 430 | 209 360 | 73 500 | 135 860 | 28.2 | 9.9 | 18.3 | |
| 1947 | 7 520 | 206 400 | 70 340 | 136 060 | 27.4 | 9.4 | 18.1 | |
| 1948 | 7 500 | 210 000 | 96 000 | 114 000 | 28.0 | 12.8 | 15.2 | |
| 1949 | 7 480 | 139 108 | 59 450 | 79 658 | 18.6 | 7.9 | 10.6 | |
| 1950 | 7 554 | 151 314 | 53 755 | 97 559 | 20.0 | 7.1 | 12.9 | |
| 1951 | 7 646 | 155 422 | 57 508 | 97 914 | 20.3 | 7.5 | 12.8 | |
| 1952 | 7 733 | 149 637 | 53 377 | 96 260 | 19.4 | 6.9 | 12.4 | |
| 1953 | 7 817 | 143 765 | 56 680 | 87 085 | 18.4 | 7.3 | 11.1 | |
| 1954 | 7 893 | 151 892 | 55 625 | 96 267 | 19.2 | 7.0 | 12.2 | |
| 1955 | 7 966 | 154 263 | 54 781 | 99 482 | 19.4 | 6.9 | 12.5 | |
| 1956 | 8 031 | 156 187 | 59 460 | 96 727 | 19.4 | 7.4 | 12.0 | |
| 1957 | 8 096 | 155 192 | 61 664 | 93 528 | 19.2 | 7.6 | 11.6 | |
| 1958 | 8 173 | 155 359 | 58 160 | 97 199 | 19.0 | 7.1 | 11.9 | |
| 1959 | 8 258 | 160 199 | 60 852 | 99 347 | 19.4 | 7.4 | 12.0 | |
| 1960 | 8 334 | 157 239 | 60 563 | 96 676 | 18.9 | 7.3 | 11.6 | 2.28 |
| 1961 | 8 398 | 150 716 | 63 955 | 86 761 | 17.9 | 7.6 | 10.3 | 2.19 |
| 1962 | 8 448 | 152 158 | 66 554 | 85 604 | 18.0 | 7.9 | 10.1 | 2.23 |
| 1963 | 8 480 | 148 249 | 66 813 | 81 436 | 17.5 | 7.9 | 9.6 | 2.22 |
| 1964 | 8 510 | 153 109 | 69 429 | 83 680 | 18.0 | 8.1 | 9.8 | 2.31 |
| 1965 | 8 551 | 151 448 | 67 269 | 84 179 | 17.7 | 7.8 | 9.8 | 2.30 |
| 1966 | 8 614 | 154 613 | 67 912 | 86 701 | 17.9 | 7.9 | 10.1 | 2.38 |
| 1967 | 8 686 | 162 839 | 71 975 | 90 864 | 18.7 | 8.3 | 10.4 | 2.55 |
| 1968 | 8 741 | 160 338 | 73 309 | 87 029 | 18.3 | 8.4 | 10.0 | 2.53 |
| 1969 | 8 773 | 154 077 | 71 825 | 82 252 | 17.6 | 8.2 | 9.4 | 2.50 |
| 1970 | 8 793 | 144 928 | 74 009 | 70 919 | 16.5 | 8.4 | 8.1 | 2.34 |
| 1971 | 8 831 | 141 126 | 73 819 | 67 307 | 16.0 | 8.4 | 7.6 | 2.30 |
| 1972 | 8 889 | 140 891 | 76 859 | 64 032 | 15.9 | 8.6 | 7.2 | 2.32 |
| 1973 | 8 929 | 137 526 | 77 648 | 59 878 | 15.4 | 8.7 | 6.7 | 2.28 |
| 1974 | 8 962 | 144 069 | 76 303 | 67 766 | 16.1 | 8.5 | 7.6 | 2.39 |
| 1975 | 9 047 | 142 273 | 80 077 | 62 196 | 15.7 | 8.9 | 6.9 | 2.33 |
| 1976 | 9 167 | 146 566 | 81 818 | 64 748 | 16.0 | 8.9 | 7.1 | 2.35 |
| 1977 | 9 269 | 143 739 | 83 750 | 59 989 | 15.4 | 9.0 | 6.4 | 2.28 |
| 1978 | 9 395 | 146 588 | 81 615 | 64 973 | 15.5 | 8.7 | 6.9 | 2.29 |
| 1979 | 9 534 | 147 965 | 82 338 | 65 627 | 15.5 | 8.6 | 6.9 | 2.26 |
| 1980 | 9 643 | 148 134 | 87 282 | 60 852 | 15.4 | 9.1 | 6.3 | 2.23 |
| 1981 | 9 729 | 140 953 | 86 261 | 54 692 | 14.5 | 8.9 | 5.6 | 2.10 |
| 1982 | 9 790 | 137 275 | 86 345 | 50 930 | 14.0 | 8.8 | 5.2 | 2.03 |
| 1983 | 9 847 | 132 608 | 90 586 | 42 022 | 13.5 | 9.2 | 4.3 | 1.94 |
| 1984 | 9 896 | 125 724 | 88 397 | 37 327 | 12.7 | 8.9 | 3.8 | 1.82 |
| 1985 | 9 934 | 116 481 | 92 886 | 23 595 | 11.7 | 9.4 | 2.4 | 1.68 |
| 1986 | 9 967 | 112 250 | 91 469 | 20 781 | 11.3 | 9.2 | 2.1 | 1.60 |
| 1987 | 10 001 | 105 899 | 95 232 | 10 667 | 10.6 | 9.5 | 1.1 | 1.50 |
| 1988 | 10 037 | 107 668 | 93 031 | 14 637 | 10.7 | 9.3 | 1.5 | 1.50 |
| 1989 | 10 090 | 101 149 | 92 717 | 8 432 | 10.0 | 9.2 | 0.8 | 1.40 |
| 1990 | 10 161 | 102 229 | 94 152 | 8 077 | 10.1 | 9.3 | 0.8 | 1.39 |
| 1991 | 10 257 | 102 620 | 95 498 | 7 122 | 10.0 | 9.3 | 0.7 | 1.38 |
| 1992 | 10 370 | 104 081 | 98 231 | 5 850 | 10.0 | 9.5 | 0.6 | 1.38 |
| 1993 | 10 466 | 101 799 | 97 419 | 4 380 | 9.7 | 9.3 | 0.4 | 1.34 |
| 1994 | 10 553 | 103 763 | 97 807 | 5 956 | 9.8 | 9.3 | 0.6 | 1.35 |
| 1995 | 10 635 | 101 495 | 100 158 | 1 337 | 9.5 | 9.4 | 0.1 | 1.32 |
| 1996 | 10 710 | 100 718 | 100 740 | - 22 | 9.4 | 9.4 | -0.0 | 1.30 |
| 1997 | 10 777 | 102 038 | 99 738 | 2 300 | 9.5 | 9.3 | 0.2 | 1.31 |
| 1998 | 10 835 | 100 894 | 102 668 | -1 774 | 9.3 | 9.5 | -0.2 | 1.29 |
| 1999 | 10 883 | 100 643 | 103 304 | -2 661 | 9.2 | 9.5 | -0.2 | 1.28 |
| 2000 | 10 918 | 103 267 | 105 219 | -1 952 | 9.5 | 9.6 | -0.2 | 1.26 |
| 2001 | 10 950 | 102 282 | 102 559 | - 277 | 9.3 | 9.4 | -0.0 | 1.25 |
| 2002 | 10 988 | 103 838 | 103 915 | - 77 | 9.5 | 9.5 | -0.0 | 1.27 |
| 2003 | 11 024 | 104 420 | 105 529 | -1 109 | 9.5 | 9.6 | -0.1 | 1.28 |
| 2004 | 11 062 | 105 655 | 104 942 | 713 | 9.6 | 9.5 | 0.1 | 1.30 |
| 2005 | 11 104 | 107 545 | 105 091 | 2 454 | 9.7 | 9.5 | 0.2 | 1.33 |
| 2006 | 11 148 | 112 042 | 105 476 | 6 566 | 10.1 | 9.5 | 0.6 | 1.40 |
| 2007 | 11 193 | 111 926 | 109 895 | 2 031 | 10.0 | 9.8 | 0.2 | 1.41 |
| 2008 | 11 237 | 118 302 | 107 979 | 10 323 | 10.5 | 9.6 | 0.9 | 1.55 |
| 2009 | 11 278 | 117 933 | 108 316 | 9 617 | 10.5 | 9.6 | 0.9 | 1.57 |
| 2010 | 11 290 | 114 766 | 109 084 | 5 682 | 10.2 | 9.7 | 0.5 | 1.53 |
| 2011 | 10 816 | 106 428 | 111 099 | -4 671 | 9.8 | 10.3 | -0.5 | 1.42 |
| 2012[11] | 11 123 | 100 371 | 116 670 | -16 299 | 9.1 | 10.6 | -1.5 | 1.34 |
| 2013[12] | 11 062 | 94 134 | 111 794 | -17 660 | 8.5 | 10.2 | -1.7 | 1.28 |
| 2014[13] | 10 858 | 93 429 | 114 088 | -20 659 | 8.4 | 10.4 | -2.0 | 1.30 |
| 2015[14] | 10 793 | 91 900 | 120 800 | -29 000 | 8.5 | 11.2 | -2.7 | |
Immigration
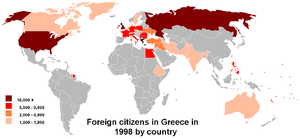
Greece has received a large number of immigrants since the early 1990s. The majority of them come from the neighbouring countries. As of 2011, the number of foreigners in an enumerated total of 10,815,197 people was 911,299.
| Citizenship | Census 2011 | % |
|---|---|---|
| |
9,903,268 | 91.56 |
| |
480,824 | 4.45 |
| |
75,915 | 0.70 |
| |
46,523 | 0.43 |
| |
34,177 | 0.31 |
| |
27,400 | 0.25 |
| |
17,006 | 0.16 |
| |
15,386 | 0.14 |
| |
14,446 | 0.13 |
| |
14,145 | 0.13 |
| |
13,807 | 0.12 |
| |
11,333 | 0.10 |
| |
11,076 | 0.10 |
| |
10,778 | 0.09 |
| |
10,455 | 0.09 |
| |
10,391 | 0.09 |
| |
9,804 | 0.09 |
| Other | 108,436 | 1 |
| Total | 10,815,197 | 100 |
Illegal immigration
Greece has received many illegal immigrants beginning in the 1990s and continuing during the 2000s. Migrants make use of the many islands in the Aegean Sea, directly west of Turkey. A spokesman for the European Union's border control agency said that the Greek-Albanian border is "one of Europe's worst-affected external land borders." Migrants across the Evros region bordering Turkey face land-mines. Principal illegal immigrants include Albanians, Indians, Kurds, Afghans, Iraqis and Somalis.[15][16]
Ethnic groups, languages and religion
The population of northern Greece has primarily been ethnically, religiously and linguistically diverse.[17] The Muslim minority of Greece is the only explicitly recognized minority in Greece by the government. The officials define it as a group Greek Muslims, numbering 97,605 people or 0.91% of the total population, consisting of Turks (50%), Pomaks (35%) and Romani (15%). No other minorities are acknowledged and the Greek government has followed assimilatory policies and has discriminated against them.[18][19] There is not any official information for the size of the ethnic, linguistic and religious minorities because asking the population questions pertaining to the topic have been abolished since 1951.[20]

Religion in Greece (2010) [21]
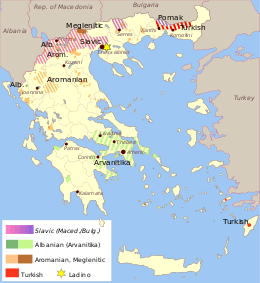
Minorities in Greece according to Minority Rights Group International:[22]
- Albanians: 443,550 (4.05%)
- Roma/Gypsies: 160,000-250,000 (1.5-2.28%)
- Vlachs (Aromanians): 200,000 (1.82%)
- Ethnic Macedonians: 100,000-200,000 (0.91-1.82%) - According to other sources the number of people who identify as being Macedonian ethnics is 5000-10,000.[23]
- Arvanites: 95,000 (0.87%)
- Turks: 90,000 (0.82%)
- Pomaks: 35,000 (0.32%)
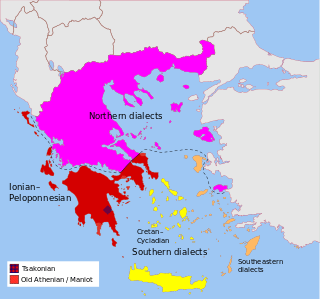
The official language of Greece is Greek, spoken by almost all as a second language at least. Additionally, there are a number of linguistic minority groups that are bilingual in a variety of non-Greek languages, and parts of these groups identify ethnically as Greeks. The most common of all these dialects, the groups that speak them and the regions where they are considered native are:
| Dialect | Spoken by | Estimated population | Region |
|---|---|---|---|
| Greek dialects | |||
| Cretan | Cretans | 600,000 | Crete |
| Maniot | Maniots | 25,000 | Mani (southern Peloponnese) |
| Pontic | Pontians | 200,000 | Macedonia |
| Sarakatsanika | Sarakatsani | 80,000 | Central Greece, Thessaly, Epirus |
| Tsakonian | Tsakonians | 1,200 | Tsakonia (eastern Peloponnese) |
| Other languages | |||
| Arvanitika | Arvanites | 50,000[24] | Attica, southern Euboea, Boeotia, Peloponnese |
| Aromanian | Aromanians | 50,000[24] | Epirus, Thessaly, West Macedonia |
| Hebrew | Jews | 5,000[24] | |
| Bulgarian/Macedonian Slavic | Slavic-speakers of Greek Macedonia, Pomaks | 50-80,000 (Macedonia), 10-40,000 (Thrace)[25][26][27] | Macedonia, Thrace |
| Turkish | Turks | 128,380 (Thrace)[28] 6,000 (Dodecanese) | Thrace |
| Romani | Romani | 300,000-350,000 | |
| Native speakers | census 1913 | census 1928[18][29] | census 1940[29][30] | census 1951[31] | ||||
|---|---|---|---|---|---|---|---|---|
| Number | % | Number | % | Number | % | Number | % | |
| Greek | 7,297,878 | 95.6 | ||||||
| Turkish[25][32] | 86,506- 230,000 | 1.4- 3.7 | 94,509- 180,000 | 1.3- 2.5 | 179,895 | 2.4 | ||
| Slavic[25] | 300,000- 500,000 | 6.3- 10.6 | 81,844- 100,000 | 1.3- 1.6 | 86,079- 100,000 | 1.2- 1.4 | 41,017- 60,000 | 0.5- 0.8 |
| Aromanian | 19,679 | 0.3 | 57,263 | 0.8 | 39,855 | 1.2 | ||
| Albanian | 18,598 | 0.3 | 20,000 | 0.3 | 22,736 | 0.3 | ||
| Armenian[25] | 31,038 | 0.5 | 26,796 | 0.4 | 9,000 | 0.1 | ||
| Hebrew/Ladino[24][25] | 63,000 | 1.0 | 52,706 | 0.7 | 1,300 | 0.0 | ||
| Others | 51,420 | 0.7 | ||||||
| Total | 4,734,990 | 6,204,684 | 7,344,860 | 7,632,801 | ||||
| Orthodox | 7,472,559 (97.9%) |
| Muslim | 112,665 (0.4%) |
| Catholic | 28,430 (0.4%) |
| Protestant and other Christian | 12,677 (0.2%) |
| Jewish | 6,325 (0.1%) |
| Total | 7,632,801 |
|---|---|
According to the Greek constitution, Eastern Orthodox Christianity is recognized as the "prevailing religion" in Greece. During the centuries that Greece was part of the Ottoman Empire, besides its spiritual mandate, the Orthodox Church, based in Constantinople (present-day Istanbul), also functioned as an official representative of the Christian population of the empire. The Church is often credited with the preservation of the Greek language, values, and national identity during Ottoman times. The Church was also an important rallying point in the war for independence, although this latter position is somewhat controversial as the official Church in Constantinople initially condemned the breakout of armed struggle against the Empire. The Church of Greece was established shortly after the formation of a Greek national state. Its authority to this day extends only to the areas included in the independent Greek state before the Balkan Wars of 1912-1913. There is a Muslim minority concentrated in Thrace and officially protected by the Treaty of Lausanne. Besides Pomaks (Muslim Bulgarian[4] speakers) and Roma, it consists mainly of ethnic Turks, who speak Turkish and receive instruction in Turkish at special government-funded schools. There are also a number of Jews in Greece, most of whom live in Thessaloniki. There are also some Greeks who adhere to a reconstruction of the ancient Greek religion.[33] A place of worship has been recognized as such by court.[34]
Education
Greek education is free and compulsory for children between the ages of 5 and 15. English study is compulsory from first grade through high school. University education, including books, is also free, contingent upon the student's ability to meet stiff entrance requirements. A high percentage of the student population seeks higher education. More than 100,000 students are registered at Greek universities, and 15% of the population currently holds a university degree. Admission in a university is determined by state-administered exams, the candidate's grade-point average from high school, and his/her priority choices of major. About one in four candidates gains admission to Greek universities.
Greek law does not currently offer official recognition to the graduates of private universities that operate in the country, except for those that offer a degree valid in another European Union country, which is automatically recognized by reciprocity. As a result, a large and growing number of students are pursuing higher education abroad. The Greek Government decides through an evaluation procedure whether to recognize degrees from specific foreign universities as qualification for public sector hiring. Other students attend private, post-secondary educational institutions in Greece that are not recognized by the Greek Government. At the moment extensive public talk is made for the reform of the Constitution in order to recognize private higher education in Greece as equal with public and to place common regulations for both.
The number of Greek students studying at European institutions is increasing along with EU support for educational exchange. In addition, nearly 5,000 Greeks are studying in the United States, about half of whom are in graduate school. Greek per capita student representation in the US (one every 2,200) is among the highest in Europe.
CIA World Factbook demographic statistics
The following demographic statistics are from the CIA World Factbook, unless otherwise indicated.[35]
Age structure
- 0-14 years: 14.2% (male 787,143/female 741,356)
- 15-64 years: 66.2% (male 3,555,447/female 3,567,383)
- 65 years and over: 19.6% (male 923,177/female 1,185,630) (2011 est.)
Median age
- total: 42.5 years
- male: 41.4 years
- female: 43.6 years (2011 est.)
Urbanization
- urban population: 61% of total population (2010)
- rate of urbanization: 0.6% annual rate of change (2010-15 est.)
Life expectancy at birth
- total population: 80.05 years
- male: 77.48 years
- female: 82.79 years (2012 est.)
See also
- Demographic history of Greece
- Turks of Western Thrace
- Minorities in Greece
- Aging of Europe
- Albanian immigrants in Greece
References
- ↑ https://esa.un.org/unpd/wpp/Publications/Files/Key_Findings_WPP_2015.pdf
- ↑ "Statistics Estonia - Total Fertility Rate- Number of Children Per Woman". Retrieved 8 September 2012.
- 1 2 3 "CIA – The World Factbook: Infant Mortality Rate". Archived from the original on 18 December 2012. Retrieved 18 December 2012.
- 1 2 "Bulgarian". Ethnolugue - Bulgarian language.
- ↑ Πίνακας 9. Πληθυσμός κατά υπηκοότητα και φύλο - Σύνολο Ελλάδος, αστικές και αγροτικές περιοχές - Απογραφή πληθυσμού της 18ης Μαρτίου 2001 [Table 9. Population by nationality and sex - Total for Greece, urban and rural areas - Census of 18 March 18, 2001] (PDF). Census (in Greek). www.statistics.gr. 2001. Archived from the original (PDF) on 6 February 2009. Retrieved 7 January 2009.
- ↑ Mogens Herman Hansen, The Shotgun Method: The Demography of the Ancient Greek City-State Culture, University of Missouri Press, 2006. Book review
- ↑ "2011 census".
- ↑ B.R. Mitchell. European historical statistics, 1750-1975.
- ↑ Statistical Office of the United Nations (1949). Demographic Yearbook 1948 (PDF). United Nations in collaboration with the Department of Social Affairs.
- ↑ Hellenic Statistical Authority
- ↑ http://www.statistics.gr/portal/page/portal/ESYE/BUCKET/A1605/PressReleases/A1605_SPO03_DT_AN_00_2012_01_F_EN.pdf
- ↑ ΣΚΑΪ. "ΕΛΣΤΑΤ: Περαιτέρω μείωση των γεννήσεων πέρυσι – Διπλάσιες στην Τουρκία".
- ↑ Newsroom, Taxheaven. "Μειώθηκε ο πληθυσμός της Ελλάδας το 2014 - Περισσότεροι οι θάνατοι από τις γεννήσεις".
- ↑ http://ec.europa.eu/eurostat/documents/2995521/7553787/3-08072016-AP-EN.pdf/c4374d2a-622f-4770-a287-10a09b3001b6
- ↑ Research Institute for Europeand and American Analysis, http://rieas.gr/index.php?option=com_content&task=view&id=812&Itemid=89
- ↑ Niki Kitsantonis, "Greece struggles to curb influx of illegal immigrants," "New York Times," 4 October 2007 http://www.nytimes.com/2007/10/04/world/europe/04iht-migrate.4.7756077.html
- ↑ "Greece". Britannica.
- 1 2 "GEEK HELSINKI MONITOR". Retrieved 14 August 2015.
- ↑ "ΜΟΥΣΟΥΛΜΑΝΙΚΗ ΜΕΙΟΝΟΤΗΤΑ ΘΡΑΚΗΣ" (in Greek). Hellenic Resources Network. 1999. Retrieved 4 January 2016. and "ΣΤΟΙΧΕΙΑ ΑΠΟ ΤΗΝ ΠΡΟΣΦΑΤΗ ΑΠΟΓΡΑΦΗ ΤΟΥ ΠΛΗΘΥΣΜΟΥ" (in Greek). Water Info. Retrieved 4 January 2016.
- ↑ Fassmann, Heinz; Reeger, Ursula; Sievers, Wiebke (2009). Statistics and Reality: Concepts and Measurements of Migration in Europe. Amsterdam University Press. p. 237. ISBN 978-90-8964-052-9. Retrieved 27 March 2016.
- ↑ "Greece". PewForum. Retrieved 2014-04-04.
- ↑ "MRG Directroy:Greece". Greece Overview. MRG. Retrieved 14 August 2015.
- ↑ Danforth, Loring M. (Winter 1994). "National Conflict in a Transnational World: Greeks and Macedonians at the Conference on Security and Cooperation in Europe". Diaspora: A Journal of Transnational Studies. 3 (3): 325–347. doi:10.1353/dsp.1994.0008. ISSN 1911-1568. Retrieved 4 August 2016.
- 1 2 3 4 Peter Trudgill & Daniel Schreier, "Greece and Cyprus", in: Sociolinguistics (HSK 3.3), 2nd ed., Berlin & New York: de Gruyter, p. 1881-1889, esp. p. 1883
- 1 2 3 4 5 Peter Trudgill & Daniel Schreier, "Greece and Cyprus", in: Sociolinguistics (HSK 3.3), 2nd ed., Berlin & New York: de Gruyter, p. 1881-1889, esp. p. 1885
- ↑ Poulton, Hugh (1995). Who are the Macedonians?. C. Hurst & Co. Publishers. p. 167. ISBN 1-85065-238-4.
- ↑ Shea, John (1 January 1997). "Macedonia and Greece: The Struggle to Define a New Balkan Nation". McFarland – via Google Books.
- ↑ Ethnologue
- 1 2 "Οι εθνικές μειονότητες [The National Minorities]".
- ↑ "Macedonia and Greece: The Struggle to Define a New Balkan Nation".
- 1 2 Clogg, Richard (1 January 2002). "Minorities in Greece: Aspects of a Plural Society". Hurst – via Google Books.
- ↑ "Turks of western Thrace".
- ↑ "Ancient Greek gods' new believers". BBC News. 2007-01-21. Retrieved 2008-08-24.
- ↑ Smith, Helena (2006-05-05). "Greek gods prepare for comeback". London: Guardian.co.uk. Retrieved 2008-08-24.
- ↑ Greece: People, CIA World Factbook, 2012. Retrieved on 6 April 2012
External links
Greece articles | ||||||||
|---|---|---|---|---|---|---|---|---|
| History |
| | ||||||
| Geography |
| |||||||
| Politics | ||||||||
| Economy | ||||||||
| Society | ||||||||
| ||||||||