Demographics of Spain

As of January 1, 2014, Spain had a total population of 46,507,760, which represents a 0.5% decrease since 2013.[1]The CIA Factbook (2011) gives a racial description of "composite of Mediterranean and Nordic types" under "ethnic groups" instead of the usual breakdown of ethnic composition. This reflects the formation of the modern Kingdom of Spain by the accretion of several independent Iberian realms, i.e., León, Castile, Navarre, the Crown of Aragon, Granada, etc. Spain's population peaked in 2012, at 46,818,216 people. Spain's official population fell by 206,000 to 47.1 million, mostly because of immigrants returning home due to the effects of the European economic and fiscal crisis.[2] Its population density, at 91.4 inhabitants per square kilometre (237/sq mi), is lower than that of most Western European countries. With the exception of the capital Madrid, the most densely populated areas lie around the coast.
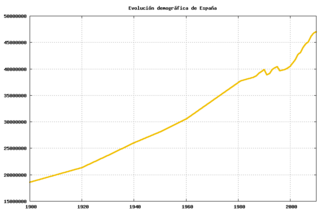
The population of Spain doubled during the twentieth century, but the pattern of growth was extremely uneven due to large-scale internal migration from the rural interior to the industrial cities, a phenomenon which happened later than in other Western European countries. No fewer than eleven of Spain's fifty provinces saw an absolute decline in population over the century.
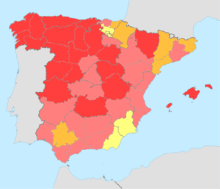
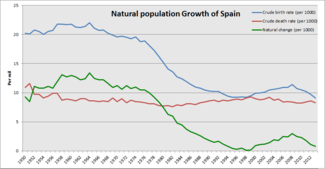
The last quarter of the century saw a dramatic fall in birth rates. Spain's fertility rate of 1.47 (the number of children the average woman will have during her lifetime) is lower than the EU average, but has climbed every year since the late 1990s. The birth rate has climbed in 10 years from 9.10 births per 1000 people per year in 1996 to 10.9 in 2006.
Spain has no official religion. The Spanish Constitution of 1978 abolished the Roman Catholic Church as the official state religion, while recognizing the role it plays in Spanish society. 76.7% of the population define themselves as Catholic, 20.0% as non-believers or atheists, and 1.6% other religions. Among believers, 55.3% assert they almost never go to any religious service, by contrast, 17.0% attend one or more masses almost every week.[3]
Immigration and Demographic Issues
The population of Spain doubled during the twentieth century as a result of the spectacular demographic boom in the 1960s and early 1970s. After that time, the birth rate plunged through the 1980s and Spain's population became stalled, its demographics showing one of the lowest sub replacement fertility rates in the world, only above Greece, Portugal, Hungary, Ukraine, and Japan.
Many demographers have linked Spain's very low fertility rate to the country's lack of any real family planning policy. Spain spends the least on family support out all western European countries—0.5% of GDP. A graphic illustration of the enormous social gulf in this field is the fact that a Spanish family would need to have 57 children to enjoy the same financial support as a family with 3 children in Luxembourg.
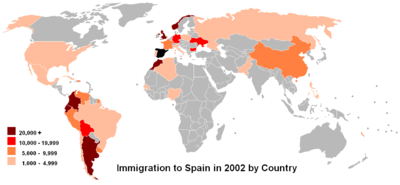
In emigration/immigration terms, after centuries of net emigration, Spain, has recently experienced large-scale immigration for the first time in modern history. According to the Spanish government there were 5,730,667 foreign residents in Spain as of January 2011. Of these, more than 860,000 were Romanian, and half 760,000 were Moroccan while the number of Ecuadorians was around 390,000. Colombian population amounted to around 300,000. There are also a significant number of British (359,076 as of 2011, but more than one million are estimated to live permanently in Spain) and German (195,842) citizens, mainly in Alicante, Málaga provinces, Balearic Islands and Canary Islands. Chinese number over 166,000. Immigrants from several sub-Saharan African countries have also settled in Spain as contract workers, although they represent only 4.08% of all the foreign residents in the country.
During the early 2000s, the mean year-on-year demographic growth set a new record with its 2003 peak variation of 2.1%, doubling the previous record reached back in the 1960s when a mean year-on-year growth of 1% was experienced.[4] This trend is far from being reversed at the present moment and, in 2005 alone, the immigrant population of Spain increased by 700,000 people.[5]
The growing population of immigrants is the main reason for the slight increase in Spain's fertility rate.[6] From 2002 through 2008 the Spanish population grew by 8%, of which 7% were foreign.[7]
Vital statistics
Notable events in modern Spanish demography:
- 1898. Loss of the war against the United States. Economic depression and mass emigration to American countries ensued.
- 1918. Flu pandemic, over 200,000 dead in Spain.
- 1936. Start of the Spanish Civil War.
- 1939. End of the Civil War. Establishment of a national-catholic dictatorship, contraception and abortion were banned. Start of rationing policies. Deepening of economic depression, mass emigration to European and American countries due to economic and political motives (Republican exile).
- 1941. Approval of benefits for large families, with at least four children.[8]
- 1945. Establishment of tax deductions for parents.[9]
- 1952. End of rationing policies.
- 1975. End of the dictatorship, mass return of emigrated people.
- 1977. Legalization of contraception. Decline of birth rates.
- 1985. Legalization of abortion.
- 1988. As Spain became a developed country, the first events of illegal immigration from Africa occur.[10]
- 1991. Spain becomes a net receiver of immigrants, after decades of mass emigration.[11]
- 1994. Lowering of threshold of requirements to become a large family, only three children needed.[8]
- 2007. Approval of €2,500 benefit for births.
- 2010. Legalization of abortion on demand.
- 2011. Withdrawal of the €2,500 benefit for births.
- 2015. First negative natural change since the Civil War due to the aging of Spanish population.
|
1.5 - 1.7
1.4 - 1.5
1.3 - 1.4
< 1.3 |
| [12][13] | Average population (x 1000) | Live births | Deaths | Natural change | Crude birth rate (per 1000) | Crude death rate (per 1000) | Natural change (per 1000) | Fertility rates |
|---|---|---|---|---|---|---|---|---|
| 1900 | 18 520 | 627 848 | 536 716 | 91 132 | 33.9 | 29.0 | 4.9 | |
| 1901 | 18 610 | 650 649 | 517 575 | 133 074 | 35.0 | 27.8 | 7.1 | |
| 1902 | 18 720 | 666 687 | 488 289 | 178 398 | 35.6 | 26.1 | 9.6 | |
| 1903 | 18 810 | 685 265 | 470 387 | 214 878 | 36.4 | 25.0 | 11.4 | |
| 1904 | 18 980 | 649 878 | 486 889 | 162 989 | 34.2 | 25.7 | 8.6 | |
| 1905 | 19 110 | 670 651 | 491 369 | 179 282 | 35.1 | 25.7 | 9.4 | |
| 1906 | 19 250 | 650 385 | 499 018 | 151 367 | 33.8 | 25.9 | 7.8 | |
| 1907 | 19 380 | 646 371 | 472 007 | 174 364 | 33.3 | 24.4 | 9.0 | |
| 1908 | 19 530 | 658 008 | 460 946 | 197 062 | 33.7 | 23.6 | 10.1 | |
| 1909 | 19 670 | 650 498 | 466 648 | 183 850 | 33.1 | 23.7 | 9.3 | |
| 1910 | 19 770 | 646 975 | 456 158 | 190 817 | 32.7 | 23.1 | 9.7 | |
| 1911 | 19 950 | 628 443 | 466 525 | 161 918 | 31.5 | 23.4 | 8.1 | |
| 1912 | 20 040 | 637 860 | 426 297 | 211 563 | 31.8 | 21.3 | 10.6 | |
| 1913 | 20 170 | 617 850 | 449 349 | 168 501 | 30.6 | 22.3 | 8.4 | |
| 1914 | 20 310 | 608 207 | 450 340 | 157 867 | 29.9 | 22.2 | 7.8 | |
| 1915 | 20 430 | 631 462 | 452 479 | 178 983 | 30.9 | 22.1 | 8.8 | |
| 1916 | 20 610 | 599 011 | 441 673 | 157 338 | 29.1 | 21.4 | 7.6 | |
| 1917 | 20 740 | 602 139 | 465 722 | 136 417 | 29.0 | 22.5 | 6.6 | |
| 1918 | 20 910 | 612 637 | 695 758 | -83 121 | 29.3 | 33.3 | -4.0 | |
| 1919 | 21 000 | 585 963 | 482 752 | 103 211 | 27.9 | 23.0 | 4.9 | |
| 1920 | 21 130 | 623 339 | 494 540 | 128 799 | 29.5 | 23.4 | 6.1 | |
| 1921 | 21 270 | 648 892 | 455 469 | 193 423 | 30.5 | 21.4 | 9.1 | |
| 1922 | 21 510 | 656 093 | 441 330 | 214 763 | 30.5 | 20.5 | 10.0 | 4,02 |
| 1923 | 21 740 | 662 576 | 449 683 | 212 893 | 30.5 | 20.7 | 9.8 | 4.02 |
| 1924 | 21 990 | 653 085 | 430 590 | 222 495 | 29.7 | 19.6 | 10.1 | 3,92 |
| 1925 | 22 160 | 644 741 | 432 400 | 212 341 | 29.1 | 19.5 | 9.6 | 3.82 |
| 1926 | 22 400 | 663 401 | 420 838 | 242 563 | 29.6 | 18.8 | 10.8 | 3,87 |
| 1927 | 22 610 | 636 028 | 419 816 | 216 212 | 28.1 | 18.6 | 9.6 | 3.70 |
| 1928 | 22 860 | 666 240 | 413 002 | 253 238 | 29.1 | 18.1 | 11.1 | 3,80 |
| 1929 | 23 120 | 653 668 | 407 486 | 246 182 | 28.3 | 17.6 | 10.7 | 3.69 |
| 1930 | 23 340 | 660 860 | 394 488 | 266 372 | 28.3 | 16.9 | 11.4 | 3,68 |
| 1931 | 23 510 | 649 276 | 408 977 | 240 299 | 27.6 | 17.4 | 10.2 | 3.58 |
| 1932 | 23 897 | 670 670 | 388 900 | 281 770 | 28.3 | 16.5 | 11.8 | 3,64 |
| 1933 | 24 122 | 667 866 | 394 750 | 273 116 | 27.9 | 16.5 | 11.4 | 3.59 |
| 1934 | 24 349 | 641 889 | 392 793 | 249 096 | 26.4 | 16.1 | 10.2 | 3,38 |
| 1935 | 24 578 | 636 725 | 388 757 | 247 968 | 25.9 | 15.8 | 10.1 | 3.31 |
| 1936 | 24 810 | 617 220 | 417 108 | 200 112 | 24.9 | 16.8 | 8.1 | 3,18 |
| 1937 | 25 043 | 568 977 | 475 310 | 93 667 | 22.7 | 19.0 | 3.7 | 2.89 |
| 1938 | 25 279 | 508 726 | 487 546 | 21 180 | 20.1 | 19.3 | 0.8 | 2,56 |
| 1939 | 25 517 | 422 345 | 472 611 | -50 266 | 16.6 | 18.5 | -2.0 | 2.12 |
| 1940 | 25 757 | 631 285 | 428 416 | 202 869 | 24.5 | 16.6 | 7.9 | 3,09 |
| 1941 | 25 999 | 511 157 | 487 748 | 23 409 | 19.7 | 18.8 | 0.9 | 2.47 |
| 1942 | 26 244 | 530 845 | 387 844 | 143 001 | 20.2 | 14.8 | 5.4 | 2,53 |
| 1943 | 26 491 | 606 971 | 352 587 | 254 384 | 22.9 | 13.3 | 9.6 | 2.88 |
| 1944 | 26 620 | 602 091 | 349 114 | 253 796 | 22.6 | 13.1 | 9.5 | 2,84 |
| 1945 | 26 770 | 621 558 | 330 581 | 290 977 | 23.2 | 12.3 | 10.9 | 2.91 |
| 1946 | 27 030 | 585 381 | 353 371 | 232 010 | 21.7 | 13.1 | 8.6 | 2,70 |
| 1947 | 27 150 | 588 732 | 330 341 | 258 391 | 21.7 | 12.2 | 9.5 | 2.67 |
| 1948 | 27 593 | 642 041 | 305 310 | 336 731 | 23.3 | 11.1 | 12.2 | 2,88 |
| 1949 | 27 811 | 601 759 | 321 541 | 280 218 | 21.6 | 11.6 | 10.1 | 2.68 |
| 1950 | 28 009 | 565 378 | 305 934 | 259 444 | 20.2 | 10.9 | 9.3 | 2,48 |
| 1951 | 28 236 | 567 474 | 327 236 | 240 238 | 20.1 | 11.6 | 8.5 | 2.47 |
| 1952 | 28 474 | 593 019 | 276 735 | 316 284 | 20.8 | 9.7 | 11.1 | 2,56 |
| 1953 | 28 713 | 589 188 | 278 522 | 310 666 | 20.5 | 9.7 | 10.8 | 2.55 |
| 1954 | 28 955 | 577 886 | 264 668 | 313 218 | 20.0 | 9.1 | 10.8 | 2,50 |
| 1955 | 29 199 | 598 970 | 274 188 | 324 782 | 20.5 | 9.4 | 11.1 | 2.58 |
| 1956 | 29 445 | 608 121 | 290 410 | 317 711 | 20.7 | 9.9 | 10.8 | 2,61 |
| 1957 | 29 693 | 646 784 | 293 502 | 353 282 | 21.8 | 9.9 | 11.9 | 2.77 |
| 1958 | 29 943 | 653 216 | 260 683 | 392 533 | 21.8 | 8.7 | 13.1 | 2,80 |
| 1959 | 30 195 | 654 474 | 269 591 | 384 883 | 21.7 | 8.9 | 12.7 | 2.79 |
| 1960 | 30 455 | 663 375 | 268 941 | 394 434 | 21.8 | 8.8 | 13.0 | 2,77 |
| 1961 | 30 744 | 654 616 | 263 441 | 391 175 | 21.3 | 8.6 | 12.7 | 2.75 |
| 1962 | 31 067 | 658 816 | 278 575 | 380 241 | 21.2 | 9.0 | 12.2 | 2,79 |
| 1963 | 31 393 | 671 520 | 282 460 | 389 060 | 21.4 | 9.0 | 12.4 | 2.87 |
| 1964 | 31 723 | 697 697 | 273 955 | 423 742 | 22.0 | 8.6 | 13.4 | 3,01 |
| 1965 | 32 056 | 676 361 | 274 271 | 402 090 | 21.1 | 8.6 | 12.5 | 2.94 |
| 1966 | 32 394 | 669 919 | 276 173 | 393 746 | 20.7 | 8.5 | 12.2 | 2,93 |
| 1967 | 32 734 | 680 125 | 280 494 | 399 631 | 20.8 | 8.6 | 12.2 | 2.98 |
| 1968 | 33 079 | 667 311 | 282 628 | 384 683 | 20.2 | 8.5 | 11.6 | 2,92 |
| 1969 | 33 427 | 666 568 | 303 402 | 363 166 | 19.9 | 9.1 | 10.9 | 2.91 |
| 1970 | 33 779 | 663 667 | 286 067 | 377 600 | 19.6 | 8.5 | 11.2 | 2,88 |
| 1971 | 34 216 | 672 092 | 308 516 | 363 576 | 19.7 | 9.0 | 10.6 | 2.88 |
| 1972 | 34 572 | 672 405 | 285 508 | 386 897 | 19.5 | 8.3 | 11.2 | 2,86 |
| 1973 | 34 921 | 672 963 | 301 803 | 371 160 | 19.3 | 8.7 | 10.7 | 2.84 |
| 1974 | 35 288 | 688 711 | 300 403 | 388 308 | 19.6 | 8.5 | 11.0 | 2,89 |
| 1975 | 35 688 | 669 378 | 298 192 | 371 186 | 18.8 | 8.4 | 10.5 | 2.80 |
| 1976 | 36 118 | 677 456 | 299 007 | 378 449 | 18.9 | 8.3 | 10.5 | 2,79 |
| 1977 | 36 564 | 656 357 | 294 324 | 362 033 | 18.1 | 8.1 | 10.0 | 2.65 |
| 1978 | 36 741 | 636 892 | 296 781 | 340 111 | 17.3 | 8.1 | 9.2 | 2,53 |
| 1979 | 37 289 | 601 992 | 291 213 | 310 779 | 16.2 | 7.8 | 8.4 | 2.35 |
| 1980 | 37 527 | 571 018 | 289 344 | 281 674 | 15.2 | 7.7 | 7.5 | 2,19 |
| 1981 | 37 741 | 533 008 | 293 386 | 239 622 | 14.1 | 7.8 | 6.3 | 2.04 |
| 1982 | 37 942 | 515 706 | 286 655 | 229 051 | 13.6 | 7.6 | 6.0 | 1,94 |
| 1983 | 38 122 | 485 352 | 302 569 | 182 783 | 12.7 | 7.9 | 4.8 | 1.80 |
| 1984 | 38 279 | 473 281 | 299 409 | 173 872 | 12.4 | 7.8 | 4.5 | 1,73 |
| 1985 | 38 419 | 456 298 | 312 532 | 143 766 | 11.9 | 8.1 | 3.7 | 1.64 |
| 1986 | 38 536 | 438 750 | 310 413 | 128 337 | 11.4 | 8.1 | 3.3 | 1,56 |
| 1987 | 38 631 | 426 782 | 310 073 | 116 709 | 11.0 | 8.0 | 3.0 | 1.50 |
| 1988 | 38 716 | 418 919 | 319 437 | 99 482 | 10.8 | 8.3 | 2.6 | 1,45 |
| 1989 | 38 792 | 408 434 | 324 796 | 83 638 | 10.5 | 8.4 | 2.2 | 1.40 |
| 1990 | 38 851 | 401 425 | 333 142 | 68 283 | 10.3 | 8.6 | 1.8 | 1.36 |
| 1991 | 38 940 | 395 989 | 337 691 | 58 298 | 10.2 | 8.7 | 1.5 | 1.33 |
| 1992 | 39 068 | 396 747 | 331 515 | 65 232 | 10.2 | 8.5 | 1.7 | 1.32 |
| 1993 | 39 190 | 385 786 | 339 661 | 46 125 | 9.8 | 8.7 | 1.2 | 1.26 |
| 1994 | 39 295 | 370 148 | 338 242 | 31 906 | 9.4 | 8.6 | 0.8 | 1.21 |
| 1995 | 39 387 | 363 469 | 346 227 | 17 242 | 9.2 | 8.8 | 0.4 | 1.18 |
| 1996 | 39 478 | 362 626 | 351 449 | 11 177 | 9.2 | 8.9 | 0.3 | 1.17 |
| 1997 | 39 582 | 369 035 | 349 521 | 19 514 | 9.3 | 8.8 | 0.5 | 1.19 |
| 1998 | 39 721 | 365 193 | 360 511 | 4 682 | 9.2 | 9.1 | 0.1 | 1.15 |
| 1999 | 39 927 | 380 130 | 371 102 | 9 028 | 9.5 | 9.3 | 0.2 | 1.20 |
| 2000 | 40 264 | 397 632 | 360 391 | 37 241 | 9.9 | 9.0 | 0.9 | 1.23 |
| 2001 | 40 476 | 406 380 | 360 131 | 46 249 | 10.0 | 8.8 | 1.1 | 1.24 |
| 2002 | 41 035 | 418 846 | 368 618 | 50 228 | 10.1 | 8.9 | 1.2 | 1.26 |
| 2003 | 41 827 | 441 881 | 384 828 | 57 053 | 10.5 | 9.2 | 1.4 | 1.31 |
| 2004 | 42 547 | 454 591 | 371 934 | 82 657 | 10.6 | 8.7 | 1.9 | 1.33 |
| 2005 | 43 296 | 466 371 | 387 355 | 79 016 | 10.7 | 8.9 | 1.8 | 1.35 |
| 2006 | 44 009 | 482 957 | 371 478 | 111 479 | 10.9 | 8.4 | 2.5 | 1.36 |
| 2007 | 44 784 | 492 527 | 385 361 | 107 166 | 10.9 | 8.5 | 2.4 | 1.40 |
| 2008 | 45 668 | 518 503 | 384 198 | 134 305 | 11.4 | 8.4 | 3.0 | 1.46 |
| 2009 | 46 239 | 493 717 | 383 209 | 110 508 | 10.7 | 8.2 | 2.5 | 1.39 |
| 2010 | 46 486 | 485 252 | 380 234 | 105 218 | 10.5 | 8.2 | 2.3 | 1.38 |
| 2011 | 46 667 | 470 553 | 386 017 | 84 536 | 10.2 | 8.4 | 1.8 | 1.34 |
| 2012 | 46 818 | 454 648 | 402 950 | 51 698 | 9.7 | 8.6 | 1.1 | 1.32 |
| 2013 | 46 728 | 425 715 | 390 419 | 35 296 | 9.1 | 8.3 | 0.8 | 1.27 |
| 2014 | 46 508 | 426 303 | 395 045 | 31 678 | 9.1 | 8.5 | 0.6 | 1.32 |
| 2015 | 46 449 | 417 265 | 420 018 | -2 753 | 9.0 | 9.1 | -0.1 | 1.33 |
Metropolitan areas
The largest metropolitan areas in 2007 were:
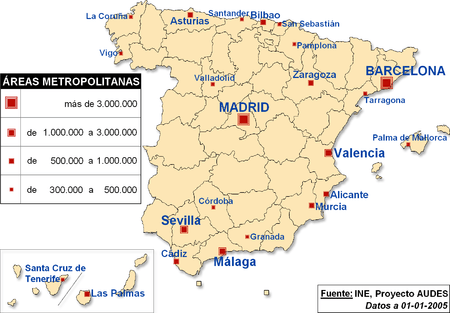
- Madrid 6,489,162
- Barcelona 5,375,774
- Valencia 1,705,742
- Seville 1,519,639
- Bilbao 950,155
- Málaga 897,563
- Asturias (Gijón–Oviedo–Avilés) 857,079
- Alicante–Elche 748,565
- Zaragoza 731,803
- Vigo 662,412
- Las Palmas 616,903
- Bahía de Cádiz (Cádiz–Jerez de la Frontera) 615,494
- Santa Cruz de Tenerife 573,825
- Murcia 563,272
- Palma 474,035
- Granada 472,638
- San Sebastián 402,168
- Tarragona 406,042
- A Coruña 403,007
- Valladolid 400,400
- Santander–Torrelavega 391,480
- Córdoba 323,600
- Pamplona 309,631
Islands
Islander population:[15]
|
CIA World Factbook demographic statistics
The following demographic statistics are from the CIA World Factbook, unless otherwise indicated.
Population
46,529,002 (July 2010 est.)
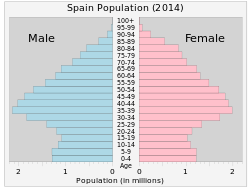
Age structure (2008 est.)
0-14 years:
14.4% (male 3,423,861/female 3,232,028)
15-64 years:
69.1% (male 16,185,575/female 15,683,433)
65 years and over:
16.5% (male 3,238,301/female 4,394,624) (2008 est.)
Sex ratio
at birth:
1.07 male(s)/female
under 15 years:
1.06 male(s)/female
15-64 years:
1.01 male(s)/female
65 years and over:
0.72 male(s)/female
total population:
0.96 male(s)/female (2006 est.)
Infant mortality rate
4.37 deaths/1,000 live births (2006 est.)
Life expectancy at birth
Spain is, according to the OECD "Health at a glance report 2013", second in Europe and fourth worldwide in terms of life expectancy at birth.
total population:
82.4 years (Source: OECD 2013 "Health at a glance" report)
male:
78.8 years (Source: OECD 2013 "Health at a glance" report)
female:
85.2 years (Source: OECD 2013 "Health at a glance" report)
Total fertility rate
1.47 children born/woman (2010 est.)
Nationality
noun:
Spaniard(s)
adjective:
Spanish
Ethnic groups
Definition of ethnicity or nationality in Spain is fraught politically. The term "Spanish people" (pueblo español) is defined in the 1978 constitution as the political sovereign, i.e. the citizens of the Kingdom of Spain. The same constitution in its preamble speaks of "peoples and nationalities of Spain" (pueblos y nacionalidades de España) and their respective cultures, traditions, languages and institutions. The formerly nomadic Gitanos and Mercheros are distinctly marked by endogamy and discrimination but they are dispersed through the country.
The native Canarians are the descendants of the population of the Canary Islands prior to Spanish colonization in the 15th century. Also included are many Spaniard citizens who are descendents of people from Spain's former colonies, mostly from Equatorial Guinea, Argentina, Dominican Republic, Ecuador, Peru, Colombia, Morocco and the Philippines. There is also a sizable number of Spaniards of Eastern European, Maghrebian, Sub Saharan-African, South Asian and Middle Eastern descent.
Native-born Spanish citizens of all ethnic groups make up 86% of the total population, and 14% are immigrants. Among the immigrants, around 57% of them come from Spain's former colonies in Latin America (including those from Cuba, Argentina, Ecuador, Puerto Rico, Chile and Uruguay), Africa and Philippines (Southeast Asia). The rest are mostly Eastern European (especially Romanians, Bulgarians, Russians, Serbians, Croatians, Bosnians, Ukrainians and Albanians), North and West Africans (notably Moroccans, Algerians, Senegalese, Guineans, Nigerians and Cameroonians), Middle Eastern peoples including the Lebanese and Syrian communities, South Asians including Indians and Pakistanis, and Chinese, as well as a sizable number of citizens from the European Union, as of 2007 mostly Romanians, Bulgarians, British, Portuguese, Polish (central Europe), and Germans.
List of largest minority groups in Spain by country as of 2011
| Rank | Nationality | Population (2011) |
|---|---|---|
| 1 | 798,104 | |
| 2 | 773,966 | |
| 3 | 316,756 | |
| 4 | 312,098 | |
| 5 | 250,087 | |
| 6 | 183,626 | |
| 7 | 177,520 | |
| 8 | 171,127 | |
| 9 | 153,245 | |
| 10 | 150,878 | |
Religions
Roman Catholicism is the largest religion in the country by far. According to a July 2009 study by the Spanish Center of Sociological Research about 70% of Spaniards self-identify as Catholics, 10% other faith, and about 20% identify with no religion. Most Spaniards do not participate regularly in religious services. This same study shows that of the Spaniards who identify themselves as religious, 58% hardly ever or never go to church, 17% go to church some times a year, 9% some time per month and 15% every Sunday or multiple times per week.[16] But according to a December 2006 study, 48% of the population declared a belief in a supreme being, while 41% described themselves as atheist or agnostic.[17]
Languages
- Spanish 99% (88% mother tongue[18]) (official nationwide)
- Catalan 16%[19] (9% mother tongue[18]) (co-official in Catalonia, Balearic Islands, and Valencia — see Valencian)
- Galician 7% (5% mother tongue[18]) (co-official in Galicia)
- Basque 1.6% (1% mother tongue[18]) (co-official in Basque Country and designated areas in Navarre).
- Aranese (a variant of Gascon Occitan) is co-official in Val d'Aran, a small valley in the Pyrenees.
Others with no official status:
- Asturian-Leonese (in the former Kingdom of León and Asturias)
- Aragonese (in the province of Huesca, Aragon)
- Arabic (in the autonomous city of Ceuta)
- Berber (in the autonomous city of Melilla)
Literacy
definition: age 15 and over can read and write. Total population: 97.7% Male: 98.5% Female: 97% (2010 est.)
Educational system
About 70% of Spain's student population attends public schools or universities. The remainder attend private schools or universities, many of which are operated by the Catholic Church.
Compulsory education begins with primary school or general basic education for ages 6–16. It is free in public schools and in many private schools, most of which receive government subsidies. Following graduation, students attend either a secondary school offering a general high school diploma or a school of professional study in all fields — law, sciences, humanities, and medicine — and the superior technical schools offer programs in engineering and architecture.
See also
| Wikimedia Commons has media related to Demographics of Spain. |
- Health in Spain
- Spain
- List of Spaniards
- Nationalities in Spain
- Romani people in Spain
- Ranked list of Spanish autonomous communities
References
- ↑ "Cifras de Población a 1 de enero de 2014" (PDF) (in Spanish). June 30, 2014. Retrieved March 6, 2015.
- ↑ "Spain's population falls for first time since 1940s as immigrants flee crisis". Toronto. April 22, 2013. Archived from the original on May 13, 2013.
- ↑ CIS study, April 2008. Questions 33 and 34.
- ↑ Official report on Spanish recent Macroeconomics, including data and comments on immigration
- ↑ Source: Instituto Nacional de Estadística. Evolution of the foreign population in Spain since 1998
- ↑ Source: Instituto Nacional de Estadística, Evolution of the global fertility rate between 1975 and 2005
- ↑
- 1 2 La evolución de las familias numerosas (Spanish)
- ↑ Forgetting the past: The familiar policy of Spain (1975-1996). Celia Valiente Fernández. Charles III University of Madrid
- ↑ The first 'patera' arrived to Canary Islands 20 years ago - Público newspaper (Spanish)
- ↑ Net migration in Spain since 1940
- ↑ Instituto Nacional de Estadística: Anuarios Estadísticos (Statistical yearbooks)
- ↑ Instituto Nacional de Estadística Vital Statistics
- ↑ "AUDES project". Grupo Alarcos. Retrieved 2008-08-14.
- ↑ La superficie de las islas vendrá dada en hectáreas salvo la de las mayores islas de los archipiélagos canario y balear, así como las Plazas de Soberanía.
- ↑ "Barómetro julio 2009, Centro de Investigaciones Sociológicas, Jul 2009" (PDF). Retrieved 2009-10-16.
- ↑ Religion Important for Americans, Italians, Angus Reid Global Monitor, December 30, 2006
- 1 2 3 4 http://ec.europa.eu/public_opinion/archives/ebs/ebs_243_en.pdf
- ↑ Ethnologue report for Spain
External links
- Spanish Instituto Nacional de Estadística Statistical data about demography and population
- Build Spanish population graph 1960 - 2013 (World Bank data)
- Build Spanish population projection graph till 2100 (United Nation data)
- Build Spanish life expectancy at birth graph 1950 - 2013 (United Nation data)
| Indigenous groups | |
|---|---|
| Historic minorities | |
| Related topics | |