Demography of Scotland
The demography of Scotland includes all aspects of population, past and present, in the area that is now Scotland. Scotland has a population of 5,295,000 (first results of 2011 Census).[1] The population growth rate in 2011 was estimated as 0.6% per annum according to the 2011 GROS Annual Review.[2]
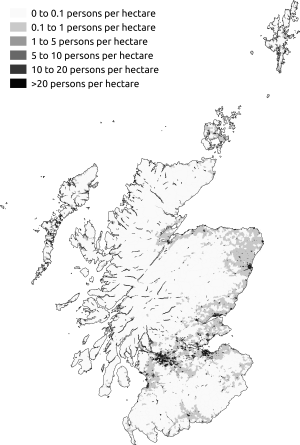
Covering an area of 78,782 square kilometres (30,418 sq mi), Scotland has a population density of 67.2/km2 (174/sq mi). Around 70% of the country's population live in the Central Lowlands — a region stretching in a northeast-southwest orientation between the major cities of Edinburgh and Glasgow, and including the major settlements of Paisley, Stirling, Falkirk, Perth and Dundee. Other concentrations of population include the northeast coast of Scotland, principally the regions around the cities of Aberdeen and Inverness. The Highlands of Scotland and the island group of Eilean Siar have the lowest population densities at 9/km2 (23/sq mi). Glasgow has the highest population density at 3,289/km2 (8,520/sq mi).[3]
Until April 2011 responsibility for estimating the population of Scotland, as well as recording births, deaths and marriages, was overseen by the General Register Office for Scotland (GROS), headed by the Registrar-General for Scotland. From 1 April 2011 the GROS merged with the National Archives of Scotland to become the National Records of Scotland. The new organisation is still required under the terms of the Registration of Births, Deaths and Marriages (Scotland) Act 1965, to present a Registrar-General's annual report of demographic trends to Scottish Ministers. (Prior to devolution it was to the Secretary of State for Scotland). In conjunction with the rest of the United Kingdom, the National Records for Scotland is also responsible for conducting a decadal census of population. The most recent one took place in March 2011 with the next due to take place in 2021.[4]
Historical population
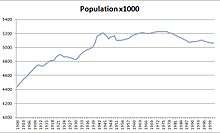
Population totals for Scotland 1600–2011
In the United Kingdom a census was taken every 10 years from 1801 with the exception of 1941 due to the Second World War. Population data for years prior to that is provided from directories and gazetteers[5][6][7]
| Year | Population |
|---|---|
| 1500 | 500,000 |
| 1600 | 800,000 |
| 1707 | 1,000,000 |
| 1755 | 1,265,380 |
| 1801 | 1,608,420 |
| 1811 | 1,805,864 |
| 1821 | 2,091,521 |
| 1831 | 2,364,386 |
| 1841 | 2,620,184 |
| 1851 | 2,888,742 |
| 1861 | 3,062,294 |
| 1871 | 3,360,018 |
| 1881 | 3,735,578 |
| 1891 | 4,025,647 |
| 1901 | 4,472,103 |
| 1911 | 4,760,904 |
| 1921 | 4,882,407 |
| 1931 | 4,842,989 |
| 1939a | 5,006,700 |
| 1951 | 5,095,969 |
| 1961b | 5,179,000 |
| 1971 | 5,229,000 |
| 1981 | 5,035,000 |
| 1991c | 5,083,000 |
| 2001 | 5,062,000 |
| 2011 | 5,295,000 |
Notes
a. There was no census in 1941 however there was a National Registrar of the Civilian Population in 1939
b. Data for 1961 onwards rounded to nearest thousand
c. Data for 1991 mid-year estimate
Birth and mortality
Table of birth and mortality since 1900
| Average population (x 1000) | Live births | Deaths | Natural change | Crude birth rate (per 1000) | Crude death rate (per 1000) | Natural change (per 1000) | Fertility rate | |
|---|---|---|---|---|---|---|---|---|
| 1900 | 4 437 | 131 401 | 82 296 | 49 105 | 29.6 | 18.5 | 11.1 | |
| 1901 | 4 479 | 132 192 | 80 107 | 52 085 | 29.5 | 17.9 | 11.6 | |
| 1902 | 4 507 | 132 267 | 77 941 | 54 326 | 29.4 | 17.3 | 12.0 | |
| 1903 | 4 536 | 133 525 | 76 002 | 57 523 | 29.4 | 16.8 | 12.7 | |
| 1904 | 4 564 | 132 603 | 77 981 | 54 622 | 29.1 | 17.1 | 12.0 | |
| 1905 | 4 593 | 131 410 | 74 536 | 56 874 | 28.6 | 16.2 | 12.4 | |
| 1906 | 4 621 | 132 005 | 75 635 | 56 370 | 28.6 | 16.4 | 12.2 | |
| 1907 | 4 650 | 128 840 | 77 296 | 51 544 | 27.7 | 16.6 | 11.1 | |
| 1908 | 4 680 | 131 362 | 77 838 | 53 524 | 28.1 | 16.6 | 11.4 | |
| 1909 | 4 709 | 128 669 | 74 632 | 54 037 | 27.3 | 15.8 | 11.5 | |
| 1910 | 4 739 | 124 059 | 72 268 | 51 791 | 26.2 | 15.2 | 11.0 | |
| 1911 | 4 751 | 121 850 | 71 732 | 50 118 | 25.7 | 15.1 | 10.6 | |
| 1912 | 4 741 | 122 790 | 72 340 | 50 450 | 25.9 | 15.3 | 10.6 | |
| 1913 | 4 728 | 120 516 | 73 069 | 47 447 | 25.5 | 15.5 | 10.0 | |
| 1914 | 4 747 | 123 934 | 73 557 | 50 377 | 26.1 | 15.5 | 10.6 | |
| 1915 | 4 771 | 114 181 | 81 631 | 32 550 | 23.9 | 17.1 | 6.8 | |
| 1916 | 4 795 | 109 942 | 70 640 | 39 302 | 22.9 | 14.7 | 8.2 | |
| 1917 | 4 810 | 97 441 | 69 483 | 27 958 | 20.2 | 14.4 | 5.8 | |
| 1918 | 4 812 | 98 554 | 78 372 | 20 182 | 20.5 | 16.3 | 4.2 | |
| 1919 | 4 820 | 106 268 | 75 149 | 31 119 | 22.1 | 15.6 | 6.5 | |
| 1920 | 4 864 | 136 546 | 68 179 | 68 367 | 28.1 | 14.0 | 14.1 | |
| 1921 | 4 882 | 123 201 | 66 210 | 56 991 | 25.2 | 13.6 | 11.7 | |
| 1922 | 4 898 | 115 085 | 72 905 | 42 180 | 23.5 | 14.9 | 8.6 | |
| 1923 | 4 888 | 111 902 | 63 283 | 48 619 | 22.9 | 13.0 | 9.9 | |
| 1924 | 4 862 | 106 900 | 70 357 | 36 543 | 22.0 | 14.5 | 7.5 | |
| 1925 | 4 867 | 104 137 | 65 507 | 38 630 | 21.4 | 13.5 | 7.9 | |
| 1926 | 4 864 | 102 449 | 63 780 | 38 669 | 21.1 | 13.1 | 7.9 | |
| 1927 | 4 853 | 96 672 | 65 830 | 30 842 | 19.9 | 13.6 | 6.4 | |
| 1928 | 4 848 | 96 822 | 65 271 | 31 551 | 20.0 | 13.5 | 6.5 | |
| 1929 | 4 832 | 92 880 | 70 917 | 21 963 | 19.2 | 14.7 | 4.6 | |
| 1930 | 4 828 | 94 549 | 64 285 | 30 264 | 19.6 | 13.3 | 6.3 | |
| 1931 | 4 843 | 92 220 | 64 229 | 27 991 | 19.0 | 13.3 | 5.8 | |
| 1932 | 4 883 | 91 000 | 66 045 | 24 955 | 18.6 | 13.5 | 5.1 | |
| 1933 | 4 912 | 86 546 | 64 848 | 21 698 | 17.6 | 13.2 | 4.4 | |
| 1934 | 4 934 | 88 836 | 63 741 | 25 095 | 18.0 | 12.9 | 5.1 | |
| 1935 | 4 953 | 87 928 | 65 331 | 22 597 | 17.8 | 13.2 | 4.6 | |
| 1936 | 4 966 | 88 928 | 66 749 | 22 179 | 17.9 | 13.4 | 4.5 | |
| 1937 | 4 977 | 87 810 | 68 942 | 18 868 | 17.6 | 13.9 | 3.8 | |
| 1938 | 4 993 | 88 627 | 62 953 | 25 674 | 17.8 | 12.6 | 5.1 | |
| 1939 | 5 007 | 86 913 | 64 413 | 22 500 | 17.4 | 12.9 | 4.5 | |
| 1940 | 5 065 | 86 392 | 72 775 | 13 617 | 17.1 | 14.9 | 2.2 | |
| 1941 | 5 160 | 89 748 | 72 558 | 17 190 | 17.4 | 14.6 | 2.8 | |
| 1942 | 5 174 | 90 703 | 64 963 | 25 740 | 17.5 | 13.2 | 4.3 | |
| 1943 | 5 189 | 94 669 | 66 733 | 27 936 | 18.2 | 13.9 | 4.4 | |
| 1944 | 5 210 | 95 920 | 64 603 | 31 317 | 18.4 | 13.5 | 4.9 | |
| 1945 | 5 187 | 86 924 | 62 655 | 24 269 | 16.8 | 13.1 | 3.7 | |
| 1946 | 5 167 | 104 413 | 64 605 | 39 808 | 20.2 | 13.0 | 7.2 | |
| 1947 | 5 120 | 113 147 | 66 200 | 46 947 | 22.1 | 12.9 | 9.2 | |
| 1948 | 5 150 | 100 344 | 60 979 | 39 365 | 19.5 | 11.8 | 7.6 | |
| 1949 | 5 156 | 95 674 | 63 488 | 32 186 | 18.6 | 12.3 | 6.2 | |
| 1950 | 5 168 | 92 530 | 63 996 | 28 534 | 17.9 | 12.4 | 5.5 | |
| 1951 | 5 102 | 90 639 | 65 778 | 24 861 | 17.8 | 12.9 | 4.9 | |
| 1952 | 5 101 | 90 422 | 61 510 | 28 912 | 17.7 | 12.1 | 5.7 | |
| 1953 | 5 100 | 90 913 | 58 878 | 32 035 | 17.8 | 11.5 | 6.3 | |
| 1954 | 5 104 | 92 315 | 61 380 | 30 935 | 18.1 | 12.0 | 6.1 | |
| 1955 | 5 111 | 92 539 | 61 645 | 30 894 | 18.1 | 12.1 | 6.0 | |
| 1956 | 5 120 | 95 313 | 61 792 | 33 521 | 18.6 | 12.1 | 6.5 | |
| 1957 | 5 125 | 97 977 | 61 143 | 36 834 | 19.1 | 11.9 | 7.2 | |
| 1958 | 5 141 | 99 481 | 62 065 | 37 416 | 19.4 | 12.1 | 7.3 | |
| 1959 | 5 163 | 99 251 | 63 061 | 36 190 | 19.2 | 12.2 | 7.0 | |
| 1960 | 5 178 | 101 292 | 61 764 | 39 528 | 19.6 | 11.9 | 7.6 | |
| 1961 | 5 184 | 101 169 | 63 928 | 37 241 | 19.5 | 12.3 | 7.2 | |
| 1962 | 5 198 | 104 334 | 63 189 | 41 145 | 20.1 | 12.2 | 7.9 | |
| 1963 | 5 205 | 102 691 | 65 521 | 37 170 | 19.7 | 12.6 | 7.1 | |
| 1964 | 5 209 | 104 355 | 61 039 | 43 316 | 20.0 | 11.7 | 8.3 | |
| 1965 | 5 210 | 100 660 | 62 868 | 37 792 | 19.3 | 12.1 | 7.3 | |
| 1966 | 5 201 | 96 536 | 63 689 | 32 847 | 18.6 | 12.2 | 6.3 | |
| 1967 | 5 198 | 96 221 | 59 523 | 36 698 | 18.5 | 11.5 | 7.1 | |
| 1968 | 5 200 | 94 786 | 63 311 | 31 475 | 18.2 | 12.2 | 6.1 | |
| 1969 | 5 209 | 90 290 | 63 821 | 26 469 | 17.3 | 12.3 | 5.1 | |
| 1970 | 5 215 | 87 335 | 63 640 | 23 695 | 16.7 | 12.2 | 4.5 | |
| 1971 | 5 219 | 86 728 | 61 614 | 25 114 | 16.6 | 11.8 | 4.8 | |
| 1972 | 5 223 | 78 550 | 65 017 | 13 533 | 15.0 | 12.4 | 2.6 | |
| 1973 | 5 225 | 74 392 | 64 545 | 9 847 | 14.2 | 12.4 | 1.9 | |
| 1974 | 5 226 | 70 093 | 64 740 | 5 353 | 13.4 | 12.4 | 1.0 | |
| 1975 | 5 227 | 67 943 | 63 125 | 4 818 | 13.0 | 12.1 | 0.9 | |
| 1976 | 5 227 | 64 895 | 65 253 | - 358 | 12.4 | 12.5 | -0.1 | |
| 1977 | 5 226 | 62 342 | 62 294 | 48 | 11.9 | 11.9 | 0.0 | |
| 1978 | 5 212 | 64 295 | 65 123 | - 828 | 12.3 | 12.5 | -0.2 | |
| 1979 | 5 204 | 68 366 | 65 747 | 2 619 | 13.1 | 12.6 | 0.5 | |
| 1980 | 5 194 | 68 892 | 63 299 | 5 593 | 13.3 | 12.2 | 1.1 | |
| 1981 | 5 180 | 69 054 | 63 828 | 5 226 | 13.3 | 12.3 | 1.0 | |
| 1982 | 5 165 | 66 196 | 65 022 | 1 174 | 12.8 | 12.6 | 0.2 | |
| 1983 | 5 148 | 65 078 | 63 454 | 1 624 | 12.6 | 12.3 | 0.3 | |
| 1984 | 5 139 | 65 106 | 62 345 | 2 761 | 12.7 | 12.1 | 0.5 | |
| 1985 | 5 128 | 66 676 | 63 967 | 2 709 | 13.0 | 12.5 | 0.5 | |
| 1986 | 5 112 | 65 812 | 63 467 | 2 345 | 12.9 | 12.4 | 0.5 | |
| 1987 | 5 099 | 66 241 | 62 014 | 4 227 | 13.0 | 12.2 | 0.8 | |
| 1988 | 5 077 | 66 212 | 61 957 | 4 255 | 13.0 | 12.2 | 0.8 | |
| 1989 | 5 078 | 63 480 | 65 017 | -1 537 | 12.5 | 12.8 | -0.3 | |
| 1990 | 5 081 | 65 973 | 61 527 | 4 446 | 13.0 | 12.1 | 0.9 | |
| 1991 | 5 083 | 67 024 | 61 041 | 5 983 | 13.2 | 12.0 | 1.2 | |
| 1992 | 5 086 | 65 789 | 60 937 | 4 852 | 12.9 | 12.0 | 1.0 | |
| 1993 | 5 092 | 63 337 | 64 049 | - 712 | 12.4 | 12.6 | -0.1 | |
| 1994 | 5 102 | 61 656 | 59 328 | 2 328 | 12.1 | 11.6 | 0.5 | |
| 1995 | 5 104 | 60 051 | 60 500 | - 449 | 11.8 | 11.9 | -0.1 | |
| 1996 | 5 092 | 59 296 | 60 654 | -1 358 | 11.6 | 11.9 | -0.3 | |
| 1997 | 5 083 | 59 440 | 59 494 | - 54 | 11.7 | 11.7 | -0.0 | |
| 1998 | 5 077 | 57 319 | 59 164 | -1 845 | 11.3 | 11.7 | -0.4 | |
| 1999 | 5 072 | 55 147 | 60 281 | -5 134 | 10.9 | 11.9 | -1.0 | |
| 2000 | 5 063 | 53 076 | 57 799 | -4 723 | 10.5 | 11.4 | -0.9 | |
| 2001 | 5 064 | 52 527 | 57 380 | -4 853 | 10.4 | 11.3 | -1.0 | |
| 2002 | 5 055 | 51 270 | 58 103 | -6 833 | 10.1 | 11.5 | -1.4 | |
| 2003 | 5 057 | 52 432 | 58 472 | -6 040 | 10.4 | 11.6 | -1.2 | |
| 2004 | 5 078 | 53 957 | 56 187 | -2 230 | 10.6 | 11.1 | -0.4 | |
| 2005 | 5 095 | 54 386 | 55 747 | -1 361 | 10.7 | 10.9 | -0.3 | |
| 2006 | 5 117 | 55 690 | 55 093 | 597 | 10.9 | 10.8 | 0.1 | 1.64 |
| 2007 | 5 144 | 57 781 | 55 986 | 1 795 | 11.2 | 10.9 | 0.3 | 1.70 |
| 2008 | 5 169 | 60 041 | 55 700 | 4 341 | 11.6 | 10.8 | 0.8 | 1.77 |
| 2009 | 5 194 | 59 046 | 53 856 | 5 190 | 11.4 | 10.4 | 1.0 | 1.73 |
| 2010 | 5 222 | 58 791 | 53 967 | 4 824 | 11.3 | 10.3 | 1.0 | 1.72 |
| 2011 | 5 255 | 58 592 | 53 661 | 4 931 | 11.1 | 10.3 | 0.8 | 1.69 |
| 2012 | 5 313 | 58 027 | 54 937 | 3 090 | 10.9 | 10.5 | 0.4 | 1.67 |
| 2013 | 5 327 | 56 014 | 54 700 | 1 314 | 10.6 | 10.3 | 0.3 | 1.61 |
| 2014 | 5 347 | 56 725 | 54 239 | 2 486 | 10.6 | 10.2 | 0.4 | 1.62 |
| 2015 | 55 096 | 57 566 | - 2 470 |
Current natural increase[8]
- Births from January-June 2015 =
 27,036
 - Births from January-June 2016 =
 27,232
- Deaths from January-June 2015 =
 30,428
 - Deaths from January-June 2016 =
 28,935
- Natural increase from January-June 2015 = -3,392
- Natural increase from January-June 2016 = -1,703
Place of birth

Places of birth given by respondents to the 2001 and 2011 censuses were as follows:
| Country of birth | 2001[9] | 2011[10] | ||
|---|---|---|---|---|
| Number | % | Number | % | |
| |
4,410,400 | 87.13% | 4,411,884 | 83.32% |
| |
408,948 | 8.08% | 459,486 | 8.68% |
| |
16,623 | 0.33% | 17,381 | 0.33% |
| |
33,528 | 0.66% | 36,655 | 0.69% |
| |
941 | 0.02% | ||
| |
21,774 | 0.43% | 22,952 | 0.43% |
| |
41,836 | 0.83% | 137,285 | 2.59% |
| |
59,031 | 1.11% | ||
| |
78,254 | 1.48% | ||
| |
127,926 | 2.53% | 209,760 | 3.96% |
| Total | 5,062,011 | 100.00% | 5,295,403 | 100.00% |
Below are the 5 largest foreign-born groups in Scotland according to 2014 ONS estimates.[11]
| Country of birth | Estimated population, 2013 | Estimated population, 2014 | Estimated population, 2015 |
|---|---|---|---|
| 71,000 | 74,000 | 76,000 | |
| 27,000 | 18,000 | 26,000 | |
| 20,000 | 19,000 | 19,000 | |
| 20,000 | 18,000 | 18,000 | |
| 17,000 | 17,000 | 20,000 |
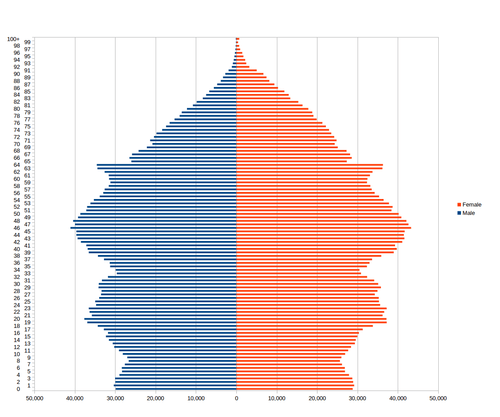
Age
The age distribution based on the 2011 census was as follows.[12]
| Ages attained (years) |
Population | % of total |
|---|---|---|
| 0–4 | 293,000 | 5.53 |
| 5–9 | 270,000 | 5.10 |
| 10–14 | 292,000 | 5.51 |
| 15–19 | 331,000 | 6.25 |
| 20–24 | 364,000 | 6.87 |
| 25–29 | 346,000 | 6.53 |
| 30–34 | 322,000 | 6.08 |
| 35–39 | 340,000 | 6.42 |
| 40–44 | 394,000 | 7.44 |
| 45–49 | 411,000 | 7.76 |
| 50–54 | 376,000 | 7.10 |
| 55–59 | 331,000 | 6.25 |
| 60–64 | 337,000 | 6.35 |
| 65–69 | 262,000 | 4.98 |
| 70–74 | 221,000 | 4.17 |
| 75–79 | 178,000 | 3.36 |
| 80–84 | 123,000 | 2.32 |
| 85–89 | 71,000 | 1.34 |
| 90+ | 37,000 | 0.70 |
Ethnicity
The 2001 and 2011 censuses recorded the following ethnic groups:
| Ethnic Group | 2001[13] | 2011[14] | ||
|---|---|---|---|---|
| Number | % | Number | % | |
| White: Scottish | 4,459,071 | 88.09% | 4,445,678 | 83.95% |
| White: Other British | 373,685 | 7.38% | 417,109 | 7.88% |
| White: Irish | 49,428 | 0.98% | 54,090 | 1.02% |
| White: Gypsy/Traveller[note 1] | 4,212 | 0.08% | ||
| White: Polish[note 2] | 61,201 | 1.16% | ||
| White: Other | 78,150 | 1.54% | 102,117 | 1.93% |
| White: Total | 4,960,334 | 97.99% | 5,084,407 |
96.02% |
| Asian, Asian Scottish or Asian British: Indian | 15,037 | 0.30% | 32,706 | 0.62% |
| Asian, Asian Scottish or Asian British: Pakistani | 31,793 | 0.63% | 49,381 | 0.93% |
| Asian, Asian Scottish or Asian British: Bangladeshi | 1,981 | 0.04% | 3,788 | 0.07% |
| Asian, Asian Scottish or Asian British: Chinese | 16,310 | 0.32% | 33,706 | 0.64% |
| Asian, Asian Scottish or Asian British: Asian Other | 6,196 | 0.12% | 21,097 | 0.40% |
| Asian, Asian Scottish or Asian British: Total | 71,317 | 1.41% | 140,678 | 2.66% |
| Black, Black Scottish or Black British[note 3] | 6,247 | 0.12% | ||
| African: African, African Scottish or African British | 29,186 | 0.55% | ||
| African: Other African | 452 | 0.01% | ||
| African: Total | 29,638 |
0.56% | ||
| Caribbean | 3,430 | 0.06% | ||
| Black | 2,380 | 0.04% | ||
| Caribbean or Black: Other | 730 | 0.01% | ||
| Caribbean or Black: Total | 6,540 | 0.12% | ||
| Mixed or multiple ethnic groups: Total | 12,764 | 0.25% | 19,815 |
0.37% |
| Other: Arab[note 4] | 9,366 | 0.18% | ||
| Other: Any other ethnic group | 9,571 | 0.19% | 4,959 | 0.09% |
| Other: Total | 9,571 | 0.19% | 14,325 |
0.27% |
| Total | 5,062,011 | 100.00% | 5,295,403 |
100.00% |
- ↑ New category created for the 2011 census
- ↑ New category created for the 2011 census
- ↑ Category restructured for the 2011 census
- ↑ New category created for the 2011 census
National identity
A question on national identity was asked in the 2011 census: "what do you feel is your national identity?". Respondents could identify themselves as having more than one national identity.
In the 2011 census:[15]
- 62% identified themselves as 'Scottish only'
- 18% identified themselves as 'Scottish' and 'British'
- 8% identified themselves as 'British only'
- 2% identified themselves as 'Scottish' together with some other identity.
- the remainder chose other national identities.
The council areas with at least 90% of the population stating some 'Scottish' national identity were North Lanarkshire, Inverclyde, East Ayrshire and West Dunbartonshire. The lowest proportions of people stating some 'Scottish' national identity were in Edinburgh (70%) and Aberdeen (75%).[16]
The council areas with the highest proportions of people stating 'British' as their only national identity were Argyll and Shetland, each with 12%.[16]
Religion
The statistics from the 2011 census and the 2001 census are set out below.
| Current religion | 2001[17] | 2011[18] | ||
|---|---|---|---|---|
| Number | % | Number | % | |
| Church of Scotland | 2,146,251 | 42.4 | 1,717,871 | 32.4 |
| Roman Catholic | 803,732 | 15.9 | 841,053 | 15.9 |
| Other Christian | 344,562 | 6.8 | 291,275 | 5.5 |
| Total Christian | 3,294,545 | 65.1 | 2,850,199 | 53.8 |
| Islam | 42,557 | 0.8 | 76,737 | 1.4 |
| Hinduism | 5,564 | 0.1 | 16,379 | 0.3 |
| Buddhism | 6,830 | 0.1 | 12,795 | 0.2 |
| Sikhism | 6,572 | 0.1 | 9,055 | 0.2 |
| Judaism | 6,448 | 0.1 | 5,887 | 0.1 |
| Other religion | 26,974 | 0.5 | 15,196 | 0.3 |
| No religion | 1,394,460 | 27.6 | 1,941,116 | 36.7 |
| Religion not stated | 278,061 | 5.5 | 368,039 | 7.0 |
| No religion/Not stated total | 1,672,521 | 33.0 | 2,309,155 | 43.6 |
| Total population | 5,062,011 | 100.0 | 5,295,403 | 100.0 |
Languages
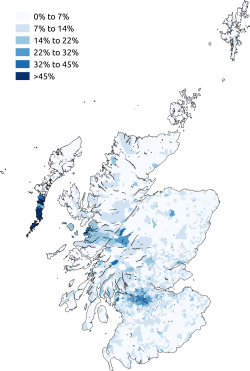
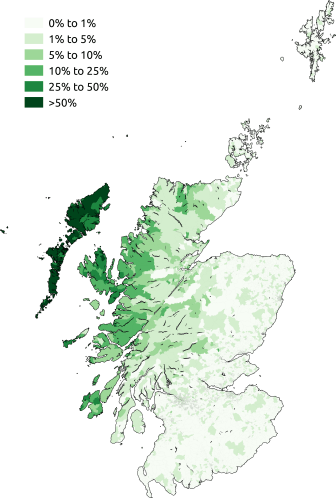
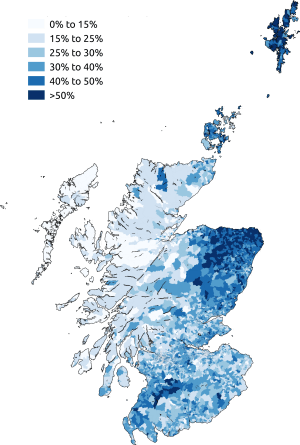
English is by far the most commonly spoken language in Scotland. Two regional languages of Scotland, Scottish Gaelic and Scots, are protected under the European Charter for Regional or Minority Languages. Abilities in these languages for those aged three and above were recorded in the UK census 2011 as follows.[19]
| Ability | Scottish Gaelic | Scots | ||
|---|---|---|---|---|
| Usual residents aged 3+ | Proportion | Usual residents aged 3+ | Proportion | |
| Understands but does not speak, read or write | 23,357 | 0.46% | 267,412 | 5.22% |
| Speaks, reads and writes | 32,191 | 0.63% | 1,225,622 | 23.95% |
| Speaks but does not read or write | 18,966 | 0.37% | 179,295 | 3.50% |
| Speaks and reads but does not write | 6,218 | 0.12% | 132,709 | 2.59% |
| Reads but does not speak or write | 4,646 | 0.09% | 107,025 | 2.09% |
| Other combination of skills | 1,678 | 0.03% | 17,381 | 0.34% |
| No skills | 5,031,167 | 98.30% | 3,188,779 | 62.30% |
| Total | 5,118,223 | 100.00% | 5,118,223 | 100.00% |
| Can speak | 57,602 | 1.13% | 1,541,693 | 30.12% |
| Has some ability | 87,056 | 1.70% | 1,929,444 | 37.70% |
| Distribution of those who stated they could speak a regional language in the 2011 census. | ||||
|---|---|---|---|---|
|
Several other languages are spoken amongst immigrants to Scotland. The most commonly spoken of these is Polish. In the 2011 census 54,186 respondents aged three and over said that Polish was their main language, amounting to 1.06% of the total population of Scotland aged three and over.
Historical demography

At times during the last interglacial period (130,000– 70,000 BC) Europe had a climate warmer than today's, and early humans may have made their way to what is now Scotland, though archaeologists have found no traces of this. Glaciers then scoured their way across most of Britain, and only after the ice retreated did Scotland again become habitable, around 9600 BC.[20] Mesolithic hunter-gatherer encampments formed the first known settlements, and archaeologists have dated a site near Biggar to around 8500 BC.[21] Numerous other sites found around Scotland build up a picture of highly mobile boat-using people making tools from bone, stone and antlers, probably with a very low density of population.[22] Neolithic farming brought permanent settlements, such as the stone house at Knap of Howar on Papa Westray dating from 3500 BC, and greater concentrations of population. Extensive analyses of Black Loch in Fife indicate that arable land spread at the expense of forest from about 2000 BC until the period of the first century AD Roman advance into lowland Scotland, suggesting an expanding settled population. Thereafter, there was re-growth of birch, oak and hazel for a period of five centuries, suggesting that the Roman invasions had a negative impact on the native population.[23]
There are almost no written sources from which to re-construct the demography of early medieval Scotland. Estimates have been made of a population of 10,000 inhabitants in Dál Riata and 80-100,000 for Pictland, which was probably the largest region.[24] It is likely that the 5th and 6th centuries saw higher mortality rates due to the appearance of bubonic plague, which may have reduced net population.[25] The examination of burial sites for this period like that at Hallowhill, St Andrews indicate a life expectancy of only 26–29.[24] The known conditions have been taken to suggest it was a high fertility, high mortality society, similar to many developing countries in the modern world, with a relatively young demographic profile, and perhaps early childbearing, and large numbers of children for women. This would have meant that there were a relatively small proportion of available workers to the number of mouths to feed. This would have made it difficult to produce a surplus that would allow demographic growth and more complex societies to develop.[26] From the formation of the kingdom of Alba in the tenth century, to before the Black Death reached the country in 1349, estimates based on the amount of farmable land, suggest that population may have grown from half a million to a million.[27] Although there is no reliable documentation on the impact of the plague, there are many anecdotal references to abandoned land in the following decades. If the pattern followed that in England, then the population may have fallen to as low as half a million by the end of the 15th century.[28] Compared with the situation after the redistribution of population in the later clearances and the industrial revolution, these numbers would have been relatively evenly spread over the kingdom, with roughly half living north of the Tay.[29] Perhaps ten per cent of the population lived in one of many burghs that grew up in the later medieval period, mainly in the east and south. It has been suggested that they would have had a mean population of about 2,000, but many would be much smaller than 1,000 and the largest, Edinburgh, probably had a population of over 10,000 by the end of the era.[30]
Calculations based on Hearth Tax returns for 1691 indicate a population of 1,234,575, but this figure may have been seriously affected by the famines of the 1690s. The first reliable information is a census conducted by the Reverend Alexander Webster in 1755, which shows the inhabitants of Scotland as 1,265,380.[31] By the time of the first decadal census in 1801, the population was 1,608,420. Scotland grew steadily in the 19th century, to 2,889,000 in 1851 and 4,472,000 in 1901.[32] Even with the growth of industry there were insufficient good jobs, as a result, during the period 1841-1931, about 2 million Scots emigrated to North America and Australia, and another 750,000 Scots relocated to England.[33]
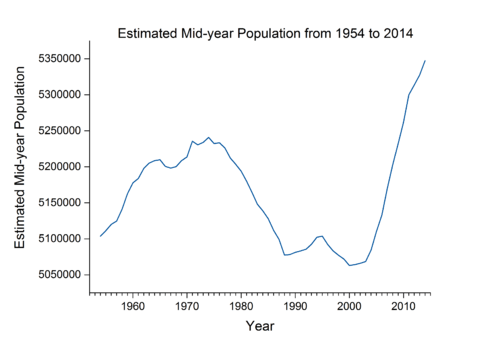
With a population of 4.8 million in 1911, Scotland sent 690,000 men to First World War, of whom 74,000 died in combat or from disease, and 150,000 were seriously wounded.[34][35] Thus, although Scots were only 10 per cent of the British population, they made up 15 per cent of the national armed forces and eventually accounted for 20 per cent of the dead.[36] While emigration began to tail off in England and Wales after the First World War,[37] it continued apace in Scotland, with 400,000 Scots, ten per cent of the population, estimated to have left the country between 1921 and 1931.[38] When the Great Depression hit in the 1930s there were no easily available jobs in the US and Canada and emigration fell to less than 50,000 a year, bringing to an end the period of mass migrations that had opened in the mid-18th century.[39] This contributed to the growth of the population, which reached a peak of 5,240,800 in 1974. Thereafter it began to fall slowly, moving down to 5,062,940 in 2000. There was also a decrease in some urban populations as a result of policies of slum clearance, overspill and relocation to new towns, with the population of Glasgow falling from over a million in 1951 to 629,000 in 2001. Rural areas also saw a loss of population, particularly the Highlands and Hebrides.[40]
Population change

From the 1960s to early 1970s Scotland experienced a gradual increase in population, however from 1974 there was a natural decrease in population, with both an excess of deaths over births and of emigration over immigration - particularly to the rest of the United Kingdom.[2]
Fertility and morbidity rates
Both the Scottish Government and leading academics in Scotland had expressed some concern over the historic falling annual number of births in Scotland. In 2002, according to the GROS, the number of live births in Scotland was the lowest ever recorded, at 51,270. In 2004, for example, there were 4,012 more deaths than births, although for the subsequent five years this process had been reversed with 4,342 more births than deaths in 2008. The long-term reversal in the declining birth rate of the 1990s was confirmed in 2009 when the Registrar General for Scotland reported that with 60,000 births recorded in 2008, this was the highest recorded fertility rate since 1995.[41]
The population of children under age 5 grew by 6% (293,000) over the ten-year period between 2001 and 2011. However, the number of children aged 5–14 fell by 11% (69,000). The population of people over 65 also grew by 11% (85,000) and they now represent 17% of the total population and for the first time there are more people over 65 than under 15 years of age. Significantly, in 2011 there were 230,000 people over 80 years of age.[42]
Migration
Politicians and academics also noted that in the first years of the 21st century the previous trend of a net migration away from Scotland had reversed with significant immigration to Scotland from the rest of the United Kingdom. Between 2001 and 2011 Scotland's population grew by 5% (233,000), the fastest rate of growth for at least 100 years.[42] Similarly, since 2004 there had also been a growing influx of arrivals from the new EU accession states such as Poland, Czech Republic, Lithuania and Latvia, contributing to the recent growth of the population. Consequently, since 2002 the birth rate gradually increased with 53,957 births recorded in 2004, and in 2008 the number of live births was 60,041[43]
The Scottish Government has responded to these demographic trends by setting up the Fresh Talent - Working in Scotland Scheme open to foreign (non-EU) graduates from Scotland's universities allowing them a 2-year residency period after graduation.[44]
Population projections
In its 2011 review the GROS predicted that Scotland's population would rise by 10% to 5.76 million by 2035 and to 6.2m by 2085. Until 2028 both net inward migration and the birth rate exceeding the death rate would contribute to this growth, however beyond this date population increase would be due only to a positive net migration as the ageing population would result in more deaths than births. This later trend would be dramatic with the number of children under 16 projected to rise by only 3% while the number of people over 65 is projected to increase by 63% (from 0.88m to 1.43m).[2]
Council Area Population Estimates
| Local Council Area | Population (2001) | Population (2011) | % change (2001–11) |
|---|---|---|---|
| Aberdeen City | 212,125 | 222,800 | 5.0 |
| Aberdeenshire | 226,871 | 253,000 | 11.5 |
| Angus | 108,400 | 116,000 | 7.0 |
| Argyll and Bute | 91,306 | 88,200 | −3.4 |
| Clackmannanshire | 48,077 | 51,400 | 7.0 |
| Dumfries and Galloway | 147,765 | 151,300 | 2.4 |
| Dundee City | 145,663 | 147,300 | 1.1 |
| East Ayrshire | 120,235 | 122,700 | 2.1 |
| East Dunbartonshire | 108,243 | 105,000 | −3.0 |
| East Lothian | 90,088 | 99,700 | 10.7 |
| East Renfrewshire | 89,311 | 90,600 | 1.4 |
| City of Edinburgh | 448,624 | 476,600 | 6.2 |
| Na h-Eileanan Siar | 26,502 | 27,700 | 4.5 |
| Falkirk | 145,191 | 156,000 | 7.4 |
| Fife | 349,429 | 365,200 | 4.5 |
| Glasgow City | 577,869 | 593,200 | 2.7 |
| Highland | 208,914 | 232,100 | 11.1 |
| Inverclyde | 84,203 | 81,500 | −3.2 |
| Midlothian | 80,941 | 83,200 | 2.8 |
| Moray | 86,940 | 93,300 | 7.3 |
| North Ayrshire | 135,817 | 138,200 | 1.7 |
| North Lanarkshire | 321,067 | 337,800 | 5.2 |
| Orkney Islands | 19,245 | 21,400 | 10.9 |
| Perth and Kinross | 134,949 | 146,700 | 8.7 |
| Renfrewshire | 172,867 | 174,900 | 1.2 |
| Scottish Borders | 106,764 | 113,900 | 6.7 |
| Shetland Islands | 21,988 | 23,200 | 5.3 |
| South Ayrshire | 112,097 | 112,800 | 0.6 |
| South Lanarkshire | 302,216 | 313,800 | 3.8 |
| Stirling | 86,212 | 90,200 | 4.7 |
| West Dunbartonshire | 93,378 | 90,700 | −2.8 |
| West Lothian | 158,714 | 175,100 | 10.3 |
Other Miscellaneous statistics
Sex ratio:
at birth: 1.04 male(s)/female
under 15 years: 1.04 male(s)/female
15-64 years: 0.94 male(s)/female
65 years and over: 0.88 male(s)/female
total population: 0.94 male(s)/female (Mid-2011 est.)
Infant mortality rate: 4.1 deaths/1,000 live births (2011 est.)[46]
Life expectancy at birth (2011):[2]
total population: 78.4 years for those born in 2010 (cf. 72.2 in 1981)
male: 76.1 years for those born in 2010 (cf. 69.1 in 1981)
female: 80.6 years for those born in 2010 (cf. 75.3 in 1981)
General fertility rate:[2] The general Fertiity Rate (GFR) is based on the rate of births per 1000 females of child-bearing age (i.e. 15–44 years of age).
In 2011 it was 56.4 births per 1000 women. For comparison, during the latter part of the 20th century it was at its highest during the 'baby boom' of the 1960s. The GFR reached a peak of 99.5 births per 1000 women in 1962. In 2001 the GFR had fallen to its lowest post World War II level of 50births per 1000 women.
Languages: English, Scots (including Doric, Central and Border) and Gaelic
Marriages:[2] In 2011 there were 29,135 marriages in Scotland. This is a 2.3% increase on 2010.
By way of historical comparison, the highest ever recorded was 53,522 in 1940. In the 1970s there were on average between 40-45,000 marriages per annum. The lowest annual figure in recent years was 27,524 in 2009 and lowest on record was 19,655 in 1858.
Of specific interest were the number of so-called 'tourist marriages', where neither partner was resident in Scotland. In 2011 there were 6,829 such marriages, of which 48% took place at Gretna, the most popular of all wedding venues.
Civil Partnerships[2] The Civil Partnership Act 2004 came into force in December 2005. In 2006 the number of civil partnership registrations was 1,047. A one-off figure given the number of long-standing relationships which already existed which could be registered. Since then the numer of ceremonies each year fell from 688 in 2007 to 465 registrations in 2010. 2011 saw the first increase since 2006 with 554 registrations.
Literacy:
definition: age 15 and over can read and write
total population: 99%
male: 99%
female: 99% (2005 est)
Higher education 95% of Scottish higher education students study in universities in Scotland.
See also
- Demography of the United Kingdom
- Demography of England
- Demography of Wales
- Demography of Northern Ireland
- Demography of Glasgow
- Politics of Scotland
- Scottish people
- New Scots
- Fresh Talent Initiative
- Population
- United Kingdom Census 2001
- Italian-Scots
- List of census localities in Scotland
References
- ↑ "2011 Census: First Results on Population Estimates for Scotland - Release 1A". National Records of Scotland. 17 December 2012. Retrieved 20 December 2012.
- 1 2 3 4 5 6 7 The Registrar General’s Annual Review of Demographic Trends 157th Edition 2011, Accessed 10 February 2013
- 1 2 Scotland's Census 2011 Census Day usual resident 1 population estimates by council area , Accessed 9 February 2013
- ↑ "National Records of Scotland", Scottish Government news release, retrieved 10 February 2013
- ↑ Genuki UK and Ireland Genealogy, Accessed 11 February 2013
- ↑ Websters Scottish Population Statistics of 1751 edited, updated and reprinted by James Grey Kyd in 1951, Accessed 11 February 2013
- ↑ Census day estimates 1911 - 2011, Accessed 28 February 2013
- ↑ "Births, Deaths and Other Vital Events - Quarterly Figures". National Records of Scotland. Retrieved 18 November 2016.
- ↑ 2001 Census for Scotland scrol analyser, Accessed 6 September 2014
- ↑ 2011 Census for Scotland Standard Outputs, Accessed 5 September 2014
- ↑ "Table 1.3: Overseas-born population in the United Kingdom, excluding some residents in communal establishments, by sex, by country of birth, January 2014 to December 2014". Office for National Statistics. 27 August 2015. Retrieved 17 April 2016. Figures given are the central estimates. See the source for 95 per cent confidence intervals.
- ↑ 2011 Census for Scotland Age Distribution, Accessed 28 February 2013
- ↑ "Analysis of Ethnicity in the 2001 Census - Summary Report". Retrieved 6 September 2014.
- ↑ "Scotland's Census 2011 - Standard Outputs". Retrieved 6 September 2014.
- ↑ "Census 2011: Detailed characteristics on Ethnicity, Identity, Language and Religion in Scotland – Release 3A". 27 February 2014. Retrieved 20 February 2016.
- 1 2 "Scotland's Census 2011 - Analysis: National Identity". Retrieved 22 September 2014.
- ↑ "Analysis of Religion in the 2001 Census". The Scottish Government. 17 May 2006. Archived from the original on 6 June 2011.
- ↑ "Scotland's Census 2011 – Table KS209SCb" (PDF). scotlandscensus.gov.uk. Retrieved 26 September 2013.
- ↑ "Scotland's Census 2011 - Standard Outputs". Retrieved 7 September 2014.
- ↑ F. Pryor, Britain B.C.: life in Britain and Ireland before the Romans (London: Harper Collins, 2003), p. 99.
- ↑ "Signs of Earliest Scots Unearthed". BBC News. 2009-04-09. Retrieved 2009-07-15.
- ↑ P. J. Ashmore, Neolithic and Bronze Age Scotland: An authoritative and Lively Account of an Enigmatic Period of Scottish Prehistory (2003).
- ↑ T. C. Smout, R. MacDonald and F. Watson, A History of the Native Woodlands of Scotland 1500-1920. Edinburgh University Press ISBN 9780748632947, p. 34.
- 1 2 L. R. Laing, The Archaeology of Celtic Britain and Ireland, c. AD 400-1200 (Cambridge: Cambridge University Press, 2006), ISBN 0521547407, pp. 21-2.
- ↑ P. Fouracre and R. McKitterick, eds, The New Cambridge Medieval History: c. 500-c. 700 (Cambridge: Cambridge University Press, 2005), ISBN 0521362911, p. 234.
- ↑ A. Woolf, From Pictland to Alba: 789 - 1070 (Edinburgh: Edinburgh University Press, 2007), ISBN 0748612343, pp. 17-20.
- ↑ R. E. Tyson, "Population Patterns", in M. Lynch, ed., The Oxford Companion to Scottish History (New York, 2001), pp. 487–8.
- ↑ S. H. Rigby, ed., A Companion to Britain in the Later Middle Ages (Oxford: Wiley-Blackwell, 2003), ISBN 0631217851, pp. 109-11.
- ↑ J. Wormald, Court, Kirk, and Community: Scotland, 1470-1625 (Edinburgh: Edinburgh University Press, 1991), ISBN 0748602763, p. 61.
- ↑ E. Gemmill and N. J. Mayhew, Changing Values in Medieval Scotland: a Study of Prices, Money, and Weights and Measures (Cambridge: Cambridge University Press, 1995), ISBN 0521473853, pp. 8-10.
- ↑ K. J. Cullen, Famine in Scotland: The 'Ill Years' of The 1690s (Edinburgh: Edinburgh University Press, 2010), ISBN 0748638873, pp. 123-4.
- ↑ A. K. Cairncross, The Scottish Economy: A Statistical Account of Scottish Life by Members of the Staff of Glasgow University (Glasgow: Glasgow University Press, 1953), p. 10.
- ↑ R. A. Houston and W. W. Knox, eds, The New Penguin History of Scotland (London: Penguin, 2001), ISBN 0140263675, p. xxxii.
- ↑ I. F. W. Beckett and K. R. Simpson, eds. A Nation in Arms: a Social Study of the British Army in the First World War (Manchester: Manchester University Press, 1985), ISBN 0719017378, p. 11.
- ↑ R. A. Houston and W. W. Knox, eds, The New Penguin History of Scotland (London: Penguin, 2001), ISBN 0140263675, p. 426.
- ↑ J. Buchanan, Scotland (Langenscheidt, 3rd edn., 2003), p. 49.
- ↑ F. M. L. Thompson, The Cambridge Social History of Britain, 1750-1950: People and Their Environment (Cambridge: Cambridge University Press, 1990), ISBN 0521438136, pp. 9-10.
- ↑ J. Buchanan, Scotland (Langenscheidt, 3rd edn., 2003), p. 51.
- ↑ S. M. Millett, The Scottish Settlers of America: the 17th and 18th Centuries (Genealogical Publishing Com, 2009), p. 64.
- ↑ C. G. Brown, "Charting everyday experience", in L. Abrams and C. G. Brown, A History of Everyday Life in Twentieth-Century Scotland (Edinburgh: Edinburgh University Press, 2010), ISBN 0748624317, p. 20.
- ↑ Press Release: Births Increase for the Sixth Consecutive Year, Accessed 9 February 2013
- 1 2 Press Release: First Results of Scotland's 2011 Census, Accessed 9 February 2013
- ↑ Scotland's population swelled by largest immigration in 50 years "The Scotsman" 28 April 2005
- ↑ http://www.scotland.gov.uk/Topics/Government/Promoting-Scotland/18738/14640 Archived April 16, 2005, at the Wayback Machine.
- ↑ 2011 Census: First Results on Population and Household Estimates for Scotland Census day usually resident population by council area, 2001 and 2011; , Accessed 22 March 2013
- ↑ "Table 4.2: Stillbirth,1 perinatal, neonatal, postneonatal and infant death rates, Scotland, 1946 to 2011" (PDF). General Register Office for Scotland. Retrieved 4 March 2013.
External links
- General Register Office for Scotland
- Scotland's People - the official government source of genealogical data for Scotland
- Scottish Government
- Government Actuary's Department
- Scotland's Population - The Scotsman
- Scotland's Census Results Online (Scrol)
Scotland articles | |||||||||||||||||||
|---|---|---|---|---|---|---|---|---|---|---|---|---|---|---|---|---|---|---|---|
| History |
|  | |||||||||||||||||
| Geography | |||||||||||||||||||
| Politics |
| ||||||||||||||||||
| Economy | |||||||||||||||||||
| Society |
| ||||||||||||||||||
| |||||||||||||||||||