Demographics of Finland
This article is about the demographic features of the population of Finland, including population density, ethnicity, education level, health of the populace, economic status, religious affiliations and other aspects of the population.
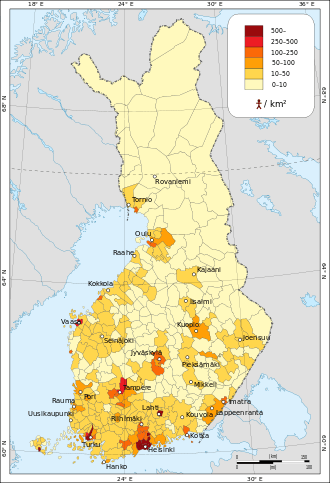
Finland numbers some 5.4 million people and has an average population density of 17 inhabitants per square kilometre. This makes it the third most sparsely populated country in Europe, after Iceland and Norway. Population distribution is very uneven: the population is concentrated on the small southwestern coastal plain. About 85%[1] live in towns and cities, with one million living in the Helsinki Metropolitan Area alone. In Arctic Lapland, on the other hand, there are only 2 people to every square kilometre.
Finland is a relatively ethnically homogeneous country. The dominant ethnicity is the Finnish people but there are also notable historic minorities of Swedes, Sami and Roma people. As a result of recent immigration there are now also considerable groups of ethnic Russians, Estonians and Somalis in the country. The official languages are Finnish and Swedish, the latter being the native language of about five per cent of the Finnish population.[2] From the 13th to the early 19th century Finland was a part of the Sweden.
With 79 percent of Finns in its congregation, the Lutheran Church is the largest religious group in the country.
The earliest inhabitants of most of the land area that makes up today's Finland and Scandinavia were in all likehood hunter-gatherers whose closest successors in modern terms would probably be the Sami people (formerly known as the Lapps). There are 4,500 of them living in Finland today and they are recognised as a minority and speak three distinct languages: Northern Sami, Inari Sami and Skolt Sami. They have been living north of the Arctic Circle for more than 7,000 years now, but today are a 5% minority in their native Lapland Province. During the late 19th and 20th century there was significant emigration, particularly from rural areas to Sweden and North America, while most immigrants into Finland itself come from other European countries.
| Historical population | ||
|---|---|---|
| Year | Pop. | ±% |
| 1750 | 421,000 | — |
| 1760 | 490,000 | +16.4% |
| 1770 | 560,000 | +14.3% |
| 1780 | 660,000 | +17.9% |
| 1790 | 706,000 | +7.0% |
| 1800 | 837,000 | +18.6% |
| 1810 | 863,000 | +3.1% |
| 1820 | 1,177,500 | +36.4% |
| 1830 | 1,372,100 | +16.5% |
| 1840 | 1,445,600 | +5.4% |
| 1850 | 1,636,900 | +13.2% |
| 1860 | 1,746,700 | +6.7% |
| 1870 | 1,768,800 | +1.3% |
| 1880 | 2,060,800 | +16.5% |
| 1890 | 2,380,100 | +15.5% |
| 1900 | 2,655,900 | +11.6% |
| 1910 | 2,943,400 | +10.8% |
| 1920 | 3,147,600 | +6.9% |
| 1930 | 3,462,700 | +10.0% |
| 1940 | 3,695,610 | +6.7% |
| 1950 | 4,029,800 | +9.0% |
| 1960 | 4,496,220 | +11.6% |
| 1970 | 4,598,330 | +2.3% |
| 1980 | 4,787,770 | +4.1% |
| 1990 | 4,998,480 | +4.4% |
| 2000 | 5,181,000 | +3.7% |
| 2010 | 5,375,300 | +3.8% |
| 2016 | 5,488,600 | +2.1% |
| Population size prior to 1812 may be affected by changes on administrative divisions. | ||
Centre of population
The geographical center of population (Weber point) of the Finnish population is currently located in Hauho, in the village of Sappee, now part of the town of Hämeenlinna. The coordinates of this point are 61' 17" N, 24' 67" E.[3]
Age structure
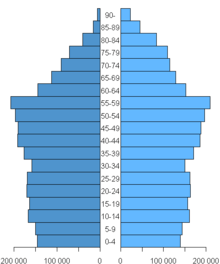
At the end of 2011.[2]
- 0–14 years: 16.5% = 888,982 (male 454,222; female 434,810)
- 15–64 years: 65.4% = 3,532,645 (male 1,786,688; female 1,745,957)
- 65 years and over: 18.1% = 979 640 (male 411,674; female 567,966)
Families
The profound demographic and economic changes that occurred in Finland after World War II affected the Finnish family. Families became smaller, dropping from an average of 3.6 persons in 1950 to an average of 2.7 by 1975. Family composition did not change much in that quarter of a century, however, and in 1975 the percentage of families that consisted of a man and a woman was 24.4; of a couple and children, 61.9; of a woman with offspring, 11.8; of a man and offspring, 1.9. These percentages are not markedly different from those of 1950. Change was seen in the number of children per family, which fell from an average of 2.24 in 1950 to an average of 1.7 in the mid-1980s, and large families were rare. Only 2 percent of families had four or more children, while 51 percent had one child; 38 percent, two children; and 9 percent, three children. The number of Finns under the age of 18 dropped from 1.5 million in 1960 to 1.2 million in 1980.[4]
Vital statistics
Data according to Statistics Finland, which collects the official statistics for Finland.[5]
| Average population (x 1000) | Live births | Deaths | Natural change | Crude birth rate (per 1000) | Crude death rate (per 1000) | Natural change (per 1000) | Total fertility rate | |
|---|---|---|---|---|---|---|---|---|
| 1900 | 2 646 | 86 339 | 57 915 | 28 424 | 32.6 | 21.9 | 10.7 | 4.83 |
| 1901 | 2 667 | 88 637 | 56 225 | 32 412 | 33.2 | 21.1 | 12.2 | 4.92 |
| 1902 | 2 686 | 87 082 | 50 999 | 36 083 | 32.4 | 19.0 | 13.4 | 4.79 |
| 1903 | 2 706 | 85 120 | 49 992 | 35 128 | 31.5 | 18.5 | 13.0 | 4.62 |
| 1904 | 2 735 | 90 253 | 50 227 | 40 026 | 33.0 | 18.4 | 14.7 | 4.85 |
| 1905 | 2 762 | 87 841 | 52 773 | 35 068 | 31.8 | 19.1 | 12.7 | 4.67 |
| 1906 | 2 788 | 91 401 | 50 857 | 40 544 | 32.8 | 18.2 | 14.5 | 4.81 |
| 1907 | 2 821 | 92 457 | 53 028 | 39 429 | 32.8 | 18.8 | 14.0 | 4.76 |
| 1908 | 2 861 | 92 146 | 55 305 | 36 841 | 32.2 | 19.3 | 12.9 | 4.65 |
| 1909 | 2 899 | 95 005 | 50 577 | 44 428 | 32.8 | 17.4 | 15.3 | 4.72 |
| 1910 | 2 929 | 92 984 | 51 007 | 41 977 | 31.7 | 17.4 | 14.3 | 4.60 |
| 1911 | 2 962 | 91 238 | 51 648 | 39 590 | 30.8 | 17.4 | 13.4 | 4.46 |
| 1912 | 2 998 | 92 275 | 51 645 | 40 630 | 30.8 | 17.2 | 13.5 | 4.45 |
| 1913 | 3 026 | 87 250 | 51 876 | 35 374 | 28.8 | 17.1 | 11.7 | 4.15 |
| 1914 | 3 053 | 87 577 | 50 690 | 36 887 | 28.7 | 16.6 | 12.1 | 4.13 |
| 1915 | 3 083 | 83 306 | 52 205 | 31 101 | 27.0 | 16.9 | 10.1 | 3.89 |
| 1916 | 3 105 | 79 653 | 54 577 | 25 076 | 25.7 | 17.6 | 8.1 | 3.69 |
| 1917 | 3 124 | 81 046 | 58 863 | 22 183 | 25.9 | 18.8 | 7.1 | 3.71 |
| 1918 | 3 125 | 79 494 | 95 102 | -15 608 | 25.4 | 30.4 | -5.0 | 3.60 |
| 1919 | 3 117 | 63 896 | 62 932 | 964 | 20.5 | 20.2 | 0.3 | 2.87 |
| 1920 | 3 133 | 84 714 | 53 304 | 31 410 | 27.0 | 17.0 | 10.0 | 3.76 |
| 1921 | 3 170 | 82 165 | 47 361 | 34 804 | 25.9 | 14.9 | 11.0 | 3.58 |
| 1922 | 3 211 | 80 140 | 49 180 | 30 960 | 25.0 | 15.3 | 9.6 | 3.43 |
| 1923 | 3 243 | 81 961 | 47 556 | 34 405 | 25.3 | 14.7 | 10.6 | 3.44 |
| 1924 | 3 272 | 78 057 | 53 442 | 24 615 | 23.9 | 16.3 | 7.5 | 3.22 |
| 1925 | 3 304 | 78 260 | 47 493 | 30 767 | 23.7 | 14.4 | 9.3 | 3.17 |
| 1926 | 3 339 | 76 875 | 47 526 | 29 349 | 23.0 | 14.2 | 8.8 | 3.02 |
| 1927 | 3 368 | 75 611 | 51 727 | 23 884 | 22.5 | 15.4 | 7.1 | 2.92 |
| 1928 | 3 396 | 77 523 | 48 713 | 28 810 | 22.8 | 14.3 | 8.5 | 2.92 |
| 1929 | 3 424 | 76 011 | 54 489 | 21 522 | 22.2 | 15.9 | 6.3 | 2.83 |
| 1930 | 3 449 | 75 236 | 48 240 | 26 996 | 21.8 | 14.0 | 7.8 | 2.75 |
| 1931 | 3 476 | 71 866 | 48 968 | 22 898 | 20.7 | 14.1 | 6.6 | 2.59 |
| 1932 | 3 503 | 69 352 | 46 700 | 22 652 | 19.8 | 13.3 | 6.5 | 2.46 |
| 1933 | 3 526 | 65 047 | 47 960 | 17 087 | 18.4 | 13.6 | 4.8 | 2.27 |
| 1934 | 3 549 | 67 713 | 46 318 | 21 395 | 19.1 | 13.1 | 6.0 | 2.33 |
| 1935 | 3 576 | 69 942 | 45 370 | 24 572 | 19.6 | 12.7 | 6.9 | 2.37 |
| 1936 | 3 601 | 68 895 | 49 124 | 19 771 | 19.1 | 13.6 | 5.5 | 2.31 |
| 1937 | 3 626 | 72 319 | 46 466 | 25 853 | 19.9 | 12.8 | 7.1 | 2.52 |
| 1938 | 3 656 | 76 695 | 46 930 | 29 765 | 21.0 | 12.8 | 8.1 | 2.52 |
| 1939 | 3 686 | 78 164 | 52 614 | 25 550 | 21.2 | 14.3 | 6.9 | 2.56 |
| 1940 | 3 698 | 65 849 | 71 846 | -5 997 | 17.8 | 19.4 | -1.6 | 2.15 |
| 1941 | 3 702 | 89 565 | 73 334 | 16 231 | 24.2 | 19.8 | 4.4 | 2.90 |
| 1942 | 3 708 | 61 672 | 56 141 | 5 531 | 16.6 | 15.1 | 1.5 | 2.00 |
| 1943 | 3 721 | 76 112 | 49 634 | 26 478 | 20.5 | 13.3 | 7.1 | 2.46 |
| 1944 | 3 735 | 79 446 | 70 570 | 8 876 | 21.3 | 18.9 | 2.4 | 2.56 |
| 1945 | 3 758 | 95 758 | 49 046 | 46 712 | 25.5 | 13.1 | 12.4 | 3.07 |
| 1946 | 3 806 | 106 075 | 44 748 | 61 327 | 27.9 | 11.8 | 16.1 | 3.41 |
| 1947 | 3 859 | 108 168 | 46 053 | 62 115 | 28.0 | 11.9 | 16.1 | 3.47 |
| 1948 | 3 912 | 107 759 | 43 668 | 64 091 | 27.5 | 11.2 | 16.4 | 3.47 |
| 1949 | 3 963 | 103 515 | 44 501 | 59 014 | 26.1 | 11.2 | 14.9 | 3.33 |
| 1950 | 4 009 | 98 065 | 40 681 | 57 384 | 24.5 | 10.1 | 14.3 | 3.16 |
| 1951 | 4 047 | 93 063 | 40 386 | 52 677 | 23.0 | 10.0 | 13.0 | 3.01 |
| 1952 | 4 090 | 94 314 | 39 024 | 55 290 | 23.1 | 9.5 | 13.5 | 3.06 |
| 1953 | 4 139 | 90 866 | 39 925 | 50 941 | 22.0 | 9.6 | 12.3 | 2.96 |
| 1954 | 4 187 | 89 845 | 37 988 | 51 857 | 21.5 | 9.1 | 12.4 | 2.93 |
| 1955 | 4 235 | 89 740 | 39 573 | 50 167 | 21.2 | 9.3 | 11.8 | 2.93 |
| 1956 | 4 282 | 88 896 | 38 713 | 50 183 | 20.8 | 9.0 | 11.7 | 2.91 |
| 1957 | 4 324 | 86 985 | 40 741 | 46 244 | 20.1 | 9.4 | 10.7 | 2.86 |
| 1958 | 4 360 | 81 148 | 38 833 | 42 315 | 18.6 | 8.9 | 9.7 | 2.68 |
| 1959 | 4 395 | 83 253 | 38 827 | 44 426 | 18.9 | 8.8 | 10.1 | 2.75 |
| 1960 | 4 430 | 82 129 | 39 797 | 42 332 | 18.5 | 9.0 | 9.6 | 2.71 |
| 1961 | 4 461 | 81 996 | 40 616 | 41 380 | 18.4 | 9.1 | 9.3 | 2.65 |
| 1962 | 4 491 | 81 454 | 42 889 | 38 565 | 18.1 | 9.5 | 8.6 | 2.66 |
| 1963 | 4 523 | 82 251 | 42 010 | 40 241 | 18.2 | 9.3 | 8.9 | 2.66 |
| 1964 | 4 549 | 80 428 | 42 512 | 37 916 | 17.7 | 9.3 | 8.3 | 2.58 |
| 1965 | 4 564 | 77 885 | 44 473 | 33 412 | 17.1 | 9.7 | 7.3 | 2.46 |
| 1966 | 4 581 | 77 697 | 43 548 | 34 149 | 17.0 | 9.5 | 7.5 | 2.41 |
| 1967 | 4 606 | 77 289 | 43 790 | 33 499 | 16.8 | 9.5 | 7.3 | 2.32 |
| 1968 | 4 626 | 73 654 | 45 013 | 28 641 | 15.9 | 9.7 | 6.2 | 2.15 |
| 1969 | 4 624 | 67 450 | 45 966 | 21 484 | 14.6 | 9.9 | 4.6 | 1.94 |
| 1970 | 4 606 | 64 559 | 44 119 | 20 440 | 14.0 | 9.6 | 4.4 | 1.83 |
| 1971 | 4 612 | 61 067 | 45 876 | 15 191 | 13.2 | 9.9 | 3.3 | 1.70 |
| 1972 | 4 640 | 58 864 | 43 958 | 14 906 | 12.7 | 9.5 | 3.2 | 1.59 |
| 1973 | 4 666 | 56 787 | 43 410 | 13 377 | 12.2 | 9.3 | 2.9 | 1.50 |
| 1974 | 4 691 | 62 472 | 44 676 | 17 796 | 13.3 | 9.5 | 3.8 | 1.62 |
| 1975 | 4 711 | 65 719 | 43 828 | 21 891 | 14.0 | 9.3 | 4.6 | 1.69 |
| 1976 | 4 726 | 66 846 | 44 786 | 22 060 | 14.1 | 9.5 | 4.7 | 1.72 |
| 1977 | 4 739 | 65 659 | 44 065 | 21 594 | 13.9 | 9.3 | 4.6 | 1.69 |
| 1978 | 4 753 | 63 983 | 43 692 | 20 291 | 13.5 | 9.2 | 4.3 | 1.65 |
| 1979 | 4 765 | 63 428 | 43 738 | 19 690 | 13.3 | 9.2 | 4.1 | 1.64 |
| 1980 | 4 780 | 63 064 | 44 398 | 18 666 | 13.2 | 9.3 | 3.9 | 1.63 |
| 1981 | 4 800 | 63 469 | 44 404 | 19 065 | 13.2 | 9.3 | 4.0 | 1.65 |
| 1982 | 4 827 | 66 106 | 43 408 | 22 698 | 13.7 | 9.0 | 4.7 | 1.72 |
| 1983 | 4 856 | 66 892 | 45 388 | 21 504 | 13.8 | 9.3 | 4.4 | 1.74 |
| 1984 | 4 882 | 65 076 | 45 098 | 19 978 | 13.3 | 9.2 | 4.1 | 1.70 |
| 1985 | 4 902 | 62 796 | 48 198 | 14 598 | 12.8 | 9.8 | 3.0 | 1.64 |
| 1986 | 4 918 | 60 632 | 47 135 | 13 497 | 12.3 | 9.6 | 2.7 | 1.60 |
| 1987 | 4 932 | 59 827 | 47 949 | 11 878 | 12.1 | 9.7 | 2.4 | 1.59 |
| 1988 | 4 946 | 63 316 | 49 063 | 14 253 | 12.8 | 9.9 | 2.9 | 1.70 |
| 1989 | 4 964 | 63 348 | 49 110 | 14 238 | 12.8 | 9.9 | 2.9 | 1.71 |
| 1990 | 4 986 | 65 549 | 50 028 | 15 521 | 13.1 | 10.0 | 3.1 | 1.79 |
| 1991 | 5 014 | 65 680 | 49 271 | 16 409 | 13.1 | 9.8 | 3.3 | 1.80 |
| 1992 | 5 042 | 66 877 | 49 523 | 17 354 | 13.3 | 9.8 | 3.4 | 1.85 |
| 1993 | 5 066 | 64 826 | 50 988 | 13 838 | 12.8 | 10.1 | 2.7 | 1.81 |
| 1994 | 5 088 | 65 231 | 48 000 | 17 231 | 12.8 | 9.4 | 3.4 | 1.85 |
| 1995 | 5 108 | 63 067 | 49 280 | 13 787 | 12.3 | 9.6 | 2.7 | 1.81 |
| 1996 | 5 125 | 60 723 | 49 167 | 11 556 | 11.8 | 9.6 | 2.3 | 1.76 |
| 1997 | 5 140 | 59 329 | 49 108 | 10 221 | 11.5 | 9.6 | 2.0 | 1.75 |
| 1998 | 5 153 | 57 108 | 49 283 | 7 825 | 11.1 | 9.6 | 1.5 | 1.71 |
| 1999 | 5 165 | 57 574 | 49 345 | 8 229 | 11.1 | 9.6 | 1.6 | 1.73 |
| 2000 | 5 176 | 56 742 | 49 339 | 7 403 | 11.0 | 9.5 | 1.4 | 1.73 |
| 2001 | 5 188 | 56 189 | 48 550 | 7 639 | 10.8 | 9.4 | 1.5 | 1.73 |
| 2002 | 5 201 | 55 555 | 49 418 | 6 137 | 10.7 | 9.5 | 1.2 | 1.72 |
| 2003 | 5 213 | 56 630 | 48 996 | 7 634 | 10.9 | 9.4 | 1.5 | 1.76 |
| 2004 | 5 228 | 57 758 | 47 600 | 10 158 | 11.0 | 9.1 | 1.9 | 1.80 |
| 2005 | 5 246 | 57 745 | 47 928 | 9 817 | 11.0 | 9.1 | 1.9 | 1.80 |
| 2006 | 5 266 | 58 840 | 48 065 | 10 775 | 11.2 | 9.1 | 2.0 | 1.84 |
| 2007 | 5 289 | 58 729 | 49 077 | 9 652 | 11.1 | 9.3 | 1.8 | 1.83 |
| 2008 | 5 313 | 59 530 | 49 094 | 10 436 | 11.2 | 9.2 | 2.0 | 1.85 |
| 2009 | 5 339 | 60 430 | 49 883 | 10 547 | 11.3 | 9.3 | 2.0 | 1.86 |
| 2010 | 5 375 | 60 980 | 50 887 | 10 103 | 11.4 | 9.5 | 1.9 | 1.87 |
| 2011 | 5 403 | 59 961 | 50 585 | 9 376 | 11.1 | 9.4 | 1.7 | 1.83 |
| 2012 | 5 426 | 59 493 | 51 707 | 7 786 | 10.9 | 9.5 | 1.4 | 1.80 |
| 2013 | 5 450 | 58 120 | 51 190 | 6 940 | 10.7 | 9.4 | 1.3 | 1.75 |
| 2014 | 5 472 | 57 232 | 52 186 | 5 046 | 10.5 | 9.5 | 1.0 | 1.71 |
| 2015 | 5 486 | 55 040 | 52 080 | 2 960 | 10.1 | 9.5 | 0.6 | 1.65 |
Current vital statistics [6]
- Number of births from January to October 2015 = ![]() 46,692
46,692
- Number of births from January to October 2016 = ![]() 44,829
44,829
- Number of deaths from January to October 2015 = ![]() 43,410
43,410
- Number of deaths from January to October 2016 = ![]() 44,268
44,268
- Natural increase from January to October 2015 = ![]() 3,282
3,282
- Natural increase from January to October 2016 = ![]() 561
561
Life expectancy at birth
| Year | Males | Females | Both sexes |
|---|---|---|---|
| 1986 | 70.5 | 78.7 | 74.7 |
| 1996 | 73.0 | 80.5 | 76.8 |
| 2006 | 75.8 | 82.8 | 79.4 |
| 2008 | 76.3 | 83.0 | 79.7 |
| 2009 | 76.5 | 83.1 | 79.8 |
| 2010 | 76.7 | 83.2 | 80.1 |
| 2011(e) | 77.2 | 83.5 | 80.8 |
Marriage
Attitudes toward marriage have changed substantially since World War II. Most obvious was the declining marriage rate, which dropped from 8.5 marriages per 1,000 Finns in 1950 to 5.8, in 1984, a decline great enough to mean a drop also in absolute numbers. In 1950 there were 34,000 marriages, while in 1984 only 28,500 were registered, despite a growth in population of 800,000. An explanation for the decline was that there was an unprecedented number of unmarried couples. Since the late 1960s, the practice of cohabitation had become increasingly common, so much so that by the late 1970s most marriages in urban areas grew out of what Finns called "open unions." In the 1980s, it was estimated that about 8 percent of couples who lived together, approximately 200,000 people, did so without benefit of marriage. Partners of such unions usually married because of the arrival of offspring or the acquisition of property. A result of the frequency of cohabitation was that marriages were postponed, and the average age for marriage, which had been falling, began to rise in the 1970s. By 1982 the average marriage age was 24.8 years for women and 26.8 years for men, several years higher for both sexes than had been true a decade earlier.
The overwhelming majority of Finns did marry, however. About 90 percent of the women had been married by the age of forty, and spinsterhood was rare. A shortage of women in rural regions, however, meant that some farmers were forced into bachelorhood.
While the number of marriages was declining, divorce became more common, increasing 250 percent between 1950 and 1980. In 1952 there were 3,500 divorces. The 1960s saw a steady increase in this rate, which averaged about 5,000 divorces a year. A high of 10,191 was reached in 1979; afterwards the divorce rate stabilized at about 9,500 per year during the first half of the 1980s.
A number of factors caused the increased frequency of divorce. One was that an increasingly secularized society viewed marriage, more often than before, as an arrangement that could be ended if it did not satisfy its partners. Another reason was that a gradually expanding welfare system could manage an ever greater portion of the family's traditional tasks, and it made couples less dependent on the institution of marriage. Government provisions for parental leave, child allowances, child care programs, and much improved health and pension plans meant that the family was no longer essential for the care of children and aged relatives. A further cause for weakened family and marital ties was seen in the unsettling effects of the Great Migration and in the economic transformation Finland experienced during the 1960s and the 1970s. The rupture of established social patterns brought uncertainty and an increased potential for conflict into personal relationships.[4]
Ethnic minorities and languages
No official statistics are kept on ethnicities. However, statistics of the Finnish population according to language and citizenship are available.
Finnish and Swedish are defined as languages of the state. Swedish is an official municipal language in municipalities with significant Swedish-speaking populations. The three Sami languages (North Sami, Inari Sami, Skolt Sami) are official in certain municipalities of Lapland.
Finnish people — Finns — speak Finnish, which is the dominant language and is spoken almost everywhere in the country except Åland.
Population of mainland Finland (excluding Åland) according to language, 1990-2015:
| Mother language |
1990 | 1995 | 2000 | 2005 | 2015 | |||||
|---|---|---|---|---|---|---|---|---|---|---|
| Number | % | Number | % | Number | % | Number | % | Number | % | |
| Finnish | 4,675,223 | 93.5% | 4,754,787 | 92.9% | 4,788,497 | 92.4% | 4,819,819 | 91.7% | 4,865,628 | 89% |
| Swedish | 296,738 | 5.9% | 294,664 | 5.8% | 291,657 | 5.6% | 289,675 | 5.5% | 290,161 | 5.3% |
| Russian | 3,884 | 0.1% | 15,872 | 0.3% | 28,205 | 0.5% | 39,653 | 0.8% | 72,436 | 1.3% |
| Estonian | 1,394 | 0% | 8,710 | 0.2% | 10,176 | 0.2% | 15,336 | 0.3% | 48,087 | 0.8% |
| Somali | 0 | 0% | 4,057 | 0.1% | 6,454 | 0.1% | 8,593 | 0.2% | 17,871 | 0.3% |
| English | 3,569 | 0.1% | 5,324 | 0.1% | 6,919 | 0.1% | 8,928 | 0.2% | 17,784 | 0.3% |
| Arabic | 1,138 | 0% | 2,901 | 0.1% | 4,892 | 0.1% | 7,117 | 0.1% | 14,825 | 0.3% |
| Kurdish | 179 | 0% | 1,381 | 0% | 3,115 | 0.1% | 5,123 | 0.1% | 10,731 | 0.2% |
| Chinese | 790 | 0% | 2,190 | 0% | 2,907 | 0.1% | 4,613 | 0.1% | 10,110 | 0.2% |
| Albanian | 0 | 0% | 2,019 | 0% | 3,293 | 0.1% | 5,076 | 0.1% | 8,754 | 0.2% |
| Persian | 291 | 0% | 803 | 0% | 1,205 | 0% | 3,165 | 0.1% | 8,103 | 0.1% |
| Thai | 244 | 0% | 813 | 0% | 1,458 | 0% | 3,033 | 0.1% | 8,038 | 0.1% |
| Vietnamese | 1,643 | 0% | 2,785 | 0.1% | 3,588 | 0.1% | 4,202 | 0.1% | 7,532 | 0.1% |
| Turkish | 848 | 0% | 1,809 | 0% | 2,435 | 0% | 3,595 | 0.1% | 6,766 | 0.1% |
| Spanish | 894 | 0% | 1,394 | 0% | 1,946 | 0% | 2,937 | 0.1% | 6,583 | 0.1% |
| German | 2,427 | 0% | 2,719 | 0.1% | 3,298 | 0.1% | 4,114 | 0.1% | 6,059 | 0.1% |
| Polish | 901 | 0% | 1,129 | 0% | 1,157 | 0% | 1,445 | 0% | 4,459 | 0.1% |
| French | 670 | 0% | 1,062 | 0% | 1,585 | 0% | 2,071 | 0% | 3,736 | 0.1% |
| Romanian Moldovan |
94 | 0% | 368 | 0% | 617 | 0% | 909 | 0% | 2,878 | 0.1% |
| Hungarian | 573 | 0% | 732 | 0% | 1,089 | 0% | 1,206 | 0% | 2,671 | 0% |
| Tagalog | 118 | 0% | 375 | 0% | 568 | 0% | 764 | 0% | 2,618 | 0% |
| Bengali | 93 | 0% | 373 | 0% | 524 | 0% | 920 | 0% | 2,603 | 0% |
| Ukrainian | 11 | 0% | 113 | 0% | 337 | 0% | 611 | 0% | 2,436 | 0% |
| Italian | 403 | 0% | 574 | 0% | 833 | 0% | 1,177 | 0% | 2,291 | 0% |
| Portuguese | 171 | 0% | 297 | 0% | 433 | 0% | 865 | 0% | 2,250 | 0% |
| Urdu | 79 | 0% | 179 | 0% | 309 | 0% | 594 | 0% | 2,186 | 0% |
| Bulgarian | 230 | 0% | 400 | 0% | 486 | 0% | 629 | 0% | 2,114 | 0% |
| Bosnian | 0 | 0% | 0 | 0% | 0 | 0% | 1,186 | 0% | 2,071 | 0% |
| Sami | 1,734 | 0% | 1.726 | 0% | 1,734 | 0% | 1,752 | 0% | 1,949 | 0% |
| Hindi | 147 | 0% | 239 | 0% | 428 | 0% | 779 | 0% | 1,740 | 0% |
| Dutch | 277 | 0% | 408 | 0% | 650 | 0% | 960 | 0% | 1,446 | 0% |
| Latvian | 20 | 0% | 76 | 0% | 169 | 0% | 391 | 0% | 1,318 | 0% |
| Japanese | 274 | 0% | 386 | 0% | 561 | 0% | 798 | 0% | 1,224 | 0% |
| Lithuanian | 30 | 0% | 94 | 0% | 166 | 0% | 375 | 0% | 1,095 | 0% |
| Norwegian | 402 | 0% | 436 | 0% | 471 | 0% | 540 | 0% | 648 | 0% |
| Danish | 290 | 0% | 305 | 0% | 397 | 0% | 456 | 0% | 526 | 0% |
| Hebrew | 165 | 0% | 232 | 0% | 263 | 0% | 348 | 0% | 441 | 0% |
| Other | 2,534 | 0.1% | 5,084 | 0.1% | 8,293 | 0.2% | 11,825 | 0.2% | 32,431 | 0.6% |
The government only considers the "working language", Finnish or Swedish, of the person, and "bilinguality" has no official standing.
Swedes
Significant populations of Swedish-speakers are found in coastal areas, from Ostrobothnia to the southern coast, and in the archipelago of Åland. Coastal cities, however, are majority Finnish-speaking, with a few small towns as exceptions. There are very few Swedish-speakers in the inland.
Sami
The Sami are related to the Finns, both speak non-Indo-European languages belonging to the Uralic family of languages. Once present throughout the country, the Sami gradually moved northward under the pressure of the advancing Finns. As they were a nomadic people in a sparsely settled land, the Sami were always able to find new and open territory in which to follow their traditional activities of hunting, fishing, and slash-and-burn agriculture. By the 16th century, most Sami lived in the northern half of the country, and it was during this period that they converted to Christianity. By the 19th century, most of them lived in the parts of Lapland that were still their home in the 1980s. The last major shift in Sami settlement was the migration westward of 600 Skolt Sami from the Petsamo region after it was ceded to the Soviet Union in 1944. A reminder of their eastern origin was their Orthodox faith; the remaining 85 percent of Finland's Sami were Lutheran.
About 90 percent of Finland's 4,400 Sami lived in the municipalities of Enontekiö, Inari, and Utsjoki, and in the reindeer herding-area of Sodankylä. According to Finnish regulations, anyone who spoke one of the Sami languages, or who had a relative who was a Sami, was registered as a Sami in census records. Finnish Sami spoke three distinct Sami languages, but by the late 1980s perhaps only a minority actually had Sami as their first language. Sami children had the right to instruction in Sami, but there were few qualified instructors or textbooks available. One reason for the scarcity of written material in Sami is that the three languages spoken in Finland made agreement about a common orthography difficult. Perhaps these shortcomings explained why a 1979 study found the educational level of Sami to be considerably lower than that of other Finns.
Few Finnish Sami actually led the traditional nomadic life pictured in school geography texts and in travel brochures. Although many Sami living in rural regions of Lapland earned some of their livelihood from reindeer herding, it was estimated that Sami owned no more than one-third of Finland's 200,000 reindeer. Only 5 percent of Finnish Sami had the herds of 250 to 300 reindeer needed to live entirely from this kind of work. Most Sami worked at more routine activities, including farming, construction, and service industries such as tourism. Often a variety of jobs and sources of income supported Sami families, which were, on the average, twice the size of a typical Finnish family. Sami also were aided by old-age pensions and by government welfare, which provided a greater share of their income than it did for Finns as a whole.
There have been many efforts over the years by Finnish authorities to safeguard the Sami' culture and way of life and to ease their entry into modern society. Officials created bodies that dealt with the Sami minority, or formed committees that studied their situation. An early body was the Society for the Promotion of Lapp Culture, formed in 1932. In 1960 the government created the Advisory Commission on Lapp Affairs. The Sami themselves formed the Saami-liitto in 1945 and the Johti Sabmelazzat, a more aggressive organization, in 1968. In 1973 the government arranged for elections every four years to a twenty-member Sami Parliaments that was to advise authorities. On the international level, there was the Nordic Sami Council of 1956, and there has been a regularly occurring regional conference since then that represented—in addition to Finland's Sami—Norway's 20,000 Sami, Sweden's 10,000 Sami, and the 1,000 to 2,000 Sami who remained in the Kola Peninsula in Russia.[4]
Romani
Romani people, also called Kale and Roma, have been present in Finland since the second half of the 16th century. With their unusual dress, unique customs, and specialized trades for earning their livelihood, Roma have stood out, and their stay in the country has not been an easy one. They have suffered periodic harassment from the hands of both private citizens and public officials, and the last of the special laws directed against them was repealed only in 1883. Even in the second half of the 1980s, Finland's 5,000 to 6,000 Romani remained a distinct group, separated from the general population both by their own choice and by the fears and the prejudices many Finns felt toward them.
Finnish Roma, like Roma elsewhere, chose to live apart from the dominant societal groups. A Roma's loyalty was to his or her family and to Gypsies in general. Marriages with non-Roma were uncommon, and the Roma's own language, spoken as a first language only by a few in the 1980s, was used to keep outsiders away. An individual's place within Roma society was largely determined by age and by sex, old males having authority. A highly developed system of values and a code of conduct governed a Roma's behavior, and when Roma sanctions, violent or not, were imposed, for example via "blood feuds," they had far more meaning than any legal or social sanctions of Finnish society.
Unlike the Lapps, who lived concentrated in a single region, the Romani lived throughout Finland. While most Lapps wore ordinary clothing in their everyday life, Romani could be identified by their dress; the men generally wore high boots and the women almost always dressed in very full, long velvet skirts. Like most Lapps, however, Roma also had largely abandoned a nomadic way of life and had permanent residences. Romani men had for centuries worked as horse traders, but they had adapted themselves to postwar Finland by being active as horse breeders and as dealers in cars and scrap metal. Women continued their traditional trades of fortune telling and handicrafts.
Since the 1960s, Finnish authorities have undertaken measures to improve the Romani's standard of life. Generous state financial arrangements have improved their housing. Their low educational level (an estimated 20 percent of adult Romani could not read) was raised, in part, through more vocational training. A permanent Advisory Commission on Gypsy Affairs was set up in 1968, and in 1970 racial discrimination was outlawed through an addition to the penal code. The law punished blatant acts such as barring Romani from restaurants or shops or subjecting them to unusual surveillance by shopkeepers or the police.[4]
Jews
There are about 1,300 Jews in Finland, 800 of whom live in Helsinki and most of the remainder live in Turku. During the period of Swedish rule, Jews had been forbidden to live in Finland. Once the country became part of the Russian Empire, however, Jewish veterans of the Tsarist army had the right to settle anywhere they wished within the empire. Although constrained by law to follow certain occupations, mainly those connected with the sale of clothes, the Jewish community in Finland was able to prosper, and by 1890 it numbered around 1,000. Finnish independence brought complete civil rights, and during the interwar period there were some 2,000 Jews in Finland, most of them living in urban areas in the south. During World War II, Finnish authorities refused to deliver Jews to the Nazis, and the country's Jewish community survived the war virtually intact. By the 1980s, assimilation and emigration had significantly reduced the size of the community, and it was only with some difficulty that it maintained synagogues, schools, libraries, and other pertinent institutions.[4]
Russians
Russians in Finland had come from two major waves. About 5,000 originate from a population that immigrated in the 19th and early 20th centuries, when Finland was a grand duchy of Imperial Russia. Another consisted of those who immigrated after the dissolution of the Soviet Union. A significant catalyst was the right of return, based on President Koivisto's initiative that people of Ingrian ancestry would be allowed to immigrate to Finland.
Tatars
The Tatar community in Finland is historically smaller than the Jewish community; it numbered only about 700, most of whom were found in Helsinki, Tampere, Järvenpää, Turku. The Tatars first came to Finland from Russian Volga region near Nizni Novgorod's Tatar villages in the mid-19th century and have remained there ever since, active in commerce. The Tatars in Finland fully integrated into the Finnish society at the same time they preserved their religion, mother tongue and ethnic culture.
Migration
External migration
Demographic movement in Finland did not end with the appearance of immigrants from Sweden in the Middle Ages. Finns who left to work in Swedish mines in the 16th century began a national tradition, which continued up through the 1970s, of settling in their neighboring country. During the period of tsarist rule, some 100,000 Finns went to Russia, mainly to the St. Petersburg area. Emigration on a large scale began in the second half of the 19th century when Finns, along with millions of other Europeans, set out for the United States and Canada. By 1980 Finland had lost an estimated 400,000 of its citizens to these two countries.
A great number of Finns emigrated to Sweden after World War II, drawn by that country's prosperity and proximity. Emigration began slowly, but, during the 1960s and the second half of the 1970s, tens of thousands left each year for their western neighbor. The peak emigration year was 1970, when 41,000 Finns settled in Sweden, which caused Finland's population actually to fall that year. Because many of the migrants later returned to Finland, definite figures cannot be calculated, but all told, an estimated 250,000 to 300,000 Finns became permanent residents of Sweden in the postwar period. The overall youthfulness of these emigrants meant that the quality of the work force available to Finnish employers was diminished and that the national birth rate slowed. At one point, every eighth Finnish child was born in Sweden. Finland's Swedish-speaking minority was hard hit by this westward migration; its numbers dropped from 350,000 to about 300,000 between 1950 and 1980. By the 1980s, a strong Finnish economy had brought an end to large-scale migration to Sweden. In fact, the overall population flow was reversed because each year several thousand more Finns returned from Sweden than left for it.[4]
Internal migration
However significant the long-term effects of external migration on Finnish society may have been, migration within the country had a greater impact—especially the migration which took place between the end of World War II and the mid-1970s, when half the population moved from one part of the country to another. Before World War II, internal migration had first been a centuries-long process of forming settlements ever farther to the north. Later, however, beginning in the second half of the 19th century with the coming of Finland's tardy industrialization, there was a slow movement from rural regions toward areas in the south where employment could be found.
Postwar internal migration began with the resettlement within Finland of virtually all the inhabitants of the parts of Karelia ceded to the Soviet Union. Somewhat more than 400,000 persons, more than 10 percent of the nation's population, found new homes elsewhere in Finland, often in the less settled regions of the east and the north. In these regions, new land, which they cleared for farming, was provided for the refugees; in more populated areas, property was requisitioned. The sudden influx of these settlers was successfully dealt with in just a few years. One of the effects of rural resettlement was an increase in the number of farms during the postwar years, a unique occurrence for industrialized nations of this period.
It was, however, the postwar economic transformation that caused an even larger movement of people within Finland, a movement known to Finns as the Great Migration. It was a massive population shift from rural areas, especially those of eastern and northeastern Finland, to the urban, industrialized south). People left rural regions because the mechanization of agriculture and the forestry industry had eliminated jobs. The displaced work force went to areas where employment in the expanding industrial and service sectors was available. This movement began in the 1950s, but it was most intense during the 1960s and the first half of the 1970s, assuming proportions that in relative terms were unprecedented for a country outside the Third World. The Great Migration left behind rural areas of abandoned farms with reduced and aging populations, and it allowed the creation of a densely populated postindustrial society in the country's south.
The extent of the demographic shift to the south can be shown by the following figures. Between 1951 and 1975, the population registered an increase of 655,000. During this period, the small province of Uusimaa increased its population by 412,000, growing from 670,000 to 1,092,000; three-quarters of this growth was caused by settlers from other provinces. The population increase experienced by four other southern provinces, the Aland Islands, Turku ja Pori, Hame, and Kymi, taken together with that of Uusimaa amounted to 97 percent of the country's total population increase for these years. The population increase of the central and the northern provinces accounted for the remaining 3 percent. Provinces that experienced an actual population loss during these years were in the east and the northeast-Pohjois-Karjala, Mikkeli, and Kuopio.
One way of visualizing the shift to the south would be to draw a line, bowing slightly to the north, between the port cities of Kotka on the Gulf of Finland and Kaskinen on the Gulf of Bothnia. In 1975 the territory to the south of this line would have contained half of Finland's population. Ten years earlier, such a line, drawn farther to the north to mark off perhaps 20 percent more area, would have encompassed half the population. One hundred years earlier, half the population would have been distributed throughout more than twice as much territory. Another indication of the extent to which Finns were located in the south was that by 1980, approximately 90 percent of them lived in the southernmost 41 percent of Finland.[4]
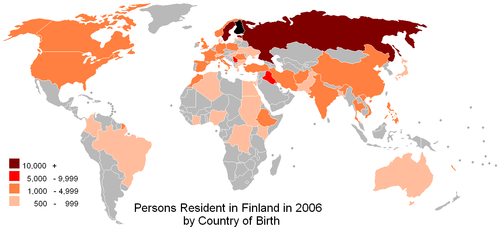
Immigration
Demographics
In 2013, there were 299,963 foreign-born residents in Finland, corresponding to 5.5% of the total population. Of these, 182,920 (3.6%) were born outside the EU and 98,380 (1.9%) were born in another EU Member State.[7] In mainland Finland (excluding Åland), the largest groups were:
-
 Former Soviet Union (53,710)
 -
 Estonia (39,327)
 -
 Sweden (29,484)
 -
 Russia (10,992)
 -
 Somalia (9,618)
 -
 Iraq (9,264)
 -
 China (8,879)
 -
 Thailand (8,563)
 -
 Former Yugoslavia (6,728)
 -
 Germany (6,253)
Religion
At the end of 2013:[8]
- Evangelical Lutheran 75.3% (Evangelical Lutheran Church of Finland, state church)
- Christian Orthodox 1.1% (Finnish Orthodox Church, second state church)
- Other 1.4%
- None 22.1%
Literacy
- Definition: age 15 and over can read and write
- Total population: 100% (2000 est.)
In 2010 Yle reported that 85-90% of somali immigrants are illiterate when they arrive.[9]
See also
References
- ↑ http://www.stat.fi/til/vaerak/2012/01/vaerak_2012_01_2013-09-27_tie_001_en.html
- 1 2 "Statistics Finland: Finland in Figures". Retrieved 2007-06-21.
- ↑ Matka väestölliseen keskipisteeseen, Helsingin Sanomat, 30 July 2012, p. A5.
- 1 2 3 4 5 6 7 Text from PD source: US Library of Congress: A Country Study: Finland, Library of Congress Call Number DL1012 .A74 1990.
- ↑ Statistics Finland
- ↑ "Finland's population in September for the first time closer to six than five million". Statistics of Finland. Statistics Finland. Retrieved 21 November 2016.
- ↑ Syntymävaltio iän ja sukupuolen mukaan maakunnittain 1990 - 2013, Tilastokeskus
- ↑ "Population: Population structure". Statistics Finland. 24 March 2014. Retrieved 13 March 2015.
- ↑ "Nästan alla somaliska flyktingar är analfabeter". Yle. 31 March 2010. Retrieved 21 August 2016.
External links
- Findicator - Life expectancy
- Findicator - Total fertility rate in 1776-
- Findicator - Vital statistics 1749-
- Findicator - Age structure of population
Finland articles | |||||||||||
|---|---|---|---|---|---|---|---|---|---|---|---|
| History |  | ||||||||||
| Geography | |||||||||||
| Politics | |||||||||||
| Economy | |||||||||||
| Society |
| ||||||||||
| |||||||||||
Ethnic issues | |
|---|---|