Demographics of France

The demography of France is monitored by the Institut national d'études démographiques (INED) and the Institut National de la Statistique et des Études Économiques (INSEE). On the 1 October 2016, 66,821,000 people lived in the French Republic, including all the overseas departments. 64,695,000 of these lived in Metropolitan France, the part of France located in Europe.
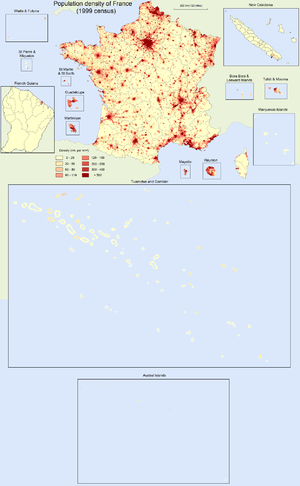
France was historically Europe's most populous nation. During the Middle Ages, more than one quarter of Europe's total population was French; by the 17th century, this had decreased slightly to one fifth. By the beginning of the 20th century, other European nations, such as Germany and Russia, had caught up with and overtaken it. However, the country's population sharply increased with the baby boom following World War II.
According to INSEE, since 2004, 200,000 immigrants entered annually into the country. One out of two was born in Europe and one in three in Africa. Between 2009 and 2012, the number of Europeans entering France increased sharply (+ 12% per year on average).[3]
The national birth rate, after dropping for a time, began to rebound in the 1990s and currently the country's fertility rate is close to the replacement level. According to an INSEE 2006 study, "The natural increase is close to 300,000 people, a level that has not been reached in more than thirty years."[4]
Among the 802,000 newborns in metropolitan France in 2010, 80.1% had two French parents, 13.3% had one French parent, and 6.6% had two non French parents.[5][6] For the same year, 27.3% of newborns in metropolitan France had at least one foreign-born parent and 23.9% had at least one parent born outside of Europe (parents born in overseas territories are considered as born in France).[5][7] Between 2006 and 2008, about 40% of newborns in France had one foreign-born grandparent (11% born in another European country, 16% born in Maghreb and 12% born in another region of the world).[8]
Racial and ethnic censuses have been banned by the French government since 1978, since the term "race" in France invokes associations with Nazi Germany.[9]
Historical overview
1800 to 20th century
France was historically the largest nation of Europe. During the Middle Ages more than one quarter of Europe's population was French; during the 17th century it was still one fifth. Starting around 1800, the historical evolution of the population in France has been extremely atypical in the Western World. Unlike the rest of Europe, there was no strong population growth in France in the 19th century and first half of the 20th century. The birth rate in France diminished much earlier than in the rest of Europe. Thus population growth was quite slow in the 19th century, and the nadir was reached in the first half of the 20th century when France, surrounded by the rapidly growing populations of Germany and the United Kingdom, had virtually zero growth. The slow growth of France's population in the 19th century was reflected in the country's very low emigration rate. While millions of people from all other parts of Europe migrated to the Americas, few French did so. Most people of French extraction in the United States are descended from immigrants from Quebec, whose population was rapidly growing at this time.
The French population only grew by 8.6% between 1871 and 1911, while Germany's grew by 60% and Britain's by 54%.[10] Ferdinand Foch joked that the only way for France to permanently improve its relationship with Germany was to castrate 20 million Germans.[11] If the population of France had grown between 1815 and 2000 at the same rate as that of Germany during the same time period, France's population would have been 110 million in 2000; Germany grew at a much faster rate despite its very substantial emigration to the Americas, and its larger military and civilian losses during the World Wars than France. If France's population had grown at the same rate as that of England and Wales (which was also siphoned off by emigration to the Americas, Australia and New Zealand), France's population could have been as much as 150 million in 2000. Should one start the comparison at the time of King Louis XIV, then France would now have approximately the same population as the United States. While France was Europe's leading military power at the time of Louis XIV and then Napoleon, the country lost this advantage due to its relative demographic decline after 1800.
French concerns about the country's slow population growth began after its defeat in the Franco-Prussian War. For four years in the 1890s, the number of deaths exceeded the number of births. The National Alliance for the Growth of the French Population (ANAPF) was formed in 1896, and the Cognacq-Jay and other prizes were created for the parents of large families. Émile Zola's 1899 novel Fécondité is representative of contemporary concerns about the birthrate. The 1.3 million French deaths in World War I, along with even more births forgone by potential fathers being off at war, caused a drop of 3 million in the French population, and helped make Dénatalité a national obsession; by 1920 ANAPF had 40,000 members. The society proposed that parents of large families receive extra votes, and the belief that women's suffrage in other countries caused birth rates to decline helped defeat proposals before World War II to permit women to vote. Concern further increased during the "hollow years" of the 1930s, when the number of new conscripts declined because of the lack of births during World War I. Even the French Communist Party ended its opposition to anti-birth control and anti-abortion laws in 1936, and its leader Maurice Thorez advocated for the "protection of family and childhood". Already existing financial incentives for large families increased in 1939, enough double the income of a family with six children.[10] Also, France encouraged immigration, chiefly from other European countries such as Italy, Poland, and Spain. (In fact, with its low birth rate, stagnating or declining native-born population, and role as a destination for migrants from other parts of Europe, France's situation before World War II was not unlike that of Germany today.)
After World War II
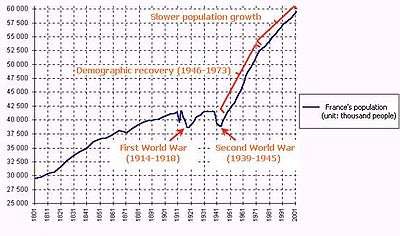
France experienced a baby boom after 1945; it reversed a long-term record of low birth rates.[12] The sense that the population was too small, especially in regard to more powerful Germany, was a common theme in the early twentieth century . Put in a list policies were proposed in the 1930s, and implemented in the 1940s.[13][14]
After 1945, France suddenly underwent a demographic recovery. In the 1930s the French government, alarmed by the decline of France's population, had passed laws to boost the birth rate, giving state benefits to families with children. Nonetheless, nobody can explain this sudden recovery, which was often portrayed inside France as a "miracle". It was also atypical of the Western world: although there was a baby boom in other Western countries after the war, the baby boom in France was much stronger, and lasted longer than in most other Western countries (the United States was one of the few exceptions). In the 1950s and 1960s France's population grew at 1% per year: the highest growth in the history of France, higher even than the best periods of the 18th or 19th centuries.
Since 1975, France's population growth rate has significantly diminished, but it still remains slightly faster than that of the rest of Europe, and much faster than at the end of the 19th century and during the first half of the 20th century. In the first decade of the third millennium, population growth in France is the fastest of Europe, matched only by Ireland, which has also historically undergone stagnant growth and even decline relative to the rest of Europe until recently. However, it is slower than in the United States, largely because of the higher net migration rate to the USA.
Historical summary
The following compares the past, present, and future size of the French population with other entities in Europe and in the world. All statements refer to France as understood in its modern borders; this pertains also to other countries. Historians suggest that France has been the most populous state in Europe since at least the period of Charlemagne and the Frankish Empire, or even earlier. A definitive date is impossible to determine and we can only rely on historical estimates.
- until 1795 metropolitan France was the most populous country of Europe, above Russia, and the third most populous country in the world, behind only China and India;
- between 1795 and 1866, metropolitan France was the second most populous country of Europe, behind Russia, and the fourth most populous country in the world, behind China, India, and Russia;
- between 1866 and 1909, metropolitan France was the third most populous country of Europe, behind Russia and Germany;
- between 1909 and 1933, metropolitan France was the fourth most populous country of Europe, behind Russia, Germany, and the United Kingdom;
- between 1933 and 1991, metropolitan France was the fifth most populous country of Europe, behind Russia, Germany, the United Kingdom, and Italy;
- between 1991 and 2000, metropolitan France recovered its rank as the fourth most populous country of Europe, behind Russia, Germany, and the United Kingdom;
- since 2000, metropolitan France has recovered its rank as the third most populous country of Europe, behind Russia and Germany. Worldwide, France's ranking has fallen to twentieth most populous country;
- In 2005 it was projected that if current demographic trends continued (i.e. declining population in Germany, and slightly rising population in France and the UK), around 2050 metropolitan France could again surpass the population of Germany, becoming the most populous state of the countries now in the European Union.[15] But more recent (2009) UN projections say that the stronger-growing United Kingdom could be more populous than metropolitan France in 2050, leaving metropolitan France third amongst European nations, behind Russia and the UK,[16]
In the above list, Turkey is not considered a European country. Turkey was less populous than metropolitan France until 1992, and has been more populous since then.[17]
Historical population figures
Please note:
- figures are for metropolitan France only, not including overseas departments and territories, as former French colonies and protectorates. Algeria and its départements, although they were an integral part of metropolitan France until 1962, are not included in the figures.
- to make comparisons easier, figures provided below are for the territory of metropolitan France within the borders of 2004. This was the real territory of France from 1860 to 1871, and again since 1919. Figures before 1860 have been adjusted to include Savoie and Nice, which only became part of France in 1860. Figures between 1795 and 1815 do not include the French départements in modern-day Belgium, Germany, the Netherlands, and Italy, although they were an integral part of France during that period. Figures between 1871 and 1919 have been adjusted to include Alsace and part of Lorraine, which both were at the time part of the German Empire.
- figures before 1801 are modern estimates; figures from 1801 (included) onwards are based on the official French censuses.
Source:[18]
| Year | Population | Year | Population | Year | Population |
|---|---|---|---|---|---|
| 50 BC | 2,500,000 | 1806 | 29,648,000 | 1896 | 40,158,000 |
| 1 | 5,500,000 | 1811 | 30,271,000 | 1901 | 40,681,000 |
| 120 | 7,200,000 | 1816 | 30,573,000 | 1906 | 41,067,000 |
| 400 | 5,500,000 | 1821 | 31,578,000 | 1911 | 41,415,000 |
| 850 | 7,000,000 | 1826 | 32,665,000 | 1921 | 39,108,000 |
| 1226 | 16,000,000 | 1831 | 33,595,000 | 1926 | 40,581,000 |
| 1345 | 20,200,000 | 1836 | 34,293,000 | 1931 | 41,524,000 |
| 1400 | 16,600,000 | 1841 | 34,912,000 | 1936 | 41,502,000 |
| 1457 | 19,700,000 | 1846 | 36,097,000 | 1946 | 40,506,639 |
| 1580 | 20,000,000 | 1851 | 36,472,000 | 1954 | 42,777,162 |
| 1594 | 18,500,000 | 1856 | 36,715,000 | 1962 | 46,519,997 |
| 1600 | 20,000,000 | 1861 | 37,386,000 | 1968 | 49,780,543 |
| 1670 | 18,000,000 | 1866 | 38,067,000 | 1975 | 52,655,864 |
| 1700 | 21,000,000 | 1872 | 37,653,000 | 1982 | 54,334,871 |
| 1715 | 19,200,000 | 1876 | 38,438,000 | 1990 | 56,615,155 |
| 1740 | 24,600,000 | 1881 | 39,239,000 | 1999 | 58,520,688 |
| 1792 | 28,000,000 | 1886 | 39,783,000 | 2006 | 61,399,733 |
| 1801 | 29,361,000 | 1891 | 39,946,000 | 2016 | 64,513,000 |
Population projections
The population of France is predicted to hit the 70 million mark between the year 2025/2030 and to overtake Germany's between 2050/2060, with 75,6 million French for 71 million Germans in 2060. Although the UK is predicted to overtake France by 2030. By 2080, the population of France is estimated to reach 78,8 million (with overseas department, but without the overseas territories).
Figures from eurostat for metropolitan France and the overseas departments:
| Year | Population |
|---|---|
| 2010 | 64,677,000 |
| 2020 | 67,658,000 |
| 2030 | 70,396,000 |
| 2040 | 72,767,000 |
| 2050 | 74,297,000 |
| 2060 | 75,599,000 |
| 2070 | 77,109,000 |
| 2080 | 78,842,000 |
Source:[19]
Vital statistics
The vital statistics below refer to France Métropolitaine and do not include the overseas departments.
| Average population (x 1000) (1 January) | Live births | Deaths | Natural change | Crude birth rate (per 1000) | Crude death rate (per 1000) | Natural change (per 1000) | Total fertility rate | Infant mortality rate (per 1,000 live births) | Life expectancy at birth (males) | Life expectancy at birth (females) | |
|---|---|---|---|---|---|---|---|---|---|---|---|
| 1901 | 40 710 | 917 075 | 825 315 | 91 760 | 22.5 | 20.3 | 2.3 | 2.9028 | |||
| 1902 | 40 810 | 904 434 | 801 379 | 103 055 | 22.2 | 19.6 | 2.5 | 2.8530 | |||
| 1903 | 40 910 | 884 498 | 794 566 | 89 932 | 21.6 | 19.4 | 2.2 | 2.7840 | |||
| 1904 | 41 000 | 877 091 | 802 536 | 74 555 | 21.4 | 19.6 | 1.8 | 2.7483 | |||
| 1905 | 41 050 | 865 604 | 812 338 | 53 266 | 21.1 | 19.8 | 1.3 | 2.7059 | |||
| 1906 | 41 100 | 864 745 | 820 051 | 44 694 | 21.0 | 20.0 | 1.1 | 2.7000 | |||
| 1907 | 41 100 | 829 632 | 830 871 | -1 239 | 20.2 | 20.2 | 0.0 | 2.5755 | |||
| 1908 | 41 190 | 848 982 | 784 415 | 64 567 | 20.6 | 19.0 | 1.6 | 2.6363 | |||
| 1909 | 41 240 | 824 739 | 792 798 | 31 941 | 20.0 | 19.2 | 0.8 | 2.5573 | |||
| 1910 | 41 350 | 828 140 | 737 877 | 90 263 | 20.0 | 17.8 | 2.2 | 2.5705 | |||
| 1911 | 41 420 | 793 506 | 813 653 | -20 147 | 19.2 | 19.6 | -0.5 | 2.4620 | |||
| 1912 | 41 530 | 801 642 | 726 848 | 74 794 | 19.3 | 17.5 | 1.8 | 2.4853 | |||
| 1913 | 41 620 | 795 851 | 736 937 | 58 914 | 19.1 | 17.7 | 1.4 | 2.4680 | |||
| 1914 | 41 630 | 757 931 | 774 931 | -17 000 | 18.2 | 18.6 | -0.4 | 2.3354 | |||
| 1915 | 40 620 | 482 968 | 747 968 | -265 000 | 11.9 | 18.4 | -6.5 | 1.5194 | |||
| 1916 | 40 020 | 384 676 | 697 676 | -313 000 | 9.6 | 17.4 | -7.8 | 1.2304 | |||
| 1917 | 39 420 | 412 744 | 712 744 | -300 000 | 10.5 | 18.1 | -7.6 | 1.3419 | |||
| 1918 | 38 670 | 472 816 | 867 816 | -395 000 | 12.2 | 22.4 | -10.2 | 1.5593 | |||
| 1919 | 38 600 | 506 960 | 739 901 | -232 941 | 13.1 | 19.2 | -6.0 | 1.5907 | |||
| 1920 | 38 900 | 838 137 | 675 676 | 162 461 | 21.5 | 17.4 | 4.2 | 2.6946 | |||
| 1921 | 39 140 | 816 555 | 697 904 | 118 651 | 20.9 | 17.8 | 3.0 | 2.6014 | |||
| 1922 | 39 310 | 764 373 | 692 322 | 72 051 | 19.4 | 17.6 | 1.8 | 2.4230 | |||
| 1923 | 39 750 | 765 888 | 670 326 | 95 562 | 19.3 | 16.9 | 2.4 | 2.4067 | |||
| 1924 | 40 170 | 757 873 | 683 296 | 74 577 | 18.9 | 17.0 | 1.9 | 2.3561 | |||
| 1925 | 40 460 | 774 455 | 712 211 | 62 244 | 19.1 | 17.6 | 1.5 | 2.3884 | |||
| 1926 | 40 710 | 771 690 | 716 966 | 54 724 | 19.0 | 17.6 | 1.3 | 2.3680 | |||
| 1927 | 40 770 | 748 102 | 679 809 | 68 293 | 18.3 | 16.7 | 1.7 | 2.2895 | |||
| 1928 | 40 880 | 753 570 | 678 269 | 75 301 | 18.4 | 16.6 | 1.8 | 2.3052 | |||
| 1929 | 41 020 | 734 140 | 742 732 | -8 592 | 17.9 | 18.1 | -0.2 | 2.2412 | |||
| 1930 | 41 340 | 754 020 | 652 953 | 101 067 | 18.2 | 15.8 | 2.4 | 2.2953 | |||
| 1931 | 41 550 | 737 611 | 682 816 | 54 795 | 17.8 | 16.4 | 1.3 | 2.2470 | |||
| 1932 | 41 510 | 726 299 | 663 705 | 62 594 | 17.5 | 16.0 | 1.5 | 2.2258 | |||
| 1933 | 41 520 | 682 394 | 664 133 | 18 261 | 16.4 | 16.0 | 0.4 | 2.1110 | |||
| 1934 | 41 570 | 681 518 | 637 713 | 43 805 | 16.4 | 15.3 | 1.1 | 2.1406 | |||
| 1935 | 41 550 | 643 870 | 661 722 | -17 852 | 15.5 | 15.9 | -0.4 | 2.0696 | |||
| 1936 | 41 500 | 634 344 | 645 844 | -11 500 | 15.3 | 15.6 | -0.3 | 2.0919 | |||
| 1937 | 41 530 | 621 453 | 632 896 | -11 443 | 15.0 | 15.2 | -0.3 | 2.0989 | |||
| 1938 | 41 560 | 615 582 | 650 832 | -35 250 | 14.8 | 15.7 | -0.8 | 2.1276 | |||
| 1939 | 41 510 | 615 599 | 645 677 | -30 078 | 14.8 | 15.6 | -0.7 | 2.1662 | |||
| 1940 | 40 690 | 561 281 | 740 281 | -179 000 | 13.8 | 18.2 | -4.4 | 2.0025 | |||
| 1941 | 39 420 | 522 261 | 675 261 | -153 000 | 13.2 | 17.1 | -3.9 | 1.8535 | |||
| 1942 | 39 220 | 575 261 | 656 261 | -81 000 | 14.7 | 16.7 | -2.1 | 2.0425 | |||
| 1943 | 38 860 | 615 780 | 626 780 | -11 000 | 15.8 | 16.1 | -0.3 | 2.1864 | |||
| 1944 | 38 770 | 629 878 | 666 878 | -37 000 | 16.2 | 17.2 | -1.0 | 2.2494 | |||
| 1945 | 39 660 | 645 899 | 643 899 | 2 000 | 16.3 | 16.2 | 0.1 | 2.3102 | |||
| 1946 | 40 287 | 843 904 | 545 880 | 298 024 | 20.9 | 13.5 | 7.4 | 2.9979 | 77.8 | 59.9 | 65.2 |
| 1947 | 40 679 | 870 472 | 538 157 | 332 315 | 21.4 | 13.2 | 8.2 | 3.0366 | 71.1 | 61.2 | 66.7 |
| 1948 | 41 112 | 870 836 | 513 210 | 357 626 | 21.2 | 12.5 | 8.7 | 3.0195 | 55.9 | 62.7 | 68.8 |
| 1949 | 41 480 | 872 661 | 573 598 | 299 063 | 21.0 | 13.8 | 7.2 | 3.0044 | 60.3 | 62.2 | 67.6 |
| 1950 | 41 829 | 862 310 | 534 480 | 327 830 | 20.6 | 12.8 | 7.8 | 2.9466 | 52.0 | 63.4 | 69.2 |
| 1951 | 42 156 | 826 722 | 565 829 | 260 893 | 19.6 | 13.4 | 6.2 | 2.8056 | 50.8 | 63.1 | 68.9 |
| 1952 | 42 460 | 822 204 | 524 831 | 297 373 | 19.4 | 12.4 | 7.0 | 2.7772 | 45.2 | 64.4 | 70.2 |
| 1953 | 42 752 | 804 696 | 556 983 | 247 713 | 18.8 | 13.0 | 5.8 | 2.7038 | 41.9 | 64.3 | 70.3 |
| 1954 | 43 057 | 810 754 | 518 892 | 291 862 | 18.8 | 12.1 | 6.8 | 2.7142 | 40.7 | 65.0 | 71.2 |
| 1955 | 43 428 | 805 917 | 526 322 | 279 595 | 18.6 | 12.1 | 6.4 | 2.6835 | 38.6 | 65.2 | 71.5 |
| 1956 | 43 843 | 806 916 | 545 700 | 261 216 | 18.4 | 12.4 | 6.0 | 2.6735 | 36.2 | 65.2 | 71.7 |
| 1957 | 44 311 | 816 467 | 532 107 | 284 360 | 18.4 | 12.0 | 6.4 | 2.6947 | 33.8 | 65.5 | 72.2 |
| 1958 | 44 789 | 812 215 | 500 596 | 311 619 | 18.1 | 11.2 | 7.0 | 2.6835 | 31.4 | 66.8 | 73.4 |
| 1959 | 45 240 | 829 249 | 509 114 | 320 135 | 18.3 | 11.3 | 7.1 | 2.7521 | 29.6 | 66.8 | 73.2 |
| 1960 | 45 684 | 819 819 | 520 960 | 298 859 | 17.9 | 11.4 | 6.5 | 2.7396 | 27.4 | 67.0 | 73.6 |
| 1961 | 46 163 | 838 633 | 500 289 | 338 344 | 18.2 | 10.8 | 7.3 | 2.8242 | 25.7 | 67.5 | 74.4 |
| 1962 | 46 998 | 832 353 | 541 147 | 291 206 | 17.7 | 11.5 | 6.2 | 2.7957 | 25.7 | 67.0 | 73.9 |
| 1963 | 47 816 | 868 876 | 557 852 | 311 024 | 18.2 | 11.7 | 6.5 | 2.8962 | 25.6 | 66.8 | 73.8 |
| 1964 | 48 310 | 877 804 | 520 033 | 357 771 | 18.2 | 10.8 | 7.4 | 2.9149 | 23.4 | 67.7 | 74.8 |
| 1965 | 48 758 | 865 688 | 543 696 | 321 992 | 17.8 | 11.2 | 6.6 | 2.8492 | 21.9 | 67.5 | 74.7 |
| 1966 | 49 164 | 863 527 | 528 782 | 334 745 | 17.6 | 10.8 | 6.8 | 2.8008 | 21.7 | 67.8 | 75.2 |
| 1967 | 49 548 | 840 568 | 543 033 | 297 535 | 17.0 | 11.0 | 6.0 | 2.6711 | 20.7 | 67.8 | 75.2 |
| 1968 | 49 915 | 835 796 | 553 441 | 282 355 | 16.7 | 11.1 | 5.7 | 2.5880 | 20.4 | 67.8 | 75.2 |
| 1969 | 50 318 | 842 245 | 573 335 | 268 910 | 16.7 | 11.4 | 5.3 | 2.5343 | 19.6 | 67.4 | 75.1 |
| 1970 | 50 772 | 850 381 | 542 277 | 308 104 | 16.7 | 10.7 | 6.1 | 2.4803 | 18.2 | 68.4 | 75.9 |
| 1971 | 51 251 | 881 284 | 554 151 | 327 133 | 17.2 | 10.8 | 6.4 | 2.4972 | 17.2 | 68.3 | 75.9 |
| 1972 | 51 701 | 877 506 | 549 900 | 327 606 | 17.0 | 10.6 | 6.3 | 2.4187 | 16.0 | 68.5 | 76.2 |
| 1973 | 52 118 | 857 186 | 558 782 | 298 404 | 16.4 | 10.7 | 5.7 | 2.3086 | 15.4 | 68.7 | 76.3 |
| 1974 | 52 460 | 801 218 | 552 551 | 248 667 | 15.3 | 10.5 | 4.7 | 2.1123 | 14.6 | 68.9 | 76.7 |
| 1975 | 52 699 | 745 065 | 560 353 | 184 712 | 14.1 | 10.6 | 3.5 | 1.9272 | 13.8 | 69.0 | 76.9 |
| 1976 | 52 909 | 720 395 | 557 114 | 163 281 | 13.6 | 10.5 | 3.1 | 1.8290 | 12.5 | 69.2 | 77.2 |
| 1977 | 53 145 | 744 744 | 536 221 | 208 523 | 14.0 | 10.1 | 3.9 | 1.8619 | 11.4 | 69.7 | 77.8 |
| 1978 | 53 376 | 737 062 | 546 916 | 190 146 | 13.8 | 10.2 | 3.6 | 1.8215 | 10.7 | 69.8 | 77.9 |
| 1979 | 53 606 | 757 354 | 541 805 | 215 549 | 14.1 | 10.1 | 4.0 | 1.8553 | 10.0 | 70.1 | 78.3 |
| 1980 | 53 880 | 800 376 | 547 107 | 253 269 | 14.9 | 10.2 | 4.7 | 1.9450 | 10.0 | 70.2 | 78.4 |
| 1981 | 54 182 | 805 483 | 554 823 | 250 660 | 14.9 | 10.2 | 4.6 | 1.9455 | 9.7 | 70.4 | 78.5 |
| 1982 | 54 492 | 797 223 | 543 104 | 254 119 | 14.6 | 10.0 | 4.7 | 1.9123 | 9.5 | 70.7 | 78.9 |
| 1983 | 54 772 | 748 525 | 559 655 | 188 870 | 13.7 | 10.2 | 3.4 | 1.7844 | 9.1 | 70.7 | 78.8 |
| 1984 | 55 026 | 759 939 | 542 490 | 217 449 | 13.8 | 9.9 | 4.0 | 1.802 | 8.3 | 71.2 | 79.3 |
| 1985 | 55 284 | 768 431 | 552 496 | 215 935 | 13.9 | 10.0 | 3.9 | 1.814 | 8.3 | 71.3 | 79.4 |
| 1986 | 55 577 | 778 468 | 546 926 | 231 542 | 14.0 | 9.8 | 4.2 | 1.831 | 8.0 | 71.5 | 79.7 |
| 1987 | 55 824 | 767 828 | 527 466 | 240 362 | 13.8 | 9.4 | 4.3 | 1.801 | 7.8 | 72.0 | 80.3 |
| 1988 | 56 118 | 771 268 | 524 600 | 246 668 | 13.7 | 9.3 | 4.4 | 1.805 | 7.8 | 72.3 | 80.5 |
| 1989 | 56 423 | 765 473 | 529 283 | 236 190 | 13.6 | 9.4 | 4.2 | 1.788 | 7.5 | 72.5 | 80.6 |
| 1990 | 56 709 | 762 407 | 526 201 | 236 206 | 13.4 | 9.3 | 4.2 | 1.778 | 7.3 | 72.7 | 81.0 |
| 1991 | 56 976 | 759 056 | 524 685 | 234 371 | 13.3 | 9.2 | 4.1 | 1.770 | 7.3 | 72.9 | 81.2 |
| 1992 | 57 240 | 743 658 | 521 530 | 222 128 | 13.0 | 9.1 | 3.9 | 1.733 | 6.8 | 73.2 | 81.5 |
| 1993 | 57 467 | 711 610 | 532 263 | 179 347 | 12.4 | 9.3 | 3.1 | 1.660 | 6.5 | 73.3 | 81.5 |
| 1994 | 57 659 | 710 993 | 519 965 | 191 028 | 12.3 | 9.0 | 3.3 | 1.663 | 5.9 | 73.7 | 81.9 |
| 1995 | 57 844 | 729 609 | 531 618 | 197 991 | 12.6 | 9.2 | 3.4 | 1.713 | 4.9 | 73.9 | 81.9 |
| 1996 | 58 026 | 734 338 | 535 775 | 198 563 | 12.7 | 9.2 | 3.4 | 1.733 | 4.8 | 74.1 | 82.1 |
| 1997 | 58 207 | 726 768 | 530 319 | 196 449 | 12.5 | 9.1 | 3.4 | 1.726 | 4.7 | 74.6 | 82.3 |
| 1998 | 58 398 | 738 080 | 534 005 | 204 075 | 12.6 | 9.1 | 3.5 | 1.764 | 4.6 | 74.8 | 82.4 |
| 1999 | 58 661 | 744 791 | 537 661 | 207 130 | 12.7 | 9.2 | 3.5 | 1.791 | 4.3 | 75.0 | 82.5 |
| 2000 | 59 049 | 774 782 | 530 864 | 243 918 | 13.1 | 9.0 | 4.1 | 1.874 | 4.4 | 75.3 | 82.8 |
| 2001 | 59 477 | 770 945 | 531 073 | 239 872 | 13.0 | 8.9 | 4.0 | 1.877 | 4.5 | 75.5 | 82.9 |
| 2002 | 59 894 | 761 630 | 535 144 | 226 486 | 12.7 | 8.9 | 3.8 | 1.864 | 4.1 | 75.8 | 83.1 |
| 2003 | 60 304 | 761 464 | 552 339 | 209 125 | 12.6 | 9.2 | 3.5 | 1.874 | 4.0 | 75.9 | 83.0 |
| 2004 | 60 734 | 767 816 | 509 429 | 258 387 | 12.6 | 8.4 | 4.3 | 1.898 | 3.9 | 76.7 | 83.9 |
| 2005 | 61 182 | 774 355 | 527 533 | 246 822 | 12.7 | 8.6 | 4.0 | 1.920 | 3.6 | 76.8 | 83.9 |
| 2006 | 61 598 | 796 896 | 516 416 | 280 480 | 12.9 | 8.4 | 4.6 | 1.980 | 3.6 | 77.2 | 84.2 |
| 2007 | 61 965 | 785 985 | 521 016 | 264 969 | 12.7 | 8.4 | 4.3 | 1.959 | 3.6 | 77.4 | 84.4 |
| 2008 | 62 301 | 796 044 | 532 131 | 263 913 | 12.8 | 8.5 | 4.2 | 1.990 | 3.6 | 77.6 | 84.4 |
| 2009 | 62 616 | 793 420 | 538 166 | 255 254 | 12.7 | 8.6 | 4.1 | 1.989 | 3.7 | 77.8 | 84.5 |
| 2010 | 62 765 | 802 224 | 540 469 | 261 755 | 12.8 | 8.6 | 4.2 | 2.016 | 3.6 | 78.0 | 84.7 |
| 2011 | 63 070 | 792 996 | 534 795 | 258 201 | 12.5 | 8.5 | 4.0 | 1.996 | 3.5 | 78.4 | 85.0 |
| 2012 | 63 375 | 790 290 | 559 227 | 231 063 | 12.4 | 8.8 | 3.6 | 1.992 | 3.5 | 78.5 | 84.8 |
| 2013 | 63 697 | 781 621 | 558 408 | 223 213 | 12.3 | 8.8 | 3.5 | 1.974 | 3.6 | 78.8 | 85.0 |
| 2014 | 63 982 | 781 167 | 547 003 | 234 164 | 12.3 | 8.7 | 3.7 | 1.976 | 3.6 | 79.3 | 85.4 |
| 2015 | 64 359 | 760 151 | 581 770 | 178 381 | 11.9 | 9.2 | 2.7 | 1.931 | 3.7 | 79.0 | 85.1 |
For the purpose of compatibility, all data refers to Metropolitan France
Current natural increase for Metropolitan France[20]
- Number of births from January–OCtober 2015 =
 634,885
 - Number of births from January–October 2016 = 622,900
- Number of deaths from January–October 2015 =
 486,422
 - Number of deaths from January–October 2016 =
 473,700
- Natural growth from January–October 2015 = 148,463
- Natural growth from January–October 2016 =
 149,200
Fertility
France has a high fertility rate by European standards; this rate has increased after reaching a historic low in the early 1990s.
- Total fertility rate: 2.01 children born per woman for metropolitan France and the overseas departments (in 2012),[1] 2.00 for metropolitan France alone (in 2010).[21]
- Mean age of women having their first birth: 29.9 years-old.[22]
The table below gives the average number of children according to the place of birth of women. An immigrant woman is a woman who was born outside France and who did not have French citizenship at birth.[23]
| Average number of children in France (1991–1998) |
Average number of children in country of origin (1990–1999) | |
|---|---|---|
| All women living in metropolitan France | 1.74 | |
| Women born in Metropolitan France | 1.70 | |
| Immigrant women | 2.16 | |
| Women born in overseas France | 1.86 | |
| Immigrant women (country of birth) | ||
| Spain | 1.52 | 1.23 |
| Italy | 1.60 | 1.24 |
| Portugal | 1.96 | 1.49 |
| Other EU | 1.66 | 1.44 |
| Turkey | 3.21 | 2.16 |
| Other Europe | 1.68 | 1.41 |
| Algeria | 2.57 | 1.78 |
| Morocco | 2.97 | 3.28 |
| Tunisia | 2.90 | 2.73 |
| Other Africa | 2.86 | 5.89 |
| Asia (Mostly China) | 1.77 | 2.85 |
| The Americas and Oceania | 2.00 | 2.54 |
Births by country of birth or citizenship of the parents
Births by country of birth of the parents
About 40% of newborns in France between 2006 and 2008 had one foreign-born grandparent (11% born in another European country, 16% born in the Maghreb and 12% born in another region of the world).[8]
In 2010, 27.3% of newborns in metropolitan France had at least one foreign-born parent and 23.9% had at least one parent born outside of Europe (EU 27) (parents born in overseas territories are considered as born in France).[5][7]
The table below gives the number of children born in metropolitan France according to the place of birth of both parents.
| Birth country of parents | 1998 | 1999 | 2000 | 2001 | 2002 | 2003 | 2004 | 2005 | 2006 | 2007 | 2008 | 2009 | 2010 | 2010% | 2011 | 2012 | 2013 | 2014 | 2014% |
|---|---|---|---|---|---|---|---|---|---|---|---|---|---|---|---|---|---|---|---|
| Both parents born in France | 566 447 | 576 537 | 601 268 | 595 286 | 580 999 | 575 985 | 574 687 | 575 659 | 590 163 | 579 515 | 585 427 | 578 052 | 583 600 | 72.7% | 604 077 | 598 473 | 583 864 | 579 106 | 70,75% |
| One parent born in France, other foreign-born | 101 511 | 98 687 | 101 498 | 102 013 | 103 930 | 106 677 | 110 258 | 114 090 | 119 159 | 119 587 | 121 845 | 125 058 | 129 025 | 16.1% | 119 114 | 119 957 | 119 643 | 123 855 | 15,13% |
| Father born in EU28, mother born in France | 13 194 | 12 858 | 13 060 | 12 447 | 11 732 | 11 442 | 10 811 | 10 667 | 10 455 | 10 188 | 9 975 | 9 526 | 9 549 | 1.2% | 9 961 | 9 637 | 9 414 | 9 235 | 1,13% |
| Father not born in EU28, mother born in France | 44 891 | 43 807 | 45 612 | 46 459 | 47 695 | 49 790 | 52 244 | 54 176 | 56 886 | 56 626 | 57 955 | 60 362 | 62 478 | 7.8% | 55 209 | 55 488 | 55 397 | 56 370 | 6,89% |
| Father born in France, mother born in EU28 | 13 020 | 12 647 | 12 411 | 11 881 | 11 439 | 11 119 | 10 930 | 10 827 | 10 794 | 10 575 | 10 562 | 10 585 | 10 418 | 1.3% | 10 104 | 9 761 | 9 772 | 10 058 | 1,23% |
| Father born in France, mother not born in EU28 | 30 406 | 29 375 | 30 415 | 31 226 | 33 064 | 34 326 | 36 273 | 38 420 | 41 024 | 42 198 | 43 353 | 44 585 | 46 580 | 5.8% | 43 840 | 45 071 | 45 060 | 48 192 | 5,89% |
| Both parents foreign-born | 70 122 | 69 567 | 72 016 | 73 646 | 76 701 | 78 802 | 82 871 | 84 606 | 87 574 | 86 883 | 88 772 | 90 310 | 89 599 | 11.2% | 100 203 | 102 617 | 108 003 | 115 604 | 14,12% |
| Both parents born in EU28 | 6 681 | 6 157 | 5 780 | 5 524 | 5 159 | 5 369 | 5 426 | 5 372 | 5 778 | 5 891 | 6 276 | 6 442 | 6 694 | 0.8% | 7 798 | 8 419 | 8 884 | 9 726 | 1,19% |
| Both parents not born in EU28 | 60 281 | 60 636 | 63 299 | 65 406 | 68 788 | 70 552 | 74 537 | 76 348 | 78 700 | 78 020 | 79 405 | 80 641 | 79 698 | 9.9% | 89 163 | 91 049 | 95 721 | 102 319 | 12,50% |
| Father born in EU27, mother not born in EU28 | 1 188 | 1 047 | 1 116 | 1 035 | 1 038 | 1 075 | 1 150 | 1 100 | 1 256 | 1 190 | 1 226 | 1 268 | 1 258 | 0.2% | 1 469 | 1 436 | 1 494 | 1 554 | 0,19% |
| Father not born in EU27, Mother born in EU28 | 1 972 | 1 727 | 1 821 | 1 681 | 1 716 | 1 806 | 1 758 | 1 786 | 1 840 | 1 782 | 1 865 | 1 959 | 1 949 | 0.2% | 1 773 | 1 713 | 1 904 | 2 005 | 0,24% |
| Total of newborns | 738 080 | 744 791 | 774 782 | 770 945 | 761 630 | 761 464 | 767 816 | 774 355 | 796 896 | 785 985 | 796 044 | 793 420 | 802 224 | 100% | 823 394 | 821 047 | 811 510 | 818 565 | 100% |
Births by citizenship of the parents
In 2010, 80.1% of newborns in metropolitan France had two French parents, 13.3% had one French parent, and 6,6% had two non French parents.[5][24]
The table below gives the number of children born in metropolitan France according to the citizenship of both parents.
| Citizenship of parents | 1998 | 1999 | 2000 | 2000% | 2001 | 2002 | 2003 | 2004 | 2005 | 2006 | 2007 | 2008 | 2009 | 2010 | 2010% | 2011 | 2012 | 2013 | 2014 |
|---|---|---|---|---|---|---|---|---|---|---|---|---|---|---|---|---|---|---|---|
| Both French parents | 630 995 | 633 788 | 657 576 | 84.9% | 648 506 | 633 294 | 629 014 | 628 062 | 630 481 | 645 879 | 635 082 | 640 596 | 634 153 | 642 816 | 80.1% | 659 834 | 651 577 | 638 576 | 634 027 |
| One French parent, other non-French | 57 897 | 61 577 | 66 636 | 8.6% | 69 954 | 74 590 | 78 318 | 84 013 | 88 965 | 94 888 | 96 314 | 100 464 | 103 704 | 106 622 | 13.3% | 105 767 | 108 905 | 109 809 | 115 647 |
| French mother, father with European citizenship (EU28) | 9 146 | 9 175 | 9 554 | 1.2% | 9 397 | 8 866 | 9 019 | 8 749 | 8 503 | 8 571 | 8 509 | 8 349 | 8 197 | 8 829 | 1.1% | 8 300 | 8 270 | 8 120 | 8 019 |
| French mother, father with non-European citizenship (EU28) | 25 117 | 26 720 | 29 592 | 3.8% | 31 463 | 33 820 | 35 756 | 38 923 | 41 061 | 43 698 | 43 603 | 45 579 | 46 753 | 46 456 | 5.8% | 44 600 | 45 599 | 45 866 | 47 184 |
| French father, mother with European citizenship (EU28) | 7 535 | 7 551 | 7 409 | 1.0% | 7 235 | 7 359 | 7 097 | 7 172 | 7 324 | 7 395 | 7 420 | 7 642 | 7 862 | 7 874 | 1.0% | 7 856 | 7 747 | 7 901 | 8 162 |
| French father, mother with non-European citizenship (EU28) | 16 099 | 18 131 | 20 081 | 2.6% | 21 859 | 24 545 | 26 446 | 29 169 | 32 077 | 35 224 | 36 782 | 38 894 | 40 892 | 43 463 | 5.4% | 45 011 | 47 289 | 47 922 | 52 282 |
| Both non-French parents | 49 188 | 49 426 | 50 570 | 6.5% | 52 485 | 53 746 | 54 132 | 55 741 | 54 909 | 56 129 | 54 589 | 54 984 | 55 563 | 52 786 | 6.6% | 57 793 | 60 565 | 63 125 | 68 891 |
| Both parents with European citizenship (EU28) | 6 715 | 6 359 | 6 166 | 0.8% | 5 808 | 5 507 | 5 589 | 5 670 | 5 667 | 6 085 | 6 214 | 6 623 | 6 803 | 6 958 | 0.9% | 7 895 | 8 556 | 9 176 | 10 217 |
| Both parents with non-European citizenship (EU28) | 41 268 | 41 845 | 42 985 | 5.5% | 45 265 | 46 807 | 46 921 | 48 364 | 47 440 | 48 091 | 46 301 | 46 167 | 46 435 | 43 454 | 5.4% | 47 419 | 49 262 | 50 860 | 55 056 |
| Father with European citizenship (EU28), mother with non-European citizenship (EU28) | 440 | 502 | 565 | 0.1% | 589 | 571 | 685 | 733 | 797 | 937 | 967 | 1 062 | 1 141 | 1 235 | 0.2% | 1 400 | 1 555 | 1 700 | 2 091 |
| Father with non-European citizenship (EU28), mother with European citizenship (EU28) | 765 | 720 | 854 | 0.1% | 823 | 861 | 937 | 974 | 1 005 | 1 016 | 1 107 | 1 132 | 1 184 | 1 139 | 0.2% | 1 079 | 1 192 | 1 389 | 1 527 |
| Total of newborns | 738 080 | 744 791 | 774 782 | 100% | 770 945 | 761 630 | 761 464 | 767 816 | 774 355 | 796 896 | 785 985 | 796 044 | 793 420 | 802 224 | 100% | 823 394 | 821 047 | 811 510 | 818 565 |
Ethnic groups
As of 2004, French conservative think-tank Institut Montaigne estimated that there were 60 million (85%) white people of European origin, 6 million (10%) North African people, 2 million (3.5%) Black people and 1 million (1.5%) people of Asian origin in Metropolitan France, including all generations of immigrant descendants.[26]
The scope of foreign origin can be estimated by the National Screening Program for Sickle Cell Disease because the genetic disease very rarely affects European people. Newborn babies with at least one parent who originates from a risk region are screened. The screening suggests that in 2000, 19 percent of all newborn babies in mainland France had at least one parent originating from one of the risk regions. The figure for 2007 was 28.45 percent, for 2010 31.5 percent, for 2012 34.44 percent, and for 2013 35.7 percent.[27]
The modern ethnic French are the descendants of Celts, Iberians, Ligurians, Italic peoples (including Romans) and Greeks in southern France,[28][29] later mixed with large group of Germanic peoples arriving at the end of the Roman Empire such as the Franks the Burgundians, Alamanni and Goths,[30] very small portions of Moors and Saracens in the south,[31][32][33][34][35][36][37] and Scandinavians, Vikings who became, by mixing with the local population, the Normans and settled mostly in Normandy in the 9th century.[38][39]
Due to a law dating from 1872, the French Republic prohibits performing census by making distinction between its citizens regarding their race or their beliefs.[40]
Some organizations, such as the Representative Council of Black Associations of France (French: Conseil représentatif des associations noires de France, CRAN), have argued in favour of the introduction of data collection on minority groups but this has been resisted by other organizations and ruling politicians,[41][42] often on the grounds that collecting such statistics goes against France's secular principles and harks back to Vichy-era identity documents.[43] During the 2007 presidential election, however, Nicolas Sarkozy, polled on the issue, stated that he favoured the collection of data on ethnicity.[44] Part of a parliamentary bill that would have permitted the collection of data for the purpose of measuring discrimination was rejected by the Conseil Constitutionnel in November 2007.[40]
However, that law does not concern surveys and polls, which are free to ask those questions if they wish. The law also allows for an exception for public institutions such as the INED or the INSEE whose job it is to collect data on demographics, social trends and other related subjects, on condition that the collection of such data has been authorized by the National Commission for Computer-stocked data and Freedom (CNIL) and the National Council of Statistical Information (CNIS).[45]
Of European ethnic groups not indigenous to France, the most numerous are people of Italian family origin and it is estimated that about 5 million citizens (8% of the population) are at least partly of Italian origin if their parentage is retraced over three generations.[46] This is due to waves of Italian immigration, notably during the late 19th century and early 20th century. Other large European groups of non-native origin are Spaniards, Portuguese, Romanians, Polish, and Greeks. Also, due to more recent immigration, between five and six million people of Maghrebi origin[47] and approximately 800,000 Turks inhabit France.[48][49] An influx of North African Jews immigrated to France in the 1950s and after the Algerian War due to the decline of the French empire. Subsequent waves of immigration followed the Six-Day War, when some Moroccan and Tunisian Jews settled in France. Hence, by 1968, North African Jews were about 500,000 and the majority in France. As these new immigrants were already culturally French they needed little time to adjust to French society. Black people come from both the French overseas territories (French Guiana, Guadeloupe, Martinique, Réunion, and former colony Haiti) and Sub-Saharan Africa (especially Cote d'Ivoire, Mali, and Senegal). France has the largest black population in Europe.
Solis, a marketing company, recently estimated the numbers for ethnic minorities (immigrants and 2nd generation) in France in 2009 as 3.26 million Maghrebis (5.23%), 1.83 million Black people (2.94%), 1.08 million Sub-Saharan Africans and 757,000 French from French West Indies) and 250,000 Turkish (0.71%) .[50][51]
Immigration
Since the 19th century, France has continued being a country of immigration. During the Trente Glorieuses (1945–1974), the country's reconstruction and steady economic growth led to the labor-immigration of the 1960s, when many employers found manpower in villages located in Southern Europe and North Africa. In 2008, the French national institute of statistics INSEE estimated that 11.8 million foreign-born immigrants and their direct descendants (second generation) lived in France representing 19% of the country's population. About 5.5 million are of European origin and 4 million of Maghrebi origin.[52][53]
Immigration to France exceeded 200,000 in recent years, as shown in table below.[54]
| Region | 2004 | 2005 | 2006 | 2007 | 2008 | 2009 | 2010 | 2011 | 2012 | % 2012 |
| Europe | 80 500 | 78 660 | 80 120 | 79 290 | 80 330 | 75 040 | 88 820 | 94 580 | 105 830 | 46 % (including from Eastern Europe) |
| Africa | 70 200 | 66 110 | 62 340 | 62 140 | 63 470 | 66 480 | 65 610 | 66 280 | 68 640 | 30 % (including from Maghreb) |
| Asia | 30 960 | 30 120 | 30 520 | 32 070 | 30 180 | 32 960 | 29 810 | 32 430 | 32 060 | 14 % (including from China) |
| America and Oceania | 19 810 | 19 990 | 20 460 | 18 770 | 21 440 | 20 450 | 26 270 | 23 360 | 23 070 | 10% |
| All countries | 201 470 | 194 880 | 193 440 | 192 270 | 195 420 | 194 930 | 210 510 | 216 650 | 229 600 | 100% |
Before World War II
In the 20th century, France experienced a high rate of immigration from other countries. The immigration rate was particularly high during the 1920s and 1930s. France was the European country which suffered the most from World War I, with respect to the size of its population, losing 1.4 million young men out of a total population of 40 million. France was also at the time the European country with the lowest fertility rate, which meant that the country had a very hard time recovering from the heavy losses of the war. France had to open its doors to immigration, which was the only way to prevent population decline between the two world wars.[55]
At the time, France was the only European country to permit mass immigration. The other major European powers, such as the UK or Germany, still had high fertility rates, so immigration was seen as unnecessary, and it was also undesirable to the vast majority of their populations. The majority of immigrants in the 1920s came from Italy and Poland, though some also came from 1930s came from elsewhere in southern and eastern Europe, and the first wave of colonial French subjects from Africa and Asia. This mass immigration was ended and partially reversed by the economic problems of the 1930s.[56] By the end of the Spanish Civil War, some half-million Spanish Republican refugees had crossed the border into France.[57] At this time, Judaism was the second most populous religion in France, as it had been for centuries. However, this would soon change.
Local populations often opposed immigrant manpower, leading to occasional outbursts of violence. The most violent was a pogrom against Italian workers who worked in the salt evaporation ponds of Peccais, erupted in Aigues-Mortes in 1893, killing at least nine and injuring hundreds on the Italian side.[58]
After World War II
After World War II, the French fertility rate rebounded considerably, as noted above, but economic growth in France was so high that new immigrants had to be brought into the country. Most immigrants were Portuguese as well as Arabs and Berbers from North Africa. The first wave arrived in the 1950s, but the major arrivals happened in the 1960s and 1970s. More than one million people from the Maghreb immigrated in the 1960s and early 1970s from North Africa, especially Algeria (following the end of French rule there) . One million European pieds noirs also migrated from Algeria in 1962 and the following years during the chaotic independence of Algeria.[59] France has over three million French of Algerian descent, a small percentage of whom are third-or fourth-generation French.
French law facilitated the immigration of thousands of French settlers (colons in French language), ethnic or national French from former colonies of North and West Africa, India and Indochina, to mainland France. 1.6 million European pieds noirs settlers migrated from Algeria, Tunisia and Morocco.[60] In the 1970s, over 30,000 French settlers left Cambodia during the Khmer Rouge regime as the Pol Pot government confiscated their farms and land properties. However, after the 1973 energy crisis, laws limiting immigration were passed. In addition, the country's birth rate dropped significantly during this time.
Between 1956 and 1967, about 235.000 Sephardic North African Jews from Algeria, Tunisia and Morocco also immigrated to France because of the decline of the French colonial empire and following the Six-Day War. Hence, by 1968, Sephardic North African Jews were the majority of the Jews in France. As the new immigrants were already culturally French, they needed little time to adjust to French society.[61]
In the late 1970s, the end of high economic growth in France caused immigration policies to be considerably tightened, starting with laws by Charles Pasqua passed in 1986 and 1993. New immigrants were allowed only through the family reunion schemes (wives and children moving to France to live with husbands or fathers already living in France), or as asylum seekers. Illegal immigration thus developed as immigration policy became more rigid. In 2006, The French Ministry of the Interior estimated clandestine immigrants in France amounted to anywhere between 200,000 and 400,000 and expected between 80,000 and 100,000 people to enter the country illegally each year.[62]
The Pasqua laws are a significant landmark in the shift in France's immigration policy through the course of the 20th century. They are a sign of the securitization aspect of immigration, giving more power to the police, allowing them to perform random identity checks and deport immigrants without legal papers. The rise in anti-immigration sentiments was reinforced by a series of terrorist bombs in Paris in 1986, linked to Muslim immigrants in France.[63]
Tightening immigration laws, as well as notions of "zero immigration", reflected national views that arose within the discussion around immigrant family reunification and national identity. Institut français des relations internationales (IFRI) immigration expert, Christophe Bertossi, states that stigmatized as both a challenge to social cohesion and a "burden" for the French economy, family immigration is increasingly restricted and constructed as a racial issue. The "immigration choisie" policy strives consequently to select migrants according to their profile, skills and, still indirectly, origins.[64][65]
Nonetheless, immigration rates in the 1980s and 1990s were much lower than in the 1960s and 1970s, especially compared to other European countries. The regions of emigrations also widened, with new immigrants now coming from sub-Saharan Africa and Asia. In the 1970s, a small but well-publicized wave of Chilean and Argentine political refugees from their countries' dictatorships found asylum in France.
Ethnic Vietnamese started to become a visible segment of society after the massive influx of refugees after the end of the Vietnam War in 1975. The expulsions of ethnic Chinese from Vietnam in the 1970s led to a wave of immigration and the settlement of the high-rise neighbourhood near the Porte d'Italie, where the Chinatown of Paris is located. Located in the 13th arrondissement, the area contains many ethnic Chinese inhabitants.[66]
The large-scale immigration from Islamic countries has sparked controversy in France. Nevertherless, according to Justin Vaïsse, in spite of obstacles and spectacular failures like the riots in November 2005, in Parisian suburbs, where many immigrants live secluded from society with very few capabilities to live in better conditions, the integration of Muslim immigrants is happening as part of a background evolution[67] and recent studies confirmed the results of their assimilation, showing that "North Africans seem to be characterized by a high degree of cultural integration reflected in a relatively high propensity to exogamy" with rates ranging from 20% to 50%.[68] According to Emmanuel Todd, the relatively high exogamy among French Algerians can be explained by the colonial link between France and Algeria.[69][70] One illustration of this growing resentment and job insecurity can be drawn from related events, such as the 2005 riots, which ensued in former President Chirac declaring a state of emergency.[71] Massive demonstrations to express frustration over unemployment took place in March 2009.[72] The importance of integration was brought to the forefront of the political agenda in Sarkozy's 2007 presidential campaign. Upon being elected, he symbolically created the French Ministry of Immigration, Integration, National Identity and Codevelopment. Integration is one of the pillars of its political aims.[73]
Today
In 2014, the National Institute of Statistics (INSEE is its acronym in French) published a study, according to which has doubled the number of Spanish, Portuguese and Italians in France between 2009 and 2012.
According to the French Institute, the increase resulting from the financial crisis that hit several European countries in that period, has pushed up the number of Europeans installed in France.[3] Statistics on Spanish immigrants in France show a growth of 107% between 2009 and 2012, from 5300 to 11,000 people.[3][74]
Of 229,000 foreigners were in France in 2012, nearly 8% were Portuguese, British 5%, Spanish 5%, Italians 4%, Germans 4%, Romanians 3%, Belgians 3% and Dutch 2%.[3][75]
With the increase of Spanish, Portuguese and Italian in France, the weight of European immigrants arrived in 2012 to 46%, while the percentage for African immigrants reached 30%, with a presence in Morocco (7%), Algeria (7%) and Tunisia (3%).
Meanwhile, 14% of all immigrants who settled in France that year were from Asian countries: 3% of China and 2% in Turkey while America and Oceania constitute 10% of Americans and Brazilians accounted for higher percentage, 2% each.[3][75]
As of 2008, the French national institute of statistics INSEE estimated that 11.8 million foreign-born immigrants and their direct descendants (limited to second-generation born in France) lived in France representing 19% of the country's population. More than 5.5 million are of European origin and about 4 million of Maghrebi origin (20% of Algerian origin and 15% of Moroccan or Tunisian origin). Immigrants aged 18 to 50 count for 2.7 million (10% of population age 18–50) and 5 million for all ages (8% of population). The second-generation immigrants aged 18 to 50 make up 3.1 million (12% of 18–50) and 6.5 million for all ages (11% of population).[52][53] Without considering citizenship at birth, people not born in metropolitan France and their direct descendants made up 30% of the population aged 18–50 in metropolitan France as of 2008.[76]
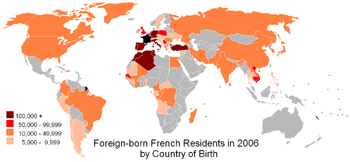
The region with the largest proportion of immigrants is the Île-de-France (Greater Paris), where 40% of immigrants live. Other important regions are Rhône-Alpes (Lyon) and Provence-Alpes-Côte d'Azur (Marseille). The most important individual countries of origin as of 2007 were Algeria (702,000), Morocco (645,000), Portugal (576,000), Italy (323,000), Spain (262,000) and Turkey (234,000). However, immigration from Asia (especially China), as well as from sub-Saharan Africa (Senegal, Mali) is gaining in importance.
42% of the immigrants are from Africa (30% from Maghreb and 12% from Sub-Saharan Africa), 38% from Europe (mainly from Portugal, Turkey, Italy and Spain), 14% from Asia and 5% from America and Oceania.[53] Outside Europe and North Africa, the highest rate of immigration is from Vietnam, Cambodia and Senegal.
The following table shows immigrants and second-generation immigrants by origin as of 2008 according to a study published by Insee in 2012. Third-generation immigrants, illegal immigrants, as well as ethnic minorities like black people from the French overseas territories residing in metropolitan France (800,000), Roms (500,000) or people born in Maghreb with French citizenship at birth (1 million Maghrebi Jews, Harkis and Pied-Noir) and their descendants, who are French by birth and not considered as immigrants or immigrant descendants, are not taken into account.[77]
| Immigrants by origin (2008) in thousands | Immigrants | Second generation | Total | % |
|---|---|---|---|---|
| Spain | 257 | 620 | 877 | 7.3% |
| Italy | 317 | 920 | 1 237 | 10.4% |
| Portugal | 581 | 660 | 1 241 | 10.4% |
| Turkey | 239 | 220 | 459 | 3.8% |
| Other countries from EU27 | 653 | 920 | 1 573 | 13.2% |
| Other European countries | 224 | 210 | 434 | 3.6% |
| Europe Total | 2 032 | 3 330 | 5 362 | 44.9% |
| Algeria | 713 | 1 000 | 1 713 | 14.3% |
| Morocco | 654 | 660 | 1 314 | 11.0% |
| Tunisia | 235 | 290 | 525 | 4.4% |
| Maghreb Total | 1 602 | 1 950 | 3 552 | 29.7% |
| Subsaharan Africa | 669 | 570 | 1 239 | 10.4% |
| SouthEast Asia | 163 | 160 | 323 | 2.7% |
| Other Asian countries | 355 | 210 | 565 | 4.7% |
| America/Oceania | 282 | 170 | 452 | 3.8% |
| Other Regions Total | 1 708 | 1 330 | 3 038 | 25.4% |
| Total | 5 342 | 6 610 | 11 952 | 100.00% |
These were the top ten emigrant countries in 2012:[78]
.svg.png)
.svg.png)
.svg.png)


According to Michèle Tribalat, researcher at INED, there were, in 1999, approximately 14 million persons of foreign ancestry (about a quarter of the population), defined as either immigrants or people with at least one immigrant parent or grandparent. Half of them were of European ancestry (including 5.2 million from South Europe (Italy, Spain, Portugal and former Yugoslavia)). The rest were from Maghreb (3 million), Sub-saharan Africa (680,000), Turkey (320,000) and other parts of the world (2.5 million).[79] Immigrants from the Maghreb are commonly referred to as beur, a verlan slang term derived from the word arabe (French for Arab).[80]
According to the distinguished French historian of immigration Gérard Noiriel, one third of the population currently living in France is of "foreign" descent.[81]
In 2004, a total of 140,033 people immigrated to France. Of them, 90,250 were from Africa and 13,710 from Europe.[82] In 2005, immigration levels fell slightly to 135,890.[83] The European Union allows free movement between the member states. While the UK (along with Ireland and Sweden and non-EU members Norway and Switzerland) did not impose restrictions, France put in place controls to curb Eastern European migration.
As at 1 January 2006, INSEE estimates that the number of foreigners living in metropolitan France amounted to 3.5 million people. Two out of five foreigners are from Portugal, Algeria or Morocco. Thus, EU nationals immigrating to France comprise 1.2 million people, and 1.1 million people are from the three Maghreb countries of Morocco, Algeria and Tunisia. It is interesting to note that immigrants are concentrated in Île-de-France, Rhone-Alpes, Provence and Côte d'Azur regions, accounting for 60% of the total immigrant population. Furthermore, there appears to be a lower rate of immigrants arriving from the EU since 1975 as opposed to an increase in African immigrants.[84]
In the first decade of the 21st century, the net migration rate was estimated to be 0.66 migrants per 1,000 population a year.[85] This is a very low rate of immigration compared to other European countries, the USA or Canada. Since the beginning of the 1990s, France has been attempting to curb immigration, first with the Pasqua laws, followed by both right-wing and socialist-issued laws. This trend is also demonstrated in anti-immigrant sentiments among the public. For example, the Pew Research Center in Washington, D.C. conducted a public opinion poll in February 2004 among French nationals. This poll measured the extent of support for restricting immigration among French nationals, by age cohort. 24% of individuals 18 to 29 were restricting immigration, with 33% of individuals 30 to 49 and 53% for both 50 to 64 and 65 and over.[86] Nearly nine years later, a January 2013 poll conducted in France by Ipsos found that 70% of respondents said that there were "too many immigrants in France".[87]
The immigration rate is currently lower than in other European countries such as United Kingdom and Spain; however, some say it is unlikely that the policies in themselves account for such a change. Again, as in the 1920s and 1930s, France stands in contrast with the rest of Europe. Back in the 1920s and 1930s, when other European countries had a high fertility rate, France had a low fertility rate and opened its doors to immigration to avoid a population decline. Today, it is the rest of Europe that has very low fertility rates, and countries like Germany or Spain avoid population decline only through immigration. In France, however, the fertility rate is still fairly high for European standards. It is, in fact, the highest in Europe after Ireland (the EU) and Albania (perhaps higher than Ireland's) and so most population growth is due to natural increase, unlike in the other European countries.[88]
The difference in immigration trends is also because the labour market in France is currently less dynamic than in other countries such as the UK, Ireland or Spain. One reason for this could be France's relatively high unemployment, which the country has struggled to reduce for the past two decades. There is also a parallel dynamic between immigration and unemployment. Immigrants tend to be subjected to higher rates of unemployment. In 2008, the immigrant unemployment rate in France was a startling 13%, twice as high as for the national population (6%).[89] One can further analyse the trend in relation to education. In the ministry's 2010 report on professional inclusion for immigrants, 19.6% of immigrants without any education were unemployed while 16.1% of immigrants who had graduated high school were unemployed. Only 11.4% of immigrants with an undergraduate degree or higher were unemployed.[90]
For example, according to the UK Office for National Statistics, between July 2001 and July 2004, the population of the UK increased by 721,500 inhabitants, of which 242,800 (34%) was due to natural increase, 478,500 (66%) to immigration.[91] According to the INSEE, between January 2001 and January 2004 the population of Metropolitan France increased by 1,057,000 inhabitants of which 678,000 (64%) was due to natural increase, 379,500 (36%) from immigration.[92]
The latest 2008 demographic statistics have been released, and France's birth and fertility rates have continued to rise. The fertility rate increased to 2.01 in 2012[1] and, for the first time, surpasses the fertility rate of the United States.[93]
Americans in France
Americans total more than 100,000[94] permanent residents in France, Canadians 11,931,[95] followed by Latin Americans, are a growing subgroup, the most numerous of which are Brazilians, at 44,622;[96] followed by Colombians, at 40,000, Venezuelans, at 30,000;[97] Peruvians, at 22,002;[98] Argentineans, at 11,899;[99] and Chileans, 15,782.[100]
Europeans in France
In 2014 The National Institute of Statistics (INSEE, for its acronym in French) published a study, according to which has doubled the number of Spanish immigrants, Portuguese and Italians in France between 2009 and 2012.
According to the French Institute, the increase resulting from the financial crisis that hit several European countries in that period, has pushed up the number of Europeans installed in France.[3] Statistics on Spanish immigrants in France show a growth of 107 percent between 2009 and 2012, i.e. in this period went from 5300 to 11,000 people.[74]
Of the total of 229,000 foreigners in France in 2012, nearly 8% were Portuguese, British 5%,[3] Spanish 5%, Italians 4%, Germans 4%, Romanians 3%, 3% Belgians.[3][75]
With the increase of Spanish, Portuguese and Italian in France, the weight of European immigrants arrived in 2012 to 46 percent, while this percentage for African reached 30%, with a presence in Morocco (7%), Algeria (7%) and Tunisia (3%).
Meanwhile, 14% of all immigrants who settled in France that year were from Asian countries: 3% of China and 2% in Turkey, while in America and Oceania constitute 10% of Americans and Brazilians accounted for higher percentage, 2% each.[3][75]
Maghrebis in France
French of Maghrebi origin form the largest ethnic group after French of European origin.
According to Michel Tribalat, a researcher at INED, there were 3.5 million people of Maghrebi origin (with at least one grandparent from Algeria, Morocco or Tunisia) living in France in 2005 corresponding to 5.8% of the total French metropolitan population (60.7 million in 2005).[101] Maghrebis have settled mainly in the industrial regions in France, especially in the Paris region. Many famous French people like Edith Piaf,[102] Isabelle Adjani, Arnaud Montebourg, Alain Bashung, Dany Boon and many others have Maghrebi ancestry.
Below is a table of population of Maghrebi origin in France, numbers are in thousands:
| Country | 1999 | 2005 | % 1999/2005 | % French population (60.7 million in 2005) |
|---|---|---|---|---|
| Algeria | 1,577 | 1,865 | +18.3% | 3.1% |
| Immigrants | 574 | 679 | ||
| Born in France | 1,003 | 1,186 | ||
| Morocco | 1,005 | 1,201 | +19.5% | 2.0% |
| Immigrants | 523 | 625 | ||
| Born in France | 482 | 576 | ||
| Tunisia | 417 | 458 | +9.8% | 0.8% |
| Immigrants | 202 | 222 | ||
| Born in France | 215 | 236 | ||
| Total Maghreb | 2,999 | 3,524 | +17.5% | 5.8% |
| Immigrants | 1 299 | 1 526 | 2.5% | |
| Born in France | 1 700 | 1 998 | 3.3% | |
In 2005, the percentage of young people under 18 of Maghrebi origin (at least one immigrant parent) was about 7% in Metropolitan France, 12% in Greater Paris and above 20% in French département of Seine-Saint-Denis.[103][104]
| 2005 | Seine-Saint-Denis | Val-de-Marne | Val-d'Oise | Lyon | Paris | France |
|---|---|---|---|---|---|---|
| Total Maghreb | 22.0% | 13.2% | 13.0% | 13.0% | 12.1% | 6.9% |
According to other sources, between 5 and 6 million people of Maghrebin origin live in France corresponding to about 7–9% of the total French metropolitan population.[105]
Immigration policy
As mentioned above, the French Ministry of Immigration, Integration, National Identity and Codevelopment was created immediately following the appointment of Nicolas Sarkozy as president of France in 2007. Immigration has been a relevant political dimension in France's agenda in recent years. Sarkozy's agenda has sharpened the focus placed on integration of immigrants living in France as well as their acquisition of national identity. The state of immigration policy in France is fourfold. Its pillars of immigration policy are to regulate migratory flows in and out of France, facilitate immigrants' integration and promote French identity, honor the French tradition's principle of welcoming political asylum and promote solidarity within the immigrant population (principle of co-development).[106] In its 2010 Budget report, the Ministry of Immigration declared it would fund €600 million for its immigration policy objectives, a figure representing 60 million more than in 2009 (otherwise an 11.5% increase from 2009 figures).[90]
In July 2006, President Sarkozy put into effect a law on immigration based upon the notion of "chosen immigration",[107] which allows immigration into France to a restricted field of employment sectors, notably the hotel and restaurant industries, construction and seasonal employment. The following summer of 2007, Sarkozy amended the law to require the acquisition of the French language as a pre-condition. According to Christophe Bertossi, immigration expert in France's Institut français des relations internationales (IFRI), "there is a dominant trend in the French policy to stem family migration, notably conditioned after the 2007 law by a minimum level of French language tested and by the demonstration that he/she endorses the main French constitutional principles".[108]
France, along with other EU countries, have still not signed their agreement to the United Nations Convention on the Protection of the Rights of All Migrant Workers and Members of Their Families of 1990.[109] This Convention is a treaty to protect migrant workers' rights, in recognition of their human rights.
Alternative policies have been discussed in formulating immigration policy, such as a quota system. At the beginning of 2008, as the government was rethinking its orientation on immigration policy with the creation of the new ministry, the idea of a quota system was introduced as a possible alternative. In early 2008, a proposal was made to Parliament to decide each year how many immigrants to accept, based on skill and origin. However, this quota policy contradicts the French Constitution. A commission was formed in February 2008 to study how the Constitution could be changed to allow for a quota system. The main difficulty is the origin principle of establishing a quota "constituting a breach in the universalistic ideology of the French Republic".[64]
On 18 January 2008, the government published a list of 150 job titles that were encountering difficult supply of labour.[110] Most immigrants living in France today are reported to cover the following sectors: agriculture, service to persons in need (childcare, the elderly), construction, education, health and services to businesses.[111] Thus, the government is seeking to match immigrants with the economic makeup of France. The current administration could also seek to integrate migrants and their families through education and training, making them more competitive in the job market. To tackle critical labour shortages, France also decided to participate in the EU Blue Card.
Therefore, the outlook towards immigrants in France is shifting as unemployment continues to dominate the political agenda, along with political incentives to strengthen French national identity. Recent incidents, such as the 2005 civil unrest and Romani repatriation have shed light on France's immigration policies and how these are viewed globally, especially in congruence or discontinuity with the EU. A longitudinal study has been conducted since March 2010 to provide qualitative research regarding the integration of new immigrants.[112] The report is being finalized at the end of December 2010 and will be most relevant to provide insight into further immigration policy analysis for the French government.
Languages
French is the only official language of France, and is constitutionally required to be the language of government and administration. There is a rising cultural awareness of the regional languages of France, which enjoy no official status. These regional languages include the Langue d'oïl, Langue d'oc, Romance languages other than French, Basque, Breton and Germanic languages. Immigrant groups from former French colonies and elsewhere have also brought their own languages.
Religion
France has not collected religious or ethnic data in its censuses since the beginning of the Third Republic, but the country's predominant faith has been Roman Catholicism since the early Middle Ages. Church attendance is fairly low, however, and the proportion of the population that is not religious has grown over the past century. A 2004 IFOP survey tallied that 44% of the French people did not believe in God; contrasted to 20% in 1947.[113] A study by the CSA Institute conducted in 2003 with a sample of 18,000 people found that 65.3% considered themselves Roman Catholic, while 27% considered themselves atheists, and 12.7% (8,065,000 people) belonged to a religion other than Catholicism.
In the early 21st century there were an estimated 5 million Muslims in France,[114] one million Protestants, 600,000 Buddhists, 491,000 Jews,[115] and 150,000 Orthodox Christians. The US State Department's International Religious Freedom Report 2004 .[116] estimated the French Hindu population at 181,312. These studies did not ask the respondents if they were practicing or how often they did practice if they were active in the laity.
According to a poll conducted in 2001 for French Catholic magazine La Croix, 69% of respondents were Roman Catholic (only 10% being listed as regular churchgoers), 22% agnostic or atheist, 2% Protestant (Calvinist, Lutheran, Anglican and Evangelical), and 7% belonged to other religions.[117]
According to a 2015 estimate of CIA World Factbook the numbers are: Christian (overwhelmingly Roman Catholic) 63-66%, Muslim 7-9%, Jewish 0.5-0.75%, Buddhist 0.5-0.75%, other 0.5-1.0%, none 23-28%.[118]
Genetics
France has been influenced by the different human migrations that occurred throughout Europe over time. Prehistoric and Neolithic population movements could have influenced the genetic diversity of this country. A recent study in 2009 analysed 555 French individuals from 7 different regions in mainland France and found the following Y-DNA Haplogroups. The five main haplogroups are R1 (63.41%), E (11.41%), I (8.88%), J (7.97%) and G (5.16%). R1b (particularly R1b1b2) was found to be the most dominant Y chromosomal lineage in France, covering about 60% of the Y chromosomal lineages. The high frequency of this haplogroup is typical in all West European populations. Haplogroups I and G are also characteristic markers for many different West European populations. Haplogroups J and E1b1b (M35, M78, M81 and M34) consist of lineages with differential distribution within Middle East, North Africa and Europe. Only adults with French surnames were analyzed by the study.[119][120]
According to a 2008 study by Dutch geneticist Manfred Kayser, French people based on a sample from Lyon, showed genetic similarities to all Europeans especially the Swiss, Germans, Austrians, Italians, and Spaniards.
| Region | Nb | BD | E* | E-M35* | E-M78 | E-M81 | E-M34 | G | I | J1 | J2 | K | N1c | P* | R1a | R1b1 | T |
|---|---|---|---|---|---|---|---|---|---|---|---|---|---|---|---|---|---|
| 1 Alsace | 80 | 0 | 0 | 0 | 6.25 | 0 | 3.75 | 2.50 | 8.75 | 1.25 | 8.75 | 1.25 | 0 | 0 | 3.75 | 58.75 | 5 |
| 2 Auvergne | 89 | 0 | 2.25 | 0 | 3.37 | 5.62 | 1.12 | 8.99 | 4.49 | 3.37 | 7.87 | 1.12 | 0 | 0 | 5.62 | 52.80 | 3.37 |
| 3 Brittany | 115 | 0 | 0 | 0 | 0 | 0 | 0 | 1.74 | 13.04 | 0.87 | 2.61 | 0 | 0 | 0 | 0.87 | 80.88 | 0 |
| 4 Île-de-France | 91 | 0 | 10.99 | 0 | 4.40 | 5.49 | 1.10 | 4.40 | 7.69 | 1.10 | 5.49 | 0 | 1.10 | 0 | 2.20 | 56.05 | 0 |
| 5 Midi-Pyrénées | 67 | 0 | 1.49 | 1.49 | 2.99 | 1.49 | 1.49 | 4.48 | 10.45 | 4.48 | 7.46 | 0 | 0 | 0 | 2.99 | 59.69 | 1.49 |
| 6 Nord-Pas-de-Calais | 68 | 0 | 1.47 | 1.47 | 5.88 | 4.41 | 0 | 7.35 | 8.82 | 0 | 5.88 | 0 | 0 | 0 | 2.94 | 61.76 | 0 |
| 7 Provence-Alpes-Côte d'Azur | 45 | 2.22 | 0 | 2.22 | 8.89 | 2.22 | 0 | 6.67 | 8.89 | 0 | 6.67 | 0 | 0 | 4.44 | 0 | 55.55 | 2.22 |
| Mainland France | 555 | 0.32 | 2.31 | 0.74 | 4.54 | 2.75 | 1.07 | 5.16 | 8.88 | 1.58 | 6.39 | 0.34 | 0.16 | 0.63 | 2.62 | 60.78 | 1.73 |
According to a genetic study in 2000 based on HLA, French from Marseille "are more or less isolated from the other western European populations. They are in an intermediate position between the North Africans (Algerians from Algiers and Oran; Tunisians) and the western Europeans populations (France, Spain, and Portugal)". According to the authors "these results cannot be attributed to recent events because of the knowledge of the grandparents' origin" in the sample. This study reveals "that the southern French population from Marseilles is related genetically to the southwestern Europeans and North Africans, who are geographically close" and that "a substantial gene flow has thus probably been present among the populations of these neighboring areas".[121]
List of France's aires urbaines (metropolitan areas)
The following is a list of the twenty largest aires urbaines (metropolitan areas) in France, based on their population at the 2011 census. Population at the 2006 census is indicated for comparison.
Between 2006 and 2011, Toulouse, Rennes, Montpellier, Nantes, Bordeaux and Lyon had the fastest-growing metropolitan areas in France..
| Rank (2011) |
Rank (2006) |
Aire urbaine (metropolitan area) |
Population (2011) |
Population (2006) |
Yearly change (2006-2011) |
Land area (km²) |
|---|---|---|---|---|---|---|
| 1 | 1 | Paris [122] | 12,292,895 | 11,956,493 | +0.56% | 17,174 |
| 2 | 2 | Lyon [123] | 2,188,759 | 2,085,107 | +0.98% | 6,019 |
| 3 | 3 | Marseille - Aix-en-Provence[124] | 1,720,941 | 1,692,459 | +0.33% | 3,174 |
| 4 | 4 | Toulouse [125] | 1,250,251 | 1,169,865 | +1.34% | 5,381 |
| 5 | 5 | Lille (French part) [126] | 1,159,547 | 1,152,507 | +0.12% | 926 |
| 6 | 6 | Bordeaux [127] | 1,140,668 | 1,086,106 | +0.99% | 5,613 |
| 7 | 7 | Nice [128] | 1,003,947 | 995,968 | +0.16% | 2,585 |
| 8 | 8 | Nantes [129] | 884,275 | 841,404 | +1.00% | 3,302 |
| 9 | 9 | Strasbourg (French part) [130] | 764,013 | 749,766 | +0.38% | 2,198 |
| 10 | 12 | Rennes [131] | 679,866 | 637,673 | +1.29% | 3,747 |
| 11 | 10 | Grenoble [132] | 675,122 | 659,459 | +0.47% | 2,621 |
| 12 | 11 | Rouen [133] | 655,013 | 643,499 | +0.36% | 2,367 |
| 13 | 13 | Toulon [134] | 606,987 | 598,514 | +0.28% | 1,196 |
| 14 | 15 | Montpellier [135] | 561,326 | 529,401 | +1.18% | 1,673 |
| 15 | 14 | Douai - Lens [136] | 542,946 | 545,636 | −0.10% | 679 |
| 16 | 17 | Avignon [137] | 515,123 | 501,866 | +0.52% | 2,083 |
| 17 | 16 | Saint-Étienne [138] | 508,548 | 508,284 | +0.01% | 1,689 |
| 18 | 18 | Tours [139] | 480,378 | 469,244 | +0.47% | 3,184 |
| 19 | 19 | Clermont-Ferrand [140] | 467,178 | 454,553 | +0.55% | 2,420 |
| 20 | 20 | Nancy [141] | 434,565 | 432,481 | +0.10% | 2,367 |
See also
- French people – officially a nationality, also discusses overseas French descendants.
- List of French people of immigrant origin
- List of French people
- Racism in France
- List of fifteen largest French metropolitan areas by population
- INSEE code
- Pied-noirs, the name for French settlers in Algeria
- Caldoches
- Population of Paris
- Jews in France
- French immigration to Puerto Rico
- French Portuguese
- French Canadian
- French American
- Franco-Mauritian
- Roma in France
References
- 1 2 3 INSEE. "Fécondité totale, fécondité selon le groupe d'âges de la mère et âge moyen des mères à l'accouchement" (in French). Retrieved 2013-11-12.
- ↑ CSO. "Vital Statistics - Fourth Quarter and Yearly Summary 2012" (PDF). p. 36. Retrieved 2013-11-12.
- 1 2 3 4 5 6 7 8 9 http://www.sudouest.fr/2014/11/28/qui-sont-les-nouveaux-immigres-qui-vivent-en-france-1751452-705.php
- ↑ Insee – Topics
- 1 2 3 4 Naissances selon le pays de naissance des parents 2010, Insee, septembre 2011
- ↑ Two foreign-born parents do not automatically grant French citizenship.
- 1 2 Births by country of birth of the parents for Metropolitan France (TableT37quater)
- 1 2 Les immigrés, les descendants d'immigrés et leurs enfants, Pascale Breuil-Genier, Catherine Borrel, Bertrand Lhommeau, Insee 2011
- ↑ Bleich, Erik. "Race Policy in France". Brookings Institution. Retrieved 23 July 2016.
- 1 2 Jackson, Julian (2001). France: The Dark Years, 1940-1944. Oxford University Press. pp. 31–33, 103–104. ISBN 0-19-820706-9.
- ↑ Gunther, John (1936). Inside Europe. Harper & Brothers. p. 119.
- ↑ Leslie King, "'France needs children'" Sociological Quarterly (1998) 39#1 pp: 33-52.
- ↑ Marie-Monique Huss, "Pronatalism in the inter-war period in France." Journal of Contemporary History (1990) 25#1 pp: 39-68.in JSTOR
- ↑ Colin L. Dyer, Population and Society in 20th Century France (1978)
- ↑ "France has a baby boom". International Herald Tribune. 2005. Retrieved 15 December 2007.
- ↑ Doughty, Steve (12 March 2009). "UK to have Europe's biggest population: Migration will force us ahead of Germany, says UN". Daily Mail. London.
- ↑ According to the table File:Turkey-demography.png
- ↑
- ↑
- ↑ "Bulletin Statistique - Demography". National Institute of Statistics and Economic Studies. INSEE. Retrieved 1 December 2016.
- ↑ INSEE, Government of France. "Tableau complémentaire 2 : Taux de fécondité par groupe d'âges" (in French). Retrieved 19 January 2011.
- ↑ INSEE, Government of France. "Bilan démographique 2008" (in French). Retrieved 13 January 2009.
- ↑ INED – Population et Société – La fécondité des immigrées, nouvelles données, nouvelle approche (avril 2004)
- ↑ Births by citizenship of the parents for Metropolitan France (TableT37bis)
- ↑ Part des populations étrangères et immigrées en 2013
- ↑ Yazid Sabeg et Laurence Méhaignerie, Les oubliés de l'égalité des chances, Institut Montaigne, January 2004
- ↑ Falko Baumgartner: The Africanization of France...as of 2014 Council of European Canadians, 20 October 2014.
- ↑ Éric Gailledrat, Les Ibères de l'Èbre à l'Hérault (VIe-IVe s. avant J.-C.), Lattes, Sociétés de la Protohistoire et de l'Antiquité en France Méditerranéenne, Monographies d'Archéologie Méditerranéenne – 1, 1997
- ↑ Dominique Garcia: Entre Ibères et Ligures. Lodévois et moyenne vallée de l'Hérault protohistoriques. Paris, CNRS éd., 1993; Les Ibères dans le midi de la France. L'Archéologue, n°32, 1997, pp. 38–40
- ↑ History Of France
- ↑ "Les Gaulois figurent seulement parmi d'autres dans la multitude de couches de peuplement fort divers (Ligures, Ibères, Latins, Francs et Alamans, Nordiques, Sarrasins...) qui aboutissent à la population du pays à un moment donné ", Jean-Louis Brunaux, Nos ancêtres les Gaulois, éd. Seuil, 2008, p. 261
- ↑ "Notre Midi a sa pinte de sang sarrasin", Fernand Braudel, L'identité de la France – Les Hommes et les Choses (1986), Flammarion, 1990, p. 215
- ↑ "Les premiers musulmans arrivèrent en France à la suite de l'occupation de l'Espagne par les Maures, il y a plus d'un millénaire, et s'installèrent dans les environs de Toulouse – et jusqu'en Bourgogne. À Narbonne, les traces d'une mosquée datant du VIIIe siècle sont le témoignage de l'ancienneté de ce passé. Lors de la célèbre, et en partie mythologique, bataille de Poitiers en 732, dont les historiens reconsidèrent aujourd'hui l'importance, Charles Martel aurait stoppé la progression des envahisseurs arabes. Des réfugiés musulmans qui fuyaient la Reconquista espagnole, et plus tard l'Inquisition, firent souche en Languedoc-Roussillon et dans le Pays basque français, ainsi que dans le Béarn", Justin Vaïsse, Intégrer l'Islam, Odile Jacob, 2007, pp. 32–33
- ↑ " Les Sarrasins gardèrent longtemps sur les côtes de la Provence, à la Garde-Freinet, un solide point d'appui et de là purent faire des incursions dans une partie de la France. Au huitième siècle, lors de l'invasion des Berbères dit Arabes, ceux-ci avaient pénétré jusque dans la vallée de la Loire : on parle même de leur venue dans la région orientale de la France, à Luxeuil, dans les Vosges et devant Metz. [...] les observations des anthropologistes ne permettent pas de douter que nombre de familles françaises dans les bassins de la Garonne et du Rhône ne soient issus des envahisseurs musulmans, Berbères modifiés par leur croisement avec les Espagnols, les Arabes et les noirs d'Afrique.", Élisée Reclus, Nouvelle géographie universelle: la terre et les hommes, Élisée Reclus, éd. Hachette, 1881, t. 2, chap. 1-Vue d'ensemble – Le milieu et la race, Ançêtres de Français, p. 45-46
- ↑ "L'élément sémitique, juif et arabe, était fort en Languedoc. Narbonne avait été longtemps la capitale des Sarrasins en France. (...) Ces nobles du Midi étaient des gens d'esprit qui savaient bien la plupart que penser de leur noblesse. Il n'y en avait guère qui, en remontant un peu, ne rencontrassent dans leur généalogie quelque grand-mère sarrasine ou juive.", Jules Michelet, Histoire de France, éd. Chamerot, 1861, t. 2, p. 335
- ↑ "Bien que le séjour des Arabes en France n'ait été constitué que par une série de courtes invasions, ils ont laissé des traces profondes de leur passage dans la langue, et [...] ils en ont laissé également dans le sang. [...] L'ethnologie nous en fournit la preuve, en retrouvant, après tant de siècles, des descendants des Arabes sur plusieurs parties de notre sol. Dans le département de la Creuse, dans les Hautes-Alpes, et notamment dans plusieurs localités situées autour de Montmaure (montagne des Maures), dans le canton de Baignes (Charente), de même que dans certains villages des Landes, du Roussillon, du Languedoc, du Béarn, les descendants des Arabes sont facilement reconnaissables.", Gustave Le Bon, La Civilisation des Arabes (1884), La Fontaine au Roy, 1990, p. 237
- ↑ "Il est certain que, de nos jours, on peut encore trouver en France des descendants des Sarrasins, notamment dans toute la région du sud de la Loire, dans les monts d'Auvergne, en Guyenne, en Languedoc et en Provence, voire même en Bourgogne.", René Martial, La Race française (1934), Mercure de France, 1934, p. 101-102
- ↑ The normans Jersey heritage trust
- ↑ Dudo of St. Quentin's Gesta Normannorum, English translation How normans conquered the future Normandy, got established and allied with western Frankish by inter-marriage with Kings Rollo and William
- 1 2 Oppenheimer, David B. (2008). "Why France needs to collect data on racial identity...in a French way". Hastings International and Comparative Law Review. 31 (2): 735–752. SSRN 1236362
 .
. - ↑ Louis-Georges, Tin (2008). "Who is afraid of Blacks in France? The Black question: The name taboo, the number taboo". French Politics, Culture & Society. 26 (1): 32–44. doi:10.3167/fpcs.2008.260103.
- ↑ "Black residents of France say they are discriminated against". International Herald Tribune. 31 January 2007. Retrieved 27 October 2009.
- ↑ "France's ethnic minorities: To count or not to count". The Economist. 390 (8624): 62. 28 March 2009.
- ↑ Chrisafis, Angelique (24 February 2007). "French presidential candidates divided over race census". The Guardian. London. p. 25. Retrieved 27 October 2009.
- ↑ How does France count its Muslim population?, Le Figaro, April 2011
- ↑ The Cambridge survey of world migration – Google Books
- ↑ "Les personnes d'origine maghrébine y sont également au nombre de 5 à 6 millions ; 3,5 millions ont la nationalité française (dont 500 000 harkis)", Robert Castel, La discrimination négative, Paris, La République des idées/Seuil, 2007
- ↑ L'Express. "Face à l'islam de France, du déni à la paralysie". Retrieved 2014-12-29.
- ↑ Zaman France. "La communauté turque compte 611.515 personnes en France". Retrieved 2014-12-29.
- ↑ France's crisis of national identity, The Independent, Wednesday, 25 November 2009
- ↑ Les personnes originaires d'Afrique, des Dom-Tom et de la Turquie sont 5,5 millions dans l'Hexagone, Afrik.com, 12 February 2009
- 1 2 Être né en France d'un parent immigré, Insee Première, n°1287, mars 2010, Catherine Borrel et Bertrand Lhommeau, Insee
- 1 2 3 Répartition des immigrés par pays de naissance 2008, Insee, October 2011
- ↑ Qui sont les nouveaux immigrés qui vivent en France, Ined, 2011
- ↑ Hargreaves, Alec G., Multi-Ethnic France, Routledge, New York, New York, 2007, 265 pages, pages 16–17
- ↑ https://books.google.se/books?id=YbzsBPuhyggC&pg=PA143&lpg=PA143&dq=immigration+france+1920s+poles+italians&source=bl&ots=LiPeX7qITb&sig=FfrLWa0zMFTdQuN82SBsCgU9LH0&hl=en&sa=X&ved=0ahUKEwj0pe6h057OAhVIIcAKHTI8DnkQ6AEIGzAA#v=onepage&q=immigration%20france%201920s%20poles%20italians&f=false
- ↑ Spanish Civil War fighters look back, BBC News, 23 February 2003
- ↑ Enzo Barnabà, Le sang des marais, Marseille, 1993
- ↑ On French immigrants, the words left unsaid
- ↑ For Pieds-Noirs, the Anger Endures
- ↑ Esther Benbassa, The Jews of France: A History from Antiquity to the Present, Princeton University Press, 1999
- ↑ RFI – Immigration – Combien d'immigrés clandestins en France?
- ↑ Freedman, Jane, Immigration and Insecurity in France, Ashgate Publishing Limited, Hants, England, 2004, 182 p., page 42
- 1 2 Bertossi, Christophe, France: the state strives to shape "chosen immigration", IFRI, Paris, July 2008
- ↑ http://ifri.org/?page=detail-contribution&id=5235&id_provenance=103&provenance_context_id=12 page 1
- ↑ Smith, Craig S. Face behind Paris 'bistro' counter becomes Asian. International Herald Tribune, 10 May 2005.
- ↑ Unrest in France, November 2005: immigration, islam and the challenge of integration, Justin Vaïsse, Presentation to Congressional Staff, 10 and 12 January 2006, Washington, DC
- ↑ "Compared with the Europeans, the Tunisians belong to a much more recent wave of migration and occupy a much less favourable socioeconomic position, yet their pattern of marriage behaviour is nonetheless similar.... Algerian and Moroccan immigrants have a higher propensity to exogamy than Asians or Portuguese but a much weaker labour market position.... Confirming the results from other analyses of immigrant assimilation in France, this study shows that North Africans seem to be characterized by a high degree of cultural integration (reflected in a relatively high propensity to exogamy, notably for Tunisians) that contrasts with a persistent disadvantage in the labour market".Intermarriage and assimilation: disparities in levels of exogamy among immigrants in France, Mirna Safi, Volume 63 2008/2
- ↑ Emmanuel Todd, Le destin des immigrés: assimilation et ségrégation dans les démocraties occidentales, Paris, 1994, p.307
- ↑ Many famous French people, including Edith Piaf, Zinedine Zidane, Isabelle Adjani, Alain Bashung, Claude Zidi, Arnaud Montebourg, Catherine Belkhodja, Jacques Villeret and Dany Boon, are partly of Algerian descent.
- ↑ Smith, Craig S. (5 November 2005). "Immigrant Rioting Flares in France for Ninth Night". The New York Times.
- ↑ "French unions claim 3m on street". BBC News. 19 March 2009.
- ↑ Intégration et identité nationale – Immigration.gouv.fr
- 1 2 http://www.20minutos.es/noticia/2309684/0/inmigrantes-espanoles/en-francia-duplicado/con-la-crisis
- 1 2 3 4 http://hispantv.com/detail.aspx?id=298807
- ↑ Enquête sur la diversité des populations en France, Insee 2011
- ↑ Fiches thématiques – Population immigrée – Immigrés – Insee Références – Édition 2012, Insee 2012
- ↑ INSEE
- ↑ Michèle Tribalat's 2004 study for the INED
- ↑ Valdman, Albert (May 2000). "La Langue des faubourgs et des banlieues: de l'argot au français populaire". The French Review. American Association of Teachers of French. 73 (6): 1188. JSTOR 399371.
- ↑ "Immigration is hardly a recent development in French history, as Gérard Noiriel amply demonstrates in his history of French immigration, The French Melting Pot. Noiriel estimates that one third of the population currently living in France is of "foreign" descent", Marie-Christine Weidmann-Koop, France at the dawn of the twenty-first century, trends and transformations, Summa Publications, Inc., 2000, p.160
- ↑ Inflow of third-country nationals by country of nationality
- ↑ Immigration and the 2007 French Presidential Elections
- ↑ Accueil - Immigration, asile, accueil et accompagnement des étrangers en France - Ministère de l'Intérieur
- ↑ CIA – The World Factbook
- ↑ Schain, Martin A., The politics of immigration in France, Britain, and the United States, a comparative study, Palgrave Macmillan, New York, New York, 2008, 329 pages, page 9
- ↑ Les crispations alarmantes de la société française
- ↑ Insee – Population – Natalité et fécondité au sein de l'Union européenne
- ↑ Insee – Travail-Emploi – Nombre de chômeurs et taux de chômage des immigrés et des non-immigrés selon le sexe et l'âge
- 1 2 European Web Site on Integration
- ↑ UK Office for National Statistics estimate
- ↑ INSEE pdf estimates
- ↑ Insee – Population – Évolution de la natalité et de la fécondité
- ↑ Embassy of the United States, Paris
- ↑ http://www.asiapacific.ca/sites/default/files/canadians_abroad_final.pdf
- ↑ http://www.brasileirosnomundo.itamaraty.gov.br/a-comunidade/estimativas-populacionais-das-comunidades/APENDICE%20Diplomacia%20Consular%20-%20Brasileiros%20no%20Mundo.pdf
- ↑ http://www.ultimasnoticias.com.ve/infografias/venezolanos-en-el-exterior.aspx
- ↑ http://www.inei.gob.pe/
- ↑ http://www.iom.int/files/live/sites/iom/files/pbn/docs/Perfil-Migratorio-de-argentina-2012.pdf
- ↑ http://www.aerchipro.com/pdf/48_Registro_de_Chilenos_en_el_Exterior_2003-2004.pdf
- ↑ Michèle Tribalat , " Mariages " mixtes " et immigration en France ", Espace populations sociétés [En ligne], 2009/2 | 2009, mis en ligne le 01 avril 2011
- ↑ Carolyn Burke. No Regrets: The Life of Edith Piaf, Bloomsbury Publishing, 2011, p.5
- ↑ Michèle Tribalat, Revue Commentaire, juin 2009, n°127
- ↑ Michèle Tribalat, Les yeux grands fermés, Denoël, 2010
- ↑ Robert Castel, La discrimination négative, Paris, La République des idées/Seuil, 2007
- ↑ Ministère de l'intérieur, de l'outre-mer, des collectivités territoriales et de l'immigration
- ↑ Immigration – Immigration.gouv.fr
- ↑ IFRI – E-note – Notes de l'Ifri – France: the State strives to shape "chosen" immigration – Institut français des relations internationales
- ↑ International Migration Convention | United Nations Educational, Scientific and Cultural Organization
- ↑ Immigration – Immigration.gouv.fr
- ↑ Infos Migrations, Number 14, February 2010
- ↑ Ressources – Immigration.gouv.fr
- ↑ http://www.ifop.com/europe/sondages/opinionf/croyances.asp
- ↑ In 2003, the French Ministry of the Interior estimated the total number of Muslims as 5–6 million whereas the "Front National" spoke about 8 million, in Jonathan Laurence and Justin Vaïsse,Intégrer l'Islam, Odile Jacob, 2007
- ↑ The Jewish Population of the World
- ↑ International Religious Freedom
- ↑ "Catholicisme et protestantisme en France: Analyses sociologiques et données de l'Institut CSA pour La Croix" (PDF). Institut CSA & La Croix. 2001-12-24.
- ↑ CIA World Factbook – France
- ↑ Ramos-Luisa et al. (2009), "Phylogeography of French male lineages (supplemental data from 23rd International ISFG Congress held from September 14 to 18, 2009 in Puerto Madero, Buenos Aires)", Forensic Science International 2: 439–441, doi:10.1016/j.fsigss.2009.09.026
- ↑ "Sample collection was performed drawing blood of unrelated male individuals with French surname after informed consent", Ramos-Luisa et al. (2009)
- ↑ Gibert M, Reviron D, Mercier P, Chiaroni J, Boetsch G. HLA-DRB1 and DQB1 polymorphisms in southern France and genetic relationships with other Mediterranean populations, Hum Immunol. 2000 Sep;61(9):930-6.
- ↑ Paris
- ↑ Lyon
- ↑ Marseille-Aix-en-Provence
- ↑ Toulouse
- ↑ Lille
- ↑ Bordeaux
- ↑ Nice
- ↑ Nantes
- ↑ Strasbourg
- ↑ Rennes
- ↑ Grenoble
- ↑ Rouen
- ↑ Toulon
- ↑ Montpellier
- ↑ Douai-Lens
- ↑ Avignon
- ↑ Saint-Étienne
- ↑ Tours
- ↑ Clermont-Ferrand
- ↑ Nancy
Further reading
- Diebolt, Claude, and Perrin Faustine. Understanding Demographic Transitions. An Overview of French Historical Statistics (Springer, 2016) 176 pages. table of contents
- Dyer, Colin L. Population and Society in 20th Century France (1978)
- Henry, Louis. "The population of France in the eighteenth century." in Population in History (1965). pp 441+
- Spengler, Joseph J. France Faces Depopulation (1938)
- Van de Walle, Etienne. The female population of France in the nineteenth century: a reconstruction of 82 départements (Princeton University Press, 1974)
External links
- Inflow of third-country nationals by country of nationality, by year
- (French) Audio book (mp3) – Introduction and first chapter of Éric Maurin's book Le ghetto français, enquête sur le séparatisme social
- (French) Population of French communes with more than 2,000 inhabitants
- (French) Une question de la seconde génération en France – Le rôle de l'école dans la formation d'une identité minoritaire, par Patrick Simon
- France opens first museum dedicated to the history of immigration – Networkeurope.org
- Population cartogram of France
- Immigration expert Mr. Patrick Weil, has written extensively on the topic and is a well-respected intellectual voice in France.
- French immigration motives in numbers, INSEE
- Ministerial webpage
- Population statistics, INSEE webpage
- Organization for Economic Cooperation and Development Migration office
- Official migration reports, immigration.gouv.fr
- Expatriates in France, linkexpats.com