Demographics of the Republic of Macedonia
This article is about the demographic features of the population of Republic of Macedonia, including population density, ethnicity, education level, health of the populous, economic status, religious affiliations and other aspects of the population.
| Demographics of Macedonia | |
|---|---|
|
Data of FAO, year 2005 ; Number of inhabitants in thousands. | |
| Population |
|
| Growth rate |
|
| Birth rate |
|
| Death rate |
|
| Life expectancy |
|
| • male |
|
| • female |
|
| Fertility rate |
|
| Infant mortality rate |
|
| Net migration rate |
|
| Age structure | |
| 0–14 years |
|
| 15–64 years |
|
| 65 and over |
|
| Sex ratio | |
| At birth | 1.08 male(s)/female (2012) |
| Under 15 | 1.08 male(s)/female (2004 est.) |
| 15–64 years | 1.02 male(s)/female (2004 est.) |
| 65 and over | 0.78 male(s)/female (2004 est.) |
| Nationality | |
| Nationality | noun: Macedonian(s) adjective: Macedonian |
| Major ethnic |
Macedonians |
| Minor ethnic |
Albanians |
| Language | |
| Official | Macedonian |
| Spoken | Macedonian, Albanian, Turkish, Serbian, Bosnian, Aromanian |
Part of a series on the |
|---|
| History of the Republic of Macedonia |
 |
| Chronological |
|
| Topical |
| Related |
|
|
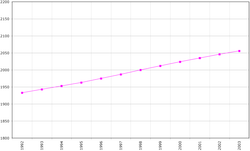
Total population
European statistics, estimates from health insurance funds and no census in sight
According to statistics from the European Union, the actual population has been reduced by at least 230.000 people who emigrated into European Union member states between 1998 and 2011.[2] Further Albanian news sources estimated at October 2012 that the real population is closer to the sum of 1.744.237 people who are accounted within all of the health funds of the country.[3][4] According to Bozhidar Dimitrov, the Bulgarian authorities have granted 87.000 to many of those emigrants a Bulgarian passport, as of 2012, because they declared to be ethnic Bulgarians.[5][6] Since Bulgarias' entry in the European Union, and under pressure from fellow European Union members, Bulgaria imposed more stringent rules for the acquisition of a Bulgarian passport. The provisions of the Ohrid agreement to elevate any minority language if the minority in question is above 20% of the population of any municipality into a co-official language for that municipality[7] has created friction within the government, and between officials of different political and ethnic interests, resulting to the indefinite postponement of the census which started at 2011. Since no funds have been allocated for a census in the state budget of 2014, there is no expectation for a census before 2015.[8]
Vital statistics[9][10]
| Average population (x 1000) | Live births | Deaths | Natural change | Crude birth rate (per 1000) | Crude death rate (per 1000) | Natural change (per 1000) | Fertility rates | |
|---|---|---|---|---|---|---|---|---|
| 1947 | 1 134 | 40 000 | 17 400 | 22 600 | 35.3 | 15.3 | 19.9 | |
| 1948 | 1 162 | 42 900 | 18 600 | 24 300 | 36.9 | 16.0 | 20.9 | |
| 1949 | 1 192 | 46 400 | 18 900 | 27 500 | 38.9 | 15.9 | 23.1 | |
| 1950 | 1 230 | 49 560 | 18 023 | 31 537 | 40.3 | 14.7 | 25.6 | |
| 1951 | 1 267 | 45 329 | 20 747 | 24 582 | 35.8 | 16.4 | 19.4 | |
| 1952 | 1 298 | 51 054 | 17 978 | 33 076 | 39.3 | 13.9 | 25.5 | |
| 1953 | 1 322 | 49 665 | 19 312 | 30 353 | 37.6 | 14.6 | 23.0 | |
| 1954 | 1 341 | 50 984 | 16 722 | 34 262 | 38.0 | 12.5 | 25.5 | |
| 1955 | 1 354 | 49 093 | 17 919 | 31 174 | 36.3 | 13.2 | 23.0 | |
| 1956 | 1 363 | 47 486 | 15 386 | 32 100 | 34.8 | 11.3 | 23.6 | |
| 1957 | 1 370 | 46 107 | 17 341 | 28 766 | 33.7 | 12.7 | 21.0 | |
| 1958 | 1 375 | 44 619 | 13 917 | 30 702 | 32.5 | 10.1 | 22.3 | |
| 1959 | 1 382 | 44 638 | 14 998 | 29 640 | 32.3 | 10.9 | 21.4 | |
| 1960 | 1 392 | 44 059 | 14 007 | 30 052 | 31.7 | 10.1 | 21.6 | 4.11 |
| 1961 | 1 405 | 42 182 | 13 141 | 29 041 | 30.0 | 9.4 | 20.7 | 3.86 |
| 1962 | 1 423 | 40 615 | 16 155 | 24 460 | 28.5 | 11.4 | 17.2 | 3.68 |
| 1963 | 1 442 | 41 284 | 13 229 | 28 055 | 28.6 | 9.2 | 19.5 | 3.71 |
| 1964 | 1 462 | 42 897 | 13 286 | 29 611 | 29.3 | 9.1 | 20.3 | 3.81 |
| 1965 | 1 481 | 42 433 | 12 758 | 29 675 | 28.7 | 8.6 | 20.0 | 3.73 |
| 1966 | 1 499 | 41 434 | 12 307 | 29 127 | 27.6 | 8.2 | 19.4 | 3.60 |
| 1967 | 1 516 | 40 763 | 12 523 | 28 240 | 26.9 | 8.3 | 18.6 | 3.49 |
| 1968 | 1 532 | 40 123 | 12 461 | 27 662 | 26.2 | 8.1 | 18.1 | 3.38 |
| 1969 | 1 550 | 40 342 | 13 112 | 27 230 | 26.0 | 8.5 | 17.6 | 3.33 |
| 1970 | 1 568 | 37 862 | 12 430 | 25 432 | 24.1 | 7.9 | 16.2 | 3.09 |
| 1971 | 1 587 | 37 904 | 12 447 | 25 457 | 23.9 | 7.8 | 16.0 | 3.02 |
| 1972 | 1 608 | 38 187 | 13 096 | 25 091 | 23.7 | 8.1 | 15.6 | 2.96 |
| 1973 | 1 629 | 37 478 | 12 217 | 25 261 | 23.0 | 7.5 | 15.5 | 2.82 |
| 1974 | 1 652 | 38 382 | 12 143 | 26 239 | 23.2 | 7.4 | 15.9 | 2.81 |
| 1975 | 1 676 | 39 579 | 12 629 | 26 950 | 23.6 | 7.5 | 16.1 | 2.87 |
| 1976 | 1 701 | 39 809 | 12 377 | 27 432 | 23.4 | 7.3 | 16.1 | 2.80 |
| 1977 | 1 728 | 38 932 | 12 899 | 26 033 | 22.5 | 7.5 | 15.1 | 2.64 |
| 1978 | 1 754 | 38 790 | 12 577 | 26 213 | 22.1 | 7.2 | 14.9 | 2.58 |
| 1979 | 1 777 | 39 407 | 12 653 | 26 754 | 22.2 | 7.1 | 15.1 | 2.48 |
| 1980 | 1 795 | 39 784 | 13 534 | 26 250 | 22.2 | 7.5 | 14.6 | 2.59 |
| 1981 | 1 806 | 39 488 | 13 378 | 26 110 | 21.9 | 7.4 | 14.5 | 2.67 |
| 1982 | 1 812 | 39 789 | 13 502 | 26 287 | 22.0 | 7.5 | 14.5 | 2.64 |
| 1983 | 1 816 | 39 210 | 14 391 | 24 819 | 21.6 | 7.9 | 13.7 | 2.51 |
| 1984 | 1 820 | 38 861 | 14 066 | 24 795 | 21.4 | 7.7 | 13.6 | 2.47 |
| 1985 | 1 828 | 38 722 | 14 408 | 24 314 | 21.2 | 7.9 | 13.3 | 2.51 |
| 1986 | 1 841 | 38 234 | 14 438 | 23 796 | 20.8 | 7.8 | 12.9 | 2.49 |
| 1987 | 1 857 | 38 572 | 14 644 | 23 928 | 20.8 | 7.9 | 12.9 | 2.45 |
| 1988 | 1 875 | 37 879 | 14 565 | 23 314 | 20.2 | 7.8 | 12.4 | 2.43 |
| 1989 | 1 893 | 35 927 | 14 592 | 21 335 | 19.0 | 7.7 | 11.3 | 2.30 |
| 1990 | 1 909 | 35 401 | 14 643 | 20 758 | 18.5 | 7.7 | 10.9 | 2.20 |
| 1991 | 1 923 | 34 830 | 14 789 | 20 041 | 18.1 | 7.7 | 10.4 | 2.17 |
| 1992 | 1 934 | 33 238 | 16 022 | 17 216 | 17.2 | 8.3 | 8.9 | 2.11 |
| 1993 | 1 944 | 32 374 | 15 591 | 16 783 | 16.7 | 8.0 | 8.6 | 2.15 |
| 1994 | 1 954 | 33 487 | 15 771 | 17 716 | 17.1 | 8.1 | 9.1 | 2.22 |
| 1995 | 1 963 | 29 886 | 16 338 | 13 548 | 16.4 | 8.3 | 8.1 | 2.13 |
| 1996 | 1 974 | 28 946 | 16 063 | 12 883 | 15.9 | 8.1 | 7.8 | 2.06 |
| 1997 | 1 984 | 26 830 | 16 596 | 10 234 | 14.9 | 8.4 | 6.5 | 1.87 |
| 1998 | 1 994 | 26 639 | 16 870 | 9769 | 14.7 | 8.5 | 6.2 | 1.86 |
| 1999 | 2 004 | 24 964 | 16 789 | 8 175 | 13.6 | 8.4 | 5.2 | 1.77 |
| 2000 | 2 012 | 26 168 | 17 253 | 8 915 | 14.6 | 8.6 | 6.0 | 1.81 |
| 2001 | 2 018 | 24 183 | 16 919 | 7 264 | 13.4 | 8.4 | 5.0 | 1.71 |
| 2002 | 2 024 | 24 154 | 17 962 | 6 192 | 13.7 | 8.9 | 4.8 | 1.71 |
| 2003 | 2 028 | 23 596 | 18 006 | 5 590 | 13.3 | 8.9 | 4.4 | 1.68 |
| 2004 | 2 032 | 23 361 | 17 944 | 5 417 | 11.5 | 8.8 | 2.7 | 1.66 |
| 2005 | 2 037 | 22 482 | 18 406 | 4 076 | 11.0 | 9.0 | 2.0 | 1.56 |
| 2006 | 2 040 | 22 585 | 18 630 | 3 955 | 11.1 | 9.1 | 1.9 | 1.57 |
| 2007 | 2 044 | 22 688 | 19 594 | 3 094 | 11.1 | 9.6 | 1.5 | 1.58 |
| 2008 | 2 047 | 22 945 | 18 982 | 3 963 | 11.2 | 9.3 | 1.9 | 1.59 |
| 2009 | 2 051 | 23 684 | 19 060 | 4 624 | 11.5 | 9.3 | 2.3 | 1.61 |
| 2010 | 2 057 | 24 296 | 19 148 | 5 148 | 11.9 | 9.3 | 2.6 | 1.64 |
| 2011 | 2 061 | 22 770 | 19 465 | 3 305 | 11.1 | 9.5 | 1,6 | 1.58 |
| 2012 | 2 062 | 23 568 | 20 134 | 3 434 | 11.4 | 9.8 | 1.7 | 1.61 |
| 2013[11] | 2 064 | 23 138 | 19 208 | 3 930 | 11.2 | 9.3 | 1.9 | 1.60 |
| 2014[12] | 2 068 | 23 674 | 19 682 | 3 992 | 11.4 | 9.5 | 1.9 | 1.62 |
| 2015 | 2 071 | 23 075 | 20 408 | 2 667 | 11.1 | 9.8 | 1.3 | 1.61 |
| 2016 JS | 2 073 | 17 394 | 14 988 | 2 406 | 1,61 |
Current natural increase[13]
- Births from January-September 2015 =
 17,348
 - Births from January-September 2016 =
 17,394
- Deaths from January-September 2015 =
 15,315
 - Deaths from January-September 2016 =
 14,988
- Natural increase from January-September 2015 = 2,033
- Natural increase from January-September 2016 = 2,406
Ethnic groups
The process of industrialization and urbanization after the Second World War that caused the population growth to decrease involved the ethnic Macedonians to a greater extent than Muslims. Rates of increase were very high among rural Muslims: Turks and Torbesh (Macedonian Muslims) had rates 2.5 times those of the Macedonian majority, while Albanians and Roma had rates 3 times as high. This resulted in a significant demographic change as the Albanian population grew from 17% after the Second World War to 25% in the 1990s. This caused an increase in political tension and ultimately, after a brief conflict, forced the country to undertake reforms that decentralized the government. In 1994, Macedonian Slavs had a TFR of 2.07, while the TFR of others were - Albanian (4.10), Turkish (3.55), Roma (4.01), Serb (2.07), Vlachs (1.88) and Others (3.05). The TFR by religions was - Christian (2.17,with 2.20 for Catholics and 2.06 for Orthodox), Islam (4.02) and others (2.16).[14]
However, it is unlikely that this high Muslim TFR has continued since then in Macedonia, as Balkan Muslim fertility elsewhere (Albania, Bosnia, and Kosovo) has dropped sharply toward the European average. A more recent survey[15] pegs Muslim fertility in Macedonia at 1.7, versus 1.3 for non-Muslims.
In 2013, 23,138 children were born in Macedonia. The ethnic affiliation of these newborns was: 11,550 (49.92%) Macedonian; 8,137 (35.17%) Albanian; 1,104 (4.77%) Turkish; 1,554 (6.72%) Roma; 17 (0.07%) Vlach; 120 (0.52%) Serbian; 248 (1.07%) Bosniak; 408 (1.76%) other ethnic affiliation and unknown.[16]
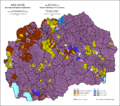 Ethnic structure of Macedonia by settlements 1961.
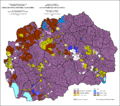 Ethnic structure of Macedonia by settlements 1971.
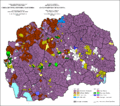 Ethnic structure of Macedonia by settlements 1981.
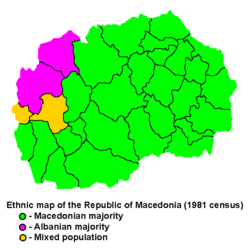 Ethnic map of the Republic of Macedonia, according to the 1981 census
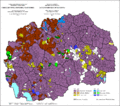 Ethnic structure of Macedonia by settlements 1991.
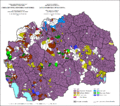 Ethnic structure of Macedonia by settlements 1991.
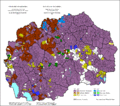 Ethnic structure of Macedonia by settlements 1994.
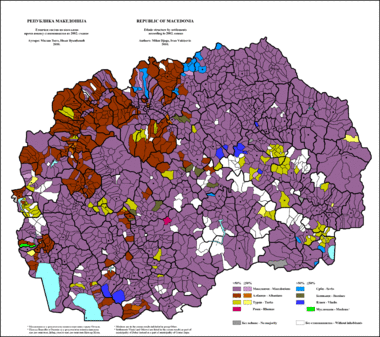 Ethnic structure of Macedonia by settlements 2002.
.png) Ethnic groups in the Republic of Macedonia, according to the 2002 census
Ethnic groups in the Republic of Macedonia, according to the 2002 census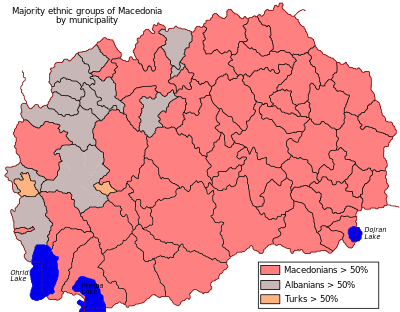 Ethnic groups in the Republic of Macedonia, according to the 2002 census
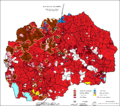 Ethnic groups in the Republic of Macedonia, according to the 2012 census, on municipal level.
| Ethnic group |
census 1948 | census 1953 | census 1961 | census 1971 | census 1981 | census 1991 | census 19941 | census 2002 | ||||||||
|---|---|---|---|---|---|---|---|---|---|---|---|---|---|---|---|---|
| Number | % | Number | % | Number | % | Number | % | Number | % | Number | % | Number | % | Number | % | |
| Macedonians | 789,648 | 68.5 | 860,699 | 66.0 | 1,000,854 | 71.2 | 1,142,375 | 69.3 | 1,281,195 | 67.0 | 1,328,187 | 65.3 | 1,295,964 | 66.6 | 1,297,981 | 64.2 |
| Albanians | 197,389 | 17.1 | 162,524 | 12.5 | 183,108 | 13.0 | 279,871 | 17.0 | 377,726 | 19.8 | 441,987 | 21.7 | 441,104 | 22.7 | 509,083 | 25.2 |
| Turks | 95,940 | 8.3 | 203,938 | 15.6 | 131,481 | 9.4 | 108,552 | 6.6 | 86,691 | 4.5 | 77,080 | 3.8 | 78,019 | 4.0 | 77,959 | 3.9 |
| Romani | 19,500 | 1.7 | 20,462 | 1.6 | 20,606 | 1.5 | 24,505 | 1.5 | 43,223 | 2.3 | 52,103 | 2.6 | 43,707 | 2.2 | 53,879 | 2.7 |
| Serbs | 29,721 | 2.6 | 35,112 | 2.7 | 42,728 | 3.0 | 46,465 | 2.8 | 44,613 | 2.3 | 42,775 | 2.1 | 40,228 | 2.1 | 35,939 | 1.8 |
| Bosniaks | 1,560 | 0.1 | 1,591 | 0.1 | 3,002 | 0.2 | 1,248 | 0.1 | 39,555 | 2.1 | 31,356 | 1.5 | 6,829 | 0.3 | 17,018 | 0.8 |
| Muslims | 15,418 | 0.8 | 2,553 | 0.1 | ||||||||||||
| Aromanians | 9,511 | 0.8 | 8,668 | 0.7 | 8,046 | 0.6 | 7,190 | 0.4 | 6,392 | 0.3 | 7,764 | 0.4 | 8,601 | 0.4 | 9,695 | 0.5 |
| Croats | 2,090 | 0.2 | 2,770 | 0.2 | 3,801 | 0.3 | 3,882 | 0.2 | 3,349 | 0.2 | 2,878 | 0.1 | 2,248 | 0.1 | 2.686 | 0.1 |
| Montenegrins | 2,348 | 0.2 | 2,526 | 0.2 | 3,414 | 0.2 | 3,246 | 0.2 | 3,940 | 0.2 | 3,225 | 0.1 | 2,318 | 0.1 | 2,003 | 0.1 |
| Bulgarians | 889 | 0.1 | 920 | 0.1 | 3,087 | 0.2 | 3,334 | 0.2 | 1,984 | 0.1 | 1,370 | 0.1 | 1,682 | 0.1 | 1.417 | 0.1 |
| Yugoslavs | 1,260 | 0.1 | 3,652 | 0.2 | 14,240 | 0.7 | ||||||||||
| other / unspecified | 4,390 | 0.4 | 5,304 | 0.4 | 4,616 | 0.3 | 22,988 | 1.4 | 6,228 | 0.3 | 45,239 | 2.2 | 9,814 | 0.5 | 14,8872 | 0.7 |
| Total | 1,152,986 | 1,304,514 | 1,406,003 | 1,647,308 | 1,909,136 | 2,033,964 | 1,945,932 | 2,022,547 | ||||||||
| 1 Since 1994 residents who were permanently living abroad were no longer included
2 Ashkali: 3,713 or 0.184%, Greeks: 422 or 0.021%, Russians: 368 or 0.018%, Slovenes: 365 or 0.018%, Poles: 162 or 0.008%, Ukrainians: 136 or 0.007%, Germans: 88 or 0.004%, Czechs: 60 or 0.005%, Slovaks: 60 or 0.005%, Jews: 53 or 0.003%, Italians: 46 or 0.002%, Austrians: 35 or 0.002%, Rusyns: 24 or 0.001%, Regionally affiliated: 829 or 0.041%, Non-declared: 404 or 0.02%, Others: 5332 or 0.264% | ||||||||||||||||
Languages
- Macedonian: 1 344 815 - 66.5%
- Albanian: 507 989 - 25.1%
- Turkish: 71 757 - 3.5%
- Romani: 38 528 - 1.9%
- Serbian: 24 773 - 1.2%
- Bosnian: 8560 - 0.4%
- Aromanian: 6 884 - 0.3%
- other: 19 241 - 1.0%
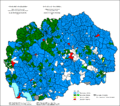
 Linguistic structureв of Macedonia by settlements 2002.
Religions
- Orthodox Christianity (Macedonian Orthodox Church): 1,211,740 or 58.9%[18] (2010)
- Islam: 808,512 or 39.3%[19][20] (2010)
- Catholicism (Macedonian Byzantine Catholic Church): 8,229 or 0.4%[21] (2010)
- other: 28,801 or 1.4% (2010)[22][23]
 Religious structure of Macedonia by settlements 2002.
CIA World Factbook demographic statistics
The following demographic statistics are from the CIA World Factbook, unless otherwise indicated.
Age structure
- 0–14 years: 19.5% (male 210,078; female 203,106)
- 15–64 years: 67.8% (male 707,298; female 696,830)
- 65 years and over: 12.7% (male 97,437; female 124,661) (2004 est.)
Sex ratio
- at birth: 1.08 male(s)/female
- under 15 years: 1.08 male(s)/female
- 15–64 years: 1.02 male(s)/female
- 65 years and over: 0.78 male(s)/female
- total population: 1 male(s)/female (2004 est.)
Infant mortality rate
- total: 11.74 deaths/1,000 live births
- female: 10.73 deaths/1,000 live births (2004 est.)
- male: 12.67 deaths/1,000 live births
Life expectancy at birth
- total population: 74.73 years
- male: 72.45 years
- female: 77.2 years (2004 est.)
Total fertility rate
- 1.58 children born/woman (2011 est.)
HIV/AIDS
- adult prevalence rate: less than 0.1% (2001 est.)
- people living with HIV/AIDS: less than 100 (1999 est.)
- deaths: less than 100 (2001 est.)
Nationality
- noun: Macedonian
- adjective: Macedonian
See also
- Republic of Macedonia
- Demographic history of the Republic of Macedonia
- Rumelia
- Albanians in the Republic of Macedonia
- Turks in the Republic of Macedonia
- Romani in the Republic of Macedonia
- Bosniaks in the Republic of Macedonia
- Arabs in the Republic of Macedonia
- Macedonian Muslims
References
- Statistical Yearbook of the Republic of Macedonia 2004 (CD version)
- ↑
- ↑ http://www.balkaninsight.com/en/article/report-macedonia-drained-by-migration
- ↑ http://www.balkaneu.com/fall-number-population-fyrom/
- ↑ http://www.echedoros-a.gr/2013/10/blog-post_3784.html
- ↑ http://www.plusinfo.mk/vest/75328/Bozhidar-Dimitrov-86000-Makedonci-izvadile-bugarski-pasosh
- ↑ http://a1on.mk/wordpress/archives/82774
- ↑ Ohrid agreement
- ↑ http://www.balkaninsight.com/en/article/government-accused-over-macedonia-s-overdue-head-count
- ↑ Institut national d'études démographique (INED)
- ↑ State Statistical Office Republic of Macedonia
- ↑ http://www.stat.gov.mk/Publikacii/PDFSG2014/03-Naselenie-Population.pdf
- ↑ http://www.stat.gov.mk/Publikacii/1.2.15.02_en.pdf
- ↑ "News release: Natural movement of population". Republic of Macedonia State Statistical Office. Retrieved 6 November 2016.
- ↑ http://www.newbalkanpolitics.org.mk/OldSite/Issue_2/dragovic.eng.asp
- ↑ http://blogs.channel4.com/factcheck/factcheck-will-britain-have-a-muslim-majority-by-2050/13690
- ↑ Statistical Yearbook of the Republic of Macedonia, 2014, p. 79, Retrieved 25 November 2016
- ↑ http://www.stat.gov.mk/PXWeb2007bazi/Database/Censuses/databasetree.asp Censuses of Population 1948-2002 State Statistical Office
- ↑ Republic of Macedonia, in: Pew-Templeton Global Religious Futures, Retrieved 24 November 2016
- ↑ "Religious Composition by Country, 2010-2050" in: Pew Research Center, Retrieved 24 November 2016
- ↑ Republic of Macedonia, in: Pew-Templeton Global Religious Futures, Retrieved 24 November 2016
- ↑ Republic of Macedonia, in: Pew-Templeton Global Religious Futures, Retrieved 24 November 2016
- ↑ "Religious Composition by Country, 2010-2050" in: Pew Research Center, Retrieved 24 November 2016
- ↑ Republic of Macedonia, in: Pew-Templeton Global Religious Futures, Retrieved 24 November 2016
External links
Republic of Macedonia articles | ||||||||||||||||||||
|---|---|---|---|---|---|---|---|---|---|---|---|---|---|---|---|---|---|---|---|---|
| History |
| | ||||||||||||||||||
| Geography | ||||||||||||||||||||
| Politics | ||||||||||||||||||||
| Economy | ||||||||||||||||||||
| Society |
| |||||||||||||||||||
| ||||||||||||||||||||
| Wikimedia Commons has media related to Demographics of the Republic of Macedonia. |