Demographics of Serbia
| Demographics of Serbia | |
|---|---|
| Population |
|
| Growth rate |
|
| Birth rate |
|
| Death rate |
|
| Life expectancy |
|
| • male | 72.3 years |
| • female | 78.1 years |
| Fertility rate |
|
| Infant mortality rate |
|
| Net migration rate |
|
| Age structure | |
| 0–14 years |
|
| 15–64 years |
|
| 65 and over |
|
| Sex ratio | |
| At birth | 1.06 male(s)/female |
| Under 15 | 1.06 male(s)/female |
| 15–64 years | 0.99 male(s)/female |
| 65 and over | 0.72 male(s)/female |
| Nationality | |
| Nationality | noun: Serbian(s) adjective: Serbian |
| Major ethnic |
Serbs |
| Minor ethnic |
Hungarians Roma Bosniaks other minorities less than 1% respectively |
| Language | |
| Official |
Serbian at national level; Hungarian, Bosnian, Croatian, Slovakian, Albanian, Romanian and Rusyn are in official use in individual municipalities |
| Spoken |
Serbian Hungarian Bosnian Romani other minority languages less than 1% respectively |
This article is about the demographic features of the population of Serbia, including vital statistics, ethnicity, religious affiliations, education level, health of the populace and other aspects of the population.
Demographic history
Censuses in Serbia ordinarily take place every 10 years, organized by the Statistical Office of the Republic of Serbia. The Principality of Serbia had conducted the first population census in 1834; the subsequent censuses were conducted in 1841, 1843, 1846, 1850, 1854, 1859, 1863 and 1866 and 1874. During the era Kingdom of Serbia, six censuses were conducted in 1884, 1890, 1895, 1900, 1905 and the last one being in 1910. During the Kingdom of Yugoslavia, censuses were conducted in 1931 and 1921; the census in 1941 was never conducted due to the outbreak of World War II. Socialist Yugoslavia conducted censuses in 1948, 1953, 1961, 1971, 1981, and 1991. The two most recent censuses were held in 2002 and 2011.
The years since the first 1834 Census saw frequent border changes of Serbia, first amidst the disintegration of the Ottoman Empire and Austria-Hungary, then subsequent formation and later disintegration of Yugoslavia and, finally, recent self-proclaimed independence of Kosovo which affected territorial scope in which all these censuse have been conducted.
| Historical population | ||
|---|---|---|
| Year | Pop. | ±% |
| 1834 | 678,192 | — |
| 1841 | 828,895 | +22.2% |
| 1843 | 859,545 | +3.7% |
| 1846 | 915,080 | +6.5% |
| 1850 | 956,893 | +4.6% |
| 1854 | 998,919 | +4.4% |
| 1859 | 1,078,281 | +7.9% |
| 1863 | 1,108,668 | +2.8% |
| 1866 | 1,216,219 | +9.7% |
| 1874 | 1,669,337 | +37.3% |
| 1884 | 1,901,336 | +13.9% |
| 1895 | 2,493,770 | +31.2% |
| 1910 | 2,922,858 | +17.2% |
| 1921 | 4,781,446 | +63.6% |
| 1931 | 5,675,567 | +18.7% |
| 1948 | 5,794,966 | +2.1% |
| 1953 | 6,163,154 | +6.4% |
| 1961 | 6,678,227 | +8.4% |
| 1971 | 7,202,591 | +7.9% |
| 1981 | 7,729,676 | +7.3% |
| 1991 | 8,010,991 | +3.6% |
| 2002 | 7,498,001 | −6.4% |
| 2011 | 7,253,862 | −3.3% |
| 2015 | 7,132,862 | −1.7% |
Projections
- Source:[3]
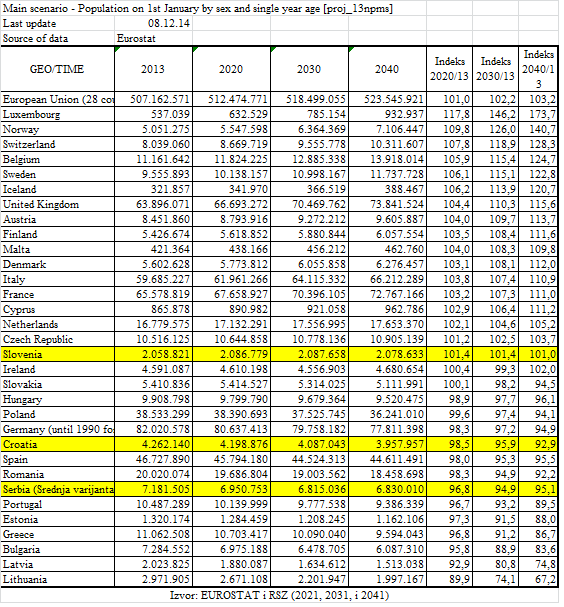
The following forecast for the future population is an official estimate of the National Statistical Institute of Serbia.
| Year | Population |
| 2015 | 7,106,862 |
| 2020 | 6,950,753 |
| 2030 | 6,815,036 |
| 2040 | 6,830,010 |
| 2050 | |
| 2060 |
Vital Statistics
1880–1887
- Source:[4]
| Average population (x 1,000) | Live births | Deaths | Natural change | Crude birth rate (per 1,000) | Crude death rate (per 1,000) | Natural change (per 1,000) | |
|---|---|---|---|---|---|---|---|
| 1880 | 1,738 | 70,167 | 54,243 | 15,924 | 40.4 | 31.2 | 9.2 |
| 1881 | 1,775 | 80,678 | 43,645 | 37,033 | 45.4 | 24.6 | 20.8 |
| 1882 | 1,814 | 80,274 | 41,648 | 38,626 | 44.3 | 23.0 | 21.3 |
| 1883 | 1,859 | 87,161 | 42,263 | 44,898 | 46.7 | 22.7 | 24.0 |
| 1884 | 1,902 | 90,441 | 47,552 | 42,889 | 47.6 | 25.0 | 22.6 |
| 1885 | 1,940 | 90,627 | 52,318 | 38,309 | 46.7 | 27.0 | 19.7 |
| 1886 | 1,965 | 83,091 | 58,525 | 24,566 | 42.3 | 29.7 | 12.6 |
| 1887 | 2,008 | 93,911 | 50,481 | 43,430 | 46.8 | 25.1 | 21.7 |
1900–1912
- Source:[5]
| Average population (x 1,000) | Live births | Deaths | Natural change | Crude birth rate (per 1,000) | Crude death rate (per 1,000) | Natural change (per 1,000) | |
|---|---|---|---|---|---|---|---|
| 1900 | 2,470 | 105,000 | 58,000 | 47,000 | 42.4 | 23.5 | 18.9 |
| 1901 | 2,520 | 96,000 | 53,000 | 43,000 | 38.0 | 21.0 | 17.0 |
| 1902 | 2,570 | 98,000 | 57,000 | 41,000 | 38.0 | 22.3 | 15.7 |
| 1903 | 2,580 | 106,000 | 60,000 | 46,000 | 40.9 | 23.5 | 17.4 |
| 1904 | 2,650 | 106,000 | 56,000 | 50,000 | 39.8 | 21.1 | 18.7 |
| 1905 | 2,660 | 100,000 | 65,000 | 35,000 | 37.3 | 24.8 | 12.5 |
| 1906 | 2,690 | 113,000 | 66,000 | 47,000 | 42.0 | 24.5 | 17.5 |
| 1907 | 2,770 | 111,000 | 62,000 | 49,000 | 40.0 | 22.4 | 17.6 |
| 1908 | 2,820 | 104,000 | 67,000 | 37,000 | 36.8 | 23.7 | 13.1 |
| 1909 | 2,840 | 110,000 | 83,000 | 27,000 | 38.7 | 29.3 | 9.4 |
| 1910 | 2,870 | 112,000 | 64,000 | 48,000 | 39.0 | 22.4 | 16.6 |
| 1911 | 2,940 | 107,000 | 64,000 | 43,000 | 36.3 | 21.8 | 14.5 |
| 1912 | 2,980 | 114,000 | 63,000 | 51,000 | 38.3 | 21.1 | 17.1 |
1950–2014
Data for Serbia excluding Kosovo.
- Source:[6]
| Average population (x 1000) | Live births | Deaths | Natural change | Crude birth rate (per 1000) | Crude death rate (per 1000) | Natural change (per 1000) | Total fertility rate | Abortions reported | |
|---|---|---|---|---|---|---|---|---|---|
| 1950 | 5 970 | 163 297 | 76 851 | 86 446 | 27.4 | 12.9 | 14.5 | 3,51 | |
| 1951 | 6 043 | 145 197 | 80 034 | 65 163 | 24.0 | 13.2 | 10.8 | 3,07 | |
| 1952 | 6 112 | 161 306 | 67 870 | 93 436 | 26.4 | 11.1 | 15.3 | 3,33 | |
| 1953 | 6 188 | 151 672 | 68 168 | 83 504 | 24.5 | 11.0 | 13.5 | 3,03 | |
| 1954 | 6 274 | 152 569 | 62 610 | 89 959 | 24.3 | 10.0 | 14.3 | 3,05 | |
| 1955 | 6 358 | 140 396 | 65 179 | 75 217 | 22.1 | 10.3 | 11.8 | 2,81 | |
| 1956 | 6 425 | 132 078 | 67 055 | 65 023 | 20.6 | 10.4 | 10.1 | 2,66 | |
| 1957 | 6 481 | 118 535 | 64 885 | 53 650 | 18.3 | 10.0 | 8.3 | 2,38 | |
| 1958 | 6 535 | 118 425 | 55 564 | 62 861 | 18.1 | 8.5 | 9.6 | 2,45 | |
| 1959 | 6 585 | 114 872 | 60 850 | 54 022 | 17.4 | 9.2 | 8.2 | 2,40 | |
| 1960 | 6 635 | 119 298 | 61 872 | 57 426 | 18.0 | 9.3 | 8.7 | 2,56 | 81 516 |
| 1961 | 6 693 | 115 222 | 57 990 | 57 232 | 17.2 | 8.7 | 8.6 | 2,51 | 95 196 |
| 1962 | 6 752 | 110 008 | 62 830 | 47 178 | 16.3 | 9.3 | 7.0 | 2,47 | |
| 1963 | 6 809 | 108 324 | 57 778 | 50 546 | 15.9 | 8.5 | 7.4 | 2,46 | |
| 1964 | 6 863 | 103 847 | 62 100 | 41 747 | 15.1 | 9.0 | 6.1 | 2,51 | |
| 1965 | 6 916 | 106 699 | 58 856 | 47 843 | 15.4 | 8.5 | 6.9 | 2,43 | |
| 1966 | 6 974 | 103 775 | 55 471 | 48 304 | 14.9 | 8.0 | 6.9 | 2,45 | |
| 1967 | 7 027 | 103 491 | 62 915 | 40 576 | 14.7 | 9.0 | 5.8 | 2,40 | 131 502 |
| 1968 | 7 078 | 103 621 | 60 932 | 42 689 | 14.6 | 8.6 | 6.0 | 2,41 | |
| 1969 | 7 127 | 105 478 | 68 152 | 37 326 | 14.8 | 9.6 | 5.2 | 2,27 | 162 643 |
| 1970 | 7 171 | 102 453 | 67 211 | 35 242 | 14.3 | 9.4 | 4.9 | 2,40 | |
| 1971 | 7 214 | 104 070 | 65 872 | 38 198 | 14.4 | 9.1 | 5.3 | 2,30 | |
| 1972 | 7 258 | 106 859 | 70 822 | 36 037 | 14.7 | 9.8 | 5.0 | 2,28 | |
| 1973 | 7 303 | 108 361 | 67 152 | 41 209 | 14.8 | 9.2 | 5.6 | 2,31 | |
| 1974 | 7 351 | 110 458 | 66 457 | 44 001 | 15.0 | 9.0 | 6.0 | 2,32 | |
| 1975 | 7 401 | 112 945 | 69 590 | 43 355 | 15.3 | 9.4 | 5.9 | 2,35 | |
| 1976 | 7 452 | 114 035 | 68 565 | 45 470 | 15.3 | 9.2 | 6.1 | 2,28 | |
| 1977 | 7 503 | 111 510 | 68 924 | 42 586 | 14.9 | 9.2 | 5.7 | 2,26 | |
| 1978 | 7 550 | 110 622 | 71 986 | 38 636 | 14.7 | 9.5 | 5.1 | 2,23 | |
| 1979 | 7 611 | 109 953 | 72 306 | 37 647 | 14.4 | 9.5 | 4.9 | 2,14 | |
| 1980 | 7 688 | 109 597 | 76 180 | 33 417 | 14.3 | 9.9 | 4.3 | 2,26 | |
| 1981 | 7 729 | 103 407 | 78 086 | 25 321 | 13.4 | 10.1 | 3.3 | 2,24 | |
| 1982 | 7 738 | 106 575 | 78 473 | 28 102 | 13.8 | 10.1 | 3.6 | 2,31 | |
| 1983 | 7 747 | 108 003 | 83 506 | 24 497 | 13.9 | 10.8 | 3.2 | 2,23 | |
| 1984 | 7 754 | 107 036 | 82 742 | 24 294 | 13.8 | 10.7 | 3.1 | 2,21 | |
| 1985 | 7 759 | 101 938 | 81 836 | 20 102 | 13.1 | 10.5 | 2.6 | 2,22 | 214 806 |
| 1986 | 7 759 | 99 419 | 83 977 | 15 442 | 12.8 | 10.8 | 2.0 | 2,21 | 212 400 |
| 1987 | 7 757 | 98 279 | 83 426 | 14 853 | 12.7 | 10.8 | 1.9 | 2,24 | 205 343 |
| 1988 | 7 755 | 97 471 | 83 616 | 13 855 | 12.6 | 10.8 | 1.8 | 2,22 | 193 558 |
| 1989 | 7 773 | 91 270 | 85 256 | 6 014 | 11.7 | 11.0 | 0.8 | 2,09 | 193 755 |
| 1990 | 7 806 | 90 590 | 85 932 | 4 658 | 11.6 | 11.0 | 0.6 | 2,11 | |
| 1991 | 7 836 | 90 378 | 89 072 | 1 306 | 11.5 | 11.4 | 0.2 | 1,80 | 150 449 |
| 1992 | 7 852 | 86 877 | 93 475 | -6 598 | 11.1 | 11.9 | -0.8 | 1,77 | 135 907 |
| 1993 | 7 848 | 87 931 | 95 121 | -7 190 | 11.2 | 12.1 | -0.9 | 1,90 | 113 720 |
| 1994 | 7 843 | 85 292 | 93 011 | -7 719 | 10.9 | 11.9 | -1.0 | 1,87 | 114 659 |
| 1995 | 7 837 | 86 236 | 93 933 | -7 697 | 11.0 | 12.0 | -1.0 | 1,70 | 92 785 |
| 1996 | 7 828 | 82 548 | 98 370 | -15 822 | 10.5 | 12.6 | -2.0 | 1,85 | 80 003 |
| 1997 | 7 831 | 79 716 | 98 068 | -18 352 | 10.2 | 12.5 | -2.3 | 1,76 | 60 723 |
| 1998 | 7 568 | 76 330 | 99 376 | -23 046 | 10.1 | 13.1 | -3.0 | 1,68 | 55 360 |
| 1999 | 7 540 | 72 222 | 101 444 | -29 222 | 9.6 | 13.5 | -3.9 | 1,62 | 43 771 |
| 2000 | 7 516 | 73 764 | 104 042 | -30 278 | 9.8 | 13.8 | -4.0 | 1,48 | 42 322 |
| 2001 | 7 503 | 78 435 | 99 008 | -20 573 | 10.5 | 13.2 | -2.7 | 1,58 | 34 255 |
| 2002 | 7 500 | 78 101 | 102 785 | -24 684 | 10.4 | 13.7 | -3.3 | 1,57 | 30 794 |
| 2003 | 7 481 | 79 025 | 103 946 | -24 921 | 10.6 | 13.9 | -3.3 | 1,59 | 29 856 |
| 2004 | 7 463 | 78 186 | 104 320 | -26 134 | 10.5 | 14.0 | -3.5 | 1,57 | 26 645 |
| 2005 | 7 441 | 72 180 | 106 771 | -34 591 | 9.7 | 14.3 | -4.6 | 1,45 | 26 645 |
| 2006 | 7 412 | 70 997 | 102 884 | -31 887 | 9.6 | 13.9 | -4.3 | 1,43 | 25 665 |
| 2007 | 7 382 | 68 102 | 102 805 | -34 703 | 9.2 | 13.9 | -4.7 | 1,38 | 24 273 |
| 2008 | 7 350 | 69 083 | 102 711 | -33 628 | 9.4 | 14.0 | -4.6 | 1,42 | 24 159 |
| 2009 | 7 321 | 70 299 | 104 000 | -33 701 | 9.6 | 14.2 | -4.6 | 1,45 | 22 733 |
| 2010 | 7 291 | 68 304 | 103 211 | -34 907 | 9.4 | 14.2 | -4.8 | 1,42 | 22 092 |
| 2011 | 7 234 | 65 598 | 102 935 | -37 337 | 9.0 | 14.2 | -5.2 | 1,41 | |
| 2012 | 7 195 | 67 257 | 102 400 | -35 143 | 9.3 | 14.1 | -4.8 | 1,45 | |
| 2013[7] | 7 163 | 65 554 | 100 300 | -34 746 | 9.1 | 14.0 | -4.9 | 1,44 | |
| 2014 | 7 132 | 66 461 | 101 247 | -34 786 | 9.3 | 14.1 | -4.8 | 1,47 | |
| 2015[8] | 7 095 | 65 657 | 103 678 | -38 021 | 9.3 | 14.6 | -5.3 | 1,46 |
Ethnic groups
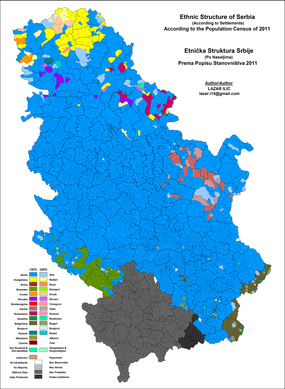
Situated in the middle of the Balkans, Serbia is home to many different ethnic groups. According to the 2011 census, Serbs are the largest ethnic group in the country and constitute 83.3% of population. Hungarians are the largest ethnic minority in Serbia, concentrated predominately in northern Vojvodina and representing 3.5% of the country's population (13% in Vojvodina). Roma people constitute 2% of the total population but unofficial estimates put their actual number to be twice or three as high.[9] Bosniaks are third largest ethnic minority mainly inhabiting Raška region in southwestern part of the country. Other minority groups include Croats (0.9%), Slovaks (0.8%), Albanians, Montenegrins (0.5%), Romanians (0.4%), Macedonians (0.3%), and Bulgarians (0.3%). The Chinese and Arabs, are the only two significant immigrant minorities.[10][11]
| Ethnic group |
census 1948 | census 1953 | census 1961 | census 1971 | census 1981 | census 1991 | census 2002[12] | census 2011 | ||||||||
|---|---|---|---|---|---|---|---|---|---|---|---|---|---|---|---|---|
| Number | % | Number | % | Number | % | Number | % | Number | % | Number | % | Number | % | Number | % | |
| Serbs | 4,651,819 | 80.2 | 4,963,070 | 80.4 | 5,477,670 | 82.0 | 5,788,547 | 80.4 | 5,972,661 | 77.3 | 6,616,917 | 80.3 | 6,212,838 | 82.9 | 5,988,150 | 83.3 |
| Hungarians | 433,618 | 7.5 | 441,748 | 7.2 | 449,377 | 6.7 | 430,145 | 6.0 | 390,321 | 5.0 | 337,479 | 4.5 | 293,299 | 3.9 | 253,899 | 3.5 |
| Roma | 40,951 | 0.7 | 46,896 | 0.8 | 6,624 | 0.1 | 35,301 | 0.5 | 76,833 | 1.0 | 90,853 | 1.2 | 108,193 | 1.4 | 147,604 | 2.1 |
| Muslims | 7,636 | 0.1 | 74,840 | 1.2 | 85,441 | 1.3 | 127,973 | 1.8 | 156,604 | 2.0 | 176,401 | 2.3 | 19,503 | 0.3 | 22,301 | 0.3 |
| Bosniaks | 136,087 | 1.8 | 145,278 | 2.0 | ||||||||||||
| Croats | 164,574 | 2.8 | 167,045 | 2.7 | 189,158 | 2.8 | 176,649 | 2.5 | 140,650 | 1.8 | 97,344 | 1.2 | 70,602 | 0.9 | 57,900 | 0.8 |
| Slovaks | 73,138 | 1.3 | 75,006 | 1.2 | 77,816 | 1.2 | 76,707 | 1.1 | 73,170 | 0.9 | 65,363 | 0.9 | 59,021 | 0.8 | 52,750 | 0.7 |
| Albanians | 33,769 | 0.6 | 40,954 | 0.7 | 53,167 | 0.8 | 68,593 | 1.0 | 76,296 | 1.0 | 74,303 | 1.0 | 61,647 | 0.8 | 5,809 | 0.08 |
| Montenegrins | 46,810 | 0.8 | 54,718 | 0.9 | 67,165 | 1.0 | 93,705 | 1.3 | 120,438 | 1.6 | 117,761 | 1.6 | 69,049 | 0.9 | 38,527 | 0.5 |
| Vlachs | 93,440 | 1.6 | 28,047 | 0.5 | 1,367 | 0.0 | 14,719 | 0.2 | 25,592 | 0.3 | 15,675 | 0.2 | 40,054 | 0.5 | 35,330 | 0.5 |
| Romanians | 63,112 | 1.1 | 59,689 | 1.0 | 59,492 | 0.9 | 57,399 | 0.8 | 53,676 | 0.7 | 37,818 | 0.5 | 34,576 | 0.5 | 29,332 | 0.4 |
| Yugoslavs | 14,873 | 0.2 | 122,904 | 1.7 | 439,265 | 5.7 | 312,595 | 4.1 | 80,721 | 1.1 | 23,303 | 0.3 | ||||
| Macedonians | 17,391 | 0.3 | 26,302 | 0.4 | 35,146 | 0.5 | 41,627 | 0.6 | 47,930 | 0.6 | 44,028 | 0.6 | 25,847 | 0.3 | 22,755 | 0.3 |
| Bulgarians | 59,395 | 1.0 | 60,146 | 1.0 | 58,243 | 0.9 | 53,536 | 0.7 | 33,294 | 0.4 | 26,416 | 0.3 | 20,497 | 0.3 | 18,543 | 0.3 |
| Others[13]/unspecified | 114,493 | 2.0 | 132,549 | 2.1 | 102,700 | 1.5 | 115,093 | 1.6 | 122,506 | 1.6 | 97,953 | 1.3 | 266,067 | 3.5 | 368,136 | 5.1 |
| Total | 5,936,223 | 6,171,010 | 6,678,239 | 7,202,898 | 7,729,236 | 8,010,906 | 7,498,001 | 7,186,862 | ||||||||
Religion
Serbia is a religiously diverse country, with an Eastern Orthodox majority, and Catholic and Muslim minorities, among other smaller confessions.[14]
Orthodox Christians number 6,079,396 or 84.5% of country's population. The Serbian Orthodox Church is the largest and traditional church of the country, adherents of which are overwhelmingly Serbs. Other Orthodox Christian communities in Serbia include Montenegrins, Romanians, Vlachs, Macedonians and Bulgarians.
There are 356,957 Roman Catholics in Serbia, roughly 5% of the population, mostly in Vojvodina (especially its northern part) which is home to minority ethnic groups such as Albanians, Hungarians, Croats, Bunjevci, as well as to some Slovaks and Czechs.[14] Protestantism accounts for about 1% of the country's population, chiefly among Slovaks in Vojvodina as well as among Reformist Hungarians.
Muslims, with 222,282 or 3% of population, form third largest religious group. Islam has a strong historic following in the southern regions of Serbia, primarily in southern Raška. Bosniaks are the largest Islamic community in Serbia; estimates are that some third of country's Roma people are Muslim.
Atheists numbered 80,053 or 1.1% of population and additional 4,070 are Agnostics.[15]
Languages
The official language is Serbian, member of the South Slavic group of languages, and is native to 6,330,919 or 88% of the population.[15] Recognized minority languages are: Hungarian (mother tongue to 243,146 people or 3.4% of population), Slovak, Albanian, Romanian, Bulgarian and Rusyn as well as Bosnian and Croatian which are completely mutual intelligible with Serbian. All these languages are in official use in municipalities or cities where more than a 15% of population consists of national minority.[16] In Vojvodina, provincial administration uses, besides Serbian, five other languages (Hungarian, Slovak, Croatian, Romanian and Rusyn).
Largest cities
| Name | Population (2011) |
|---|---|
| Belgrade | 1,233,796 |
| Novi Sad | 277,522 |
| Niš | 187,544 |
| Kragujevac | 150,835 |
| Subotica | 105,681 |
Education
According to 2011 census, literacy in Serbia stands at 98% of population while computer literacy is at 49% (complete computer literacy is at 34.2%).[2] Same census showed the following levels of education: 16.2% of inhabitants have higher education (10.6% have bachelors or master's degrees, 5.6% have an associate degree), 49% have a secondary education, 20.7% have an elementary education, and 13.7% have not completed elementary education.[17]
Health
The life expectancy in Serbia at birth is 74.2 years, 71.6 for males and 76.8 for females.[1] Serbia has a comparatively old overall population (among the 10 oldest in the world), with the average age of 42.2 years.[18]
See also
References
| Wikimedia Commons has media related to Demographics of Serbia. |
- 1 2 3 Fusion. "РЗС". Werbrzs.stat.gov.rs. Retrieved 2016-09-29.
- 1 2 3 4 "2011 Census of Population, Households and Dwellings in the Republic of Serbia" (PDF). Pod2.stat.gov.rs. Retrieved 2016-09-29.
- ↑ "Population on 1st January by sex and single year age" (PNG). Makroekonomija.org. Retrieved 2016-09-29.
- ↑ "Archived copy" (PDF). Archived from the original (PDF) on 2014-09-04. Retrieved 2014-09-04.
- ↑ B.R. Mitchell. European historical statistics. 1750-1975.
- ↑ "Démographie des pays développés - Bases de données en ligne - Les chiffres - Ined - Institut national d'études démographiques". Ined.fr. Retrieved 2016-09-29.
- ↑ "VITAL EVENTS IN THE REPUBLIC OF SERBIA, 2013" (PDF). Webrzs.stat.gov.rs. Retrieved 2016-09-29.
- ↑ "Витални догађаји у Републици Србији, 2015.". Webrzs.stat.gov.rs. Retrieved 2016-09-29.
- ↑ "Vesti – Zvaničan broj Roma u Srbiji". B92.net. 7 April 2009.
- ↑ "Chinese Migrants Use Serbia as Gate to Europe". Abcnews.go.com. Retrieved 2016-09-26.
- ↑ V. Mijatović – B. Hadžić. "I Kinezi napuštaju Srbiju | Reportaže". Novosti.rs. Retrieved 2016-09-29.
- ↑ "Official Results of Serbian Census 2003–Population" (PDF). (441 KB), pp. 12-13 (Serbian)
- ↑ "2011 Census of Population, Households and Dwellings in the Republic of Serbia" (PDF). Pod2.stat.gov.rs. Retrieved 2016-09-29.
- 1 2 "Становништво, домаћинства и породице – база : Попис у Србији 2011". Popis2011.stat.rs. Retrieved 2016-09-29.
- 1 2 "2011 Census of Population, Households and Dwellings in the Republic of Serbia" (PDF). Pod2.stat.gov.rs. Archived from the original (PDF) on 2014-07-15. Retrieved 2016-09-29.
- ↑ "EUROPEAN CHARTER FOR REGIONAL OR MINORITY LANGUAGES" (PDF). Coe.int. Retrieved 2016-09-29.
- ↑ "Education stats in Serbia". Webrzs.stat.gov.rs. Retrieved 20 March 2013.
- ↑ "Dnevni list Danas | Društvo | Srbija gubi 30.000 stanovnika godišnje". Danas.rs. Retrieved 2016-09-29.
 | ||
| ||