Demographics of the Czech Republic
This article is about the demographic features of the population of the Czech Republic, including population density, ethnicity, education level, health of the populace, economic status, and religious affiliations.
Population
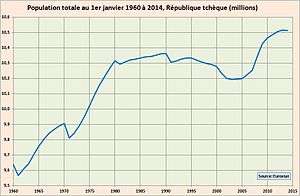
With an estimated population of 10,512,419 at 1 January 2014, compared to 9.3 million at the beginning of the 20th century, the population growth of the Czech Republic has been limited, due to low fertility rates and loss of population in and around World Wars I and II. Population loss during World War I was approximately 350,000. At the beginning of World War II the population of the Czech Republic reached its maximum (11.2 million). Due to the expulsion of the German residents after World War II, the Czech Republic lost about 3 million inhabitants and in 1947 the population was only 8.8 million. Population growth resumed, and in 1994 the population was 10.33 million.
From 1994-2003 natural growth was slightly negative (-0.15% per year) and the population decreased to 10.2 million. Since 2005, natural growth has been positive, but in recent times the most important influence on the population of the Czech Republic has been immigration: approximately 300,000 during the last decade.
Population censuses
| Census date | Population |
|---|---|
| 31 Dec 1857 | 7,016,531 |
| 31 Dec 1869 | 7,617,230 |
| 31 Dec 1880 | 8,222,013 |
| 31 Dec 1890 | 8,665,421 |
| 31 Dec 1900 | 9,372,214 |
| 31 Dec 1910 | 10,078,637 |
| 15 Feb 1921 | 10,009,587 |
| 1 Dec 1930 | 10,674,386 |
| 1 Mar 1950 | 8,896,133 |
| 1 Mar 1961 | 9,571,531 |
| 1 Dec 1970 | 9,807,697 |
| 1 Nov 1980 | 10,291,927 |
| 3 Mar 1991 | 10,302,215 |
| 1 Mar 2001 | 10,230,060 |
| 25 Mar 2011 | 10,562,214 |
The following statistics on age structure and sex ratio are from the CIA World Factbook.
Age structure
2010
0–14 years:
14.2% (male ; female )
15–64 years:
70.6% (male ; female )
65 years and over:
15.2% (male ; female )
2007
0–14 years:
14.2% (male 758,305; female 718,618)
15–64 years:
71.2% (male 3,726,148; female 3,665,225)
65 years and over:
14.6% (male 598,481; female 914,353)
2006
0–14 years:
14.4% (male 760,065; female 719,449)
15–64 years:
71.2% (male 3,683,215; female 3,642,023)
65 years and over:
14.4% (male 582,904; female 899,533)
2005
0–14 years:
14.7% (male 773,028; female 731,833)
15–64 years:
71.1% (male 3,651,018; female 3,627,006)
65 years and over:
14.2% (male 565,374; female 892,879)
2004
0–14 years:
14.9% (male 784,186; female 742,760)
15–64 years:
71.0% (male 3,638,782; female 3,620,219)
65 years and over:
14.0% (male 557,945; female 876,685)
2003
0–14 years:
15.2% (male 797,847; female 756,628)
15–64 years:
70.8% (male 3,625,092; female 3,608,696)
65 years and over:
13.9% (male 551,801; female 871,391)
Sex ratio
at birth:
1.06 male(s)/female
under 15 years:
1.06 male(s)/female
15–64 years:
1.01 male(s)/female
65 years and over:
0.65 male(s)/female
total population:
0.96 male(s)/female (2007 est.)
Vital statistics
Births and deaths
Source: Czech Demographic Handbook 2007[1]
| Average population (000s) | Live births | Deaths | Natural change | Crude birth rate (per 1000) | Crude death rate (per 1000) | Natural change (per 1000) | Fertility rates | Migration change | |
|---|---|---|---|---|---|---|---|---|---|
| 1900 | 9 334 | 330 662 | 227 920 | 102 742 | 35.4 | 24.4 | 11.0 | ||
| 1901 | 9 405 | 325 514 | 221 052 | 104 462 | 34.6 | 23.5 | 11.1 | ||
| 1902 | 9 475 | 333 619 | 222 457 | 111 162 | 35.2 | 23.5 | 11.7 | ||
| 1903 | 9 545 | 318 275 | 218 448 | 99 827 | 33.3 | 22.9 | 10.5 | ||
| 1904 | 9 615 | 319 433 | 222 276 | 97 157 | 33.2 | 23.1 | 10.1 | ||
| 1905 | 9 685 | 300 414 | 232 999 | 67 415 | 31.0 | 24.1 | 7.0 | ||
| 1906 | 9 754 | 313 449 | 203 182 | 110 267 | 32.1 | 20.8 | 11.3 | ||
| 1907 | 9 825 | 306 356 | 210 721 | 95 635 | 31.2 | 21.4 | 9.7 | ||
| 1908 | 9 895 | 308 504 | 210 101 | 98 403 | 31.2 | 21.2 | 9.9 | ||
| 1909 | 9 965 | 305 426 | 210 047 | 95 379 | 30.6 | 21.1 | 9.6 | ||
| 1910 | 10 036 | 295 617 | 196 728 | 98 889 | 29.5 | 19.6 | 9.9 | ||
| 1911 | 10 099 | 289 058 | 206 266 | 82 792 | 28.6 | 20.4 | 8.2 | ||
| 1912 | 10 157 | 280 368 | 203 324 | 77 044 | 27.6 | 20.0 | 7.6 | ||
| 1913 | 10 221 | 275 060 | 190 475 | 84 585 | 26.9 | 18.6 | 8.3 | ||
| 1914 | 10 283 | 269 142 | 188 838 | 80 304 | 26.2 | 18.4 | 7.8 | ||
| 1915 | 10 286 | 197 542 | 201 280 | -3 738 | 19.2 | 19.6 | -0.4 | ||
| 1916 | 10 222 | 140 211 | 186 381 | -46 170 | 13.7 | 18.2 | -4.5 | ||
| 1917 | 10 128 | 126 916 | 188 649 | -61 733 | 12.5 | 18.6 | -6.1 | ||
| 1918 | 10 004 | 120 579 | 236 035 | -115 456 | 12.1 | 23.6 | -11.5 | ||
| 1919 | 9 922 | 189 675 | 177 428 | 12 247 | 19.1 | 17.9 | 1.2 | ||
| 1920 | 9 978 | 244 668 | 176 562 | 68 106 | 24.5 | 17.7 | 6.8 | 2.97 | |
| 1921 | 10 002 | 257 281 | 161 321 | 95 960 | 25.7 | 16.1 | 9.6 | 3.08 | |
| 1922 | 10 113 | 248 728 | 163 366 | 85 362 | 24.6 | 16.2 | 8.4 | 2.93 | |
| 1923 | 10 198 | 241 230 | 142 335 | 98 895 | 23.7 | 14.0 | 9.7 | 2.80 | |
| 1924 | 10 278 | 228 894 | 146 098 | 82 796 | 22.3 | 14.2 | 8.1 | 2.55 | |
| 1925 | 10 370 | 225 555 | 146 450 | 79 105 | 21.8 | 14.1 | 7.6 | 2.51 | |
| 1926 | 10 443 | 219 802 | 148 298 | 71 504 | 21.0 | 14.2 | 6.8 | 2.40 | |
| 1927 | 10 496 | 208 711 | 155 479 | 53 232 | 19.9 | 14.8 | 5.1 | 2.26 | |
| 1928 | 10 549 | 208 942 | 147 064 | 61 878 | 19.8 | 13.9 | 5.9 | 2.23 | |
| 1929 | 10 598 | 203 064 | 155 493 | 47 571 | 19.2 | 14.7 | 4.5 | 2.15 | |
| 1930 | 10 648 | 207 224 | 142 159 | 65 065 | 19.5 | 13.4 | 6.1 | 2.17 | |
| 1931 | 10 702 | 196 214 | 144 534 | 51 680 | 18.3 | 13.5 | 4.8 | 2.04 | |
| 1932 | 10 750 | 190 397 | 142 997 | 47 400 | 17.7 | 13.3 | 4.4 | 1.98 | |
| 1933 | 10 791 | 176 201 | 140 906 | 35 295 | 16.3 | 13.1 | 3.3 | 1.81 | |
| 1934 | 10 826 | 171 042 | 135 914 | 35 128 | 15.8 | 12.6 | 3.2 | 1.78 | |
| 1935 | 10 853 | 161 748 | 140 878 | 20 870 | 14.9 | 13.0 | 1.9 | 1.70 | |
| 1936 | 10 873 | 157 992 | 139 093 | 18 899 | 14.5 | 12.8 | 1.7 | 1.68 | |
| 1937 | 10 889 | 155 996 | 139 558 | 16 438 | 14.3 | 12.8 | 1.5 | 1.65 | |
| 1938 | 10 877 | 163 525 | 143 115 | 20 410 | 15.0 | 13.2 | 1.9 | 1.85 | |
| 1939 | 11 106 | 192 344 | 146 976 | 45 368 | 17.3 | 13.2 | 4.1 | 1.94 | |
| 1940 | 11 160 | 218 043 | 153 499 | 64 544 | 19.5 | 13.8 | 5.8 | 2.20 | |
| 1941 | 11 129 | 208 913 | 152 048 | 56 865 | 18.8 | 13.7 | 5.1 | 2.25 | |
| 1942 | 11 054 | 199 259 | 153 096 | 46 163 | 18.0 | 13.8 | 4.2 | 2.42 | |
| 1943 | 11 035 | 225 379 | 153 349 | 72 030 | 20.4 | 13.9 | 6.5 | 2.76 | |
| 1944 | 11 109 | 230 183 | 161 457 | 68 726 | 20.7 | 14.5 | 6.2 | 2.80 | |
| 1945 | 10 693 | 194 182 | 184 944 | 9 238 | 18.2 | 17.3 | 0.9 | 2.51 | |
| 1946 | 9 523 | 210 454 | 134 568 | 75 886 | 22.1 | 14.1 | 8.0 | 3.07 | |
| 1947 | 8 765 | 206 745 | 105 277 | 101 468 | 23.6 | 12.0 | 11.6 | 3.21 | |
| 1948 | 8 893 | 197 837 | 101 501 | 96 336 | 22.2 | 11.4 | 10.8 | 2,82 | |
| 1949 | 8 893 | 185 484 | 104 632 | 80 852 | 20.9 | 11.8 | 9.1 | 2,68 | |
| 1950 | 8 930 | 188 341 | 103 203 | 85 138 | 21.1 | 11.6 | 9.5 | 2,77 | |
| 1951 | 9 000 | 185 570 | 102 658 | 82 912 | 20.6 | 11.4 | 9.2 | 2,74 | |
| 1952 | 9 075 | 180 143 | 97 726 | 82 417 | 19.9 | 10.8 | 9.1 | 2,69 | |
| 1953 | 9 140 | 172 547 | 98 837 | 73 710 | 18.9 | 10.8 | 8.1 | 2,61 | |
| 1954 | 9 200 | 168 402 | 99 636 | 68 766 | 18.3 | 10.8 | 7.5 | 2,58 | |
| 1955 | 9 270 | 165 874 | 93 300 | 72 574 | 17.9 | 10.1 | 7.8 | 2,58 | |
| 1956 | 9 330 | 162 509 | 93 526 | 68 983 | 17.4 | 10.0 | 7.4 | 2,57 | |
| 1957 | 9 390 | 155 429 | 98 687 | 56 742 | 16.6 | 10.5 | 6.0 | 2,49 | |
| 1958 | 9 435 | 141 762 | 93 697 | 48 065 | 15.0 | 9.9 | 5.1 | 2,31 | |
| 1959 | 9 465 | 128 982 | 97 159 | 31 823 | 13.6 | 10.3 | 3.4 | 2,15 | |
| 1960 | 9 490 | 128 879 | 93 863 | 35 016 | 13.6 | 9.9 | 3.7 | 2,12 | |
| 1961 | 9 587 | 131 019 | 94 973 | 36 046 | 13.7 | 9.9 | 3.8 | 2,13 | |
| 1962 | 9 625 | 133 557 | 104 318 | 29 239 | 13.9 | 10.8 | 3.0 | 2,14 | |
| 1963 | 9 671 | 148 840 | 100 129 | 48 711 | 15.4 | 10.4 | 5.0 | 2,33 | |
| 1964 | 9 728 | 154 420 | 101 984 | 52 436 | 15.9 | 10.5 | 5.4 | 2,36 | |
| 1965 | 9 779 | 147 438 | 105 108 | 42 330 | 15.1 | 10.7 | 4.3 | 2,18 | |
| 1966 | 9 821 | 141 162 | 105 784 | 35 378 | 14.4 | 10.8 | 3.6 | 2,01 | |
| 1967 | 9 853 | 138 448 | 108 967 | 29 481 | 14.1 | 11.1 | 3.0 | 1,90 | |
| 1968 | 9 876 | 137 437 | 115 195 | 22 242 | 13.9 | 11.7 | 2.3 | 1,83 | |
| 1969 | 9 897 | 143 165 | 120 653 | 22 512 | 14.5 | 12.2 | 2.3 | 1,85 | |
| 1970 | 9 800 | 147 865 | 123 327 | 24 538 | 15.1 | 12.6 | 2.5 | 1,91 | |
| 1971 | 9 827 | 154 180 | 122 375 | 31 805 | 15.7 | 12.5 | 3.2 | 1,98 | |
| 1972 | 9 868 | 163 661 | 119 205 | 44 456 | 16.6 | 12.1 | 4.5 | 2,07 | |
| 1973 | 9 922 | 181 750 | 124 437 | 57 313 | 18.3 | 12.5 | 5.8 | 2,29 | |
| 1974 | 9 988 | 194 215 | 126 809 | 67 406 | 19.4 | 12.7 | 6.7 | 2,43 | |
| 1975 | 10 059 | 191 776 | 124 314 | 67 462 | 19.1 | 12.4 | 6.7 | 2,40 | |
| 1976 | 10 126 | 187 378 | 125 232 | 62 146 | 18.5 | 12.4 | 6.1 | 2,35 | |
| 1977 | 10 187 | 181 763 | 126 214 | 55 549 | 17.8 | 12.4 | 5.5 | 2,32 | |
| 1978 | 10 242 | 178 901 | 127 136 | 51 765 | 17.5 | 12.4 | 5.1 | 2,32 | |
| 1979 | 10 292 | 172 112 | 127 949 | 44 163 | 16.7 | 12.4 | 4.3 | 2,28 | |
| 1980 | 10 283 | 153 801 | 135 537 | 18 264 | 15.0 | 13.2 | 1.8 | 2,10 | |
| 1981 | 10 301 | 144 438 | 130 407 | 14 031 | 14.0 | 12.7 | 1.4 | 2,02 | |
| 1982 | 10 315 | 141 738 | 130 765 | 10 973 | 13.7 | 12.7 | 1.1 | 2,01 | |
| 1983 | 10 324 | 137 431 | 134 474 | 2 957 | 13.3 | 13.0 | 0.3 | 1,96 | |
| 1984 | 10 330 | 136 941 | 132 188 | 4 753 | 13.3 | 12.8 | 0.5 | 1,97 | |
| 1985 | 10 337 | 135 881 | 131 641 | 4 240 | 13.1 | 12.7 | 0.4 | 1,96 | |
| 1986 | 10 341 | 133 356 | 132 585 | 771 | 12.9 | 12.8 | 0.1 | 1,94 | |
| 1987 | 10 349 | 130 921 | 127 244 | 3 677 | 12.7 | 12.3 | 0.4 | 1,91 | |
| 1988 | 10 356 | 132 667 | 125 694 | 6 973 | 12.8 | 12.1 | 0.7 | 1,94 | |
| 1989 | 10 362 | 128 356 | 127 747 | 609 | 12.4 | 12.3 | 0.1 | 1,87 | |
| 1990 | 10 363 | 130 564 | 129 166 | 1 398 | 12.6 | 12.5 | 0.1 | 1,89 | |
| 1991 | 10 309 | 129 354 | 124 290 | 5 064 | 12.5 | 12.1 | 0.5 | 1,86 | |
| 1992 | 10 318 | 121 705 | 120 337 | 1 368 | 11.8 | 11.7 | 0.1 | 1,72 | |
| 1993 | 10 331 | 121 025 | 118 185 | 2 840 | 11.7 | 11.4 | 0.3 | 1,67 | |
| 1994 | 10 336 | 106 579 | 117 373 | -10 794 | 10.3 | 11.4 | -1.0 | 1,44 | |
| 1995 | 10 331 | 96 097 | 117 913 | -21 816 | 9.3 | 11.4 | -2.1 | 1,28 | |
| 1996 | 10 315 | 90 446 | 112 782 | -22 336 | 8.8 | 10.9 | -2.2 | 1,19 | |
| 1997 | 10 304 | 90 657 | 112 744 | -22 087 | 8.8 | 10.9 | -2.1 | 1,17 | |
| 1998 | 10 295 | 90 535 | 109 527 | -18 992 | 8.8 | 10.6 | -1.8 | 1,16 | |
| 1999 | 10 283 | 89 471 | 109 768 | -20 297 | 8.7 | 10.7 | -2.0 | 1,13 | |
| 2000 | 10 273 | 90 910 | 109 001 | -18 091 | 8.8 | 10.6 | -1.8 | 1,14 | |
| 2001 | 10 224 | 90 715 | 107 755 | -17 040 | 8.9 | 10.5 | -1.7 | 1,15 | |
| 2002 | 10 201 | 92 786 | 108 243 | -15 457 | 9.1 | 10.6 | -1.5 | 1,17 | |
| 2003 | 10 207 | 93 685 | 111 288 | -17 603 | 9.2 | 10.9 | -1.7 | 1,18 | |
| 2004 | 10 216 | 97 664 | 107 177 | -9 513 | 9.6 | 10.5 | -0.9 | 1,23 | |
| 2005 | 10 236 | 102 211 | 107 938 | -5 727 | 10.0 | 10.5 | -0.6 | 1,28 | |
| 2006 | 10 269 | 105 831 | 104 441 | 1 390 | 10.3 | 10.2 | 0.1 | 1,33 | |
| 2007 | 10 334 | 114 632 | 104 636 | 9 996 | 11.1 | 10.1 | 1.0 | 1,44 | |
| 2008 | 10 425 | 119 570 | 104 948 | 14 622 | 11.5 | 10.1 | 1.4 | 1,50 | |
| 2009 | 10 488 | 118 348 | 107 421 | 10 927 | 11.3 | 10.2 | 1.0 | 1,49 | 28 344 |
| 2010 | 10 517 | 117 153 | 106 844 | 10 309 | 11.1 | 10.2 | 0.9 | 1,49 | 15 648 |
| 2011 | 10 514 | 108 673 | 106 848 | 1 825 | 10.4 | 10.2 | 0.2 | 1,42 | 16 889 |
| 2012 | 10 516.1 | 108 576 | 108 189 | 377 | 10.3 | 10.3 | 0.0 | 1,45 | 10 293 |
| 2013 | 10 512.4 | 106 751 | 109 160 | -2 409 | 10.2 | 10.4 | -0.2 | 1,46 | -1 297 |
| 2014 | 10 538.3 | 109 860 | 105 665 | 4 195 | 10.4 | 10.0 | 0.4 | 1,53 | 21 661 |
| 2015 | 10 553.8 | 110 764 | 111 173 | -409 | 10.5 | 10.5 | 0.0 | 1,57 | 15 977 |
| 2016 (2Q)† |
10 564.8 | 55 050 | 54 096 | 954 | 10 069 |
- † As of 30.06.2016
|
1.9 - 2.1
1.7 - 1.9
1.5 - 1.7
1.4 - 1.5
1.3 - 1.4
< 1.3 |
Infant mortality rate
3.3 in 2006, 3.1 in 2007, 2.8 in 2008, 2.9 in 2009, 2.7 in 2010 and 2.4 in 2014.
Life expectancy at birth
male:
75.2 years
female:
81.1 years (2013)
total:
Ethnic groups
The majority of the 10.5 million inhabitants of the Czech Republic are ethnically and linguistically Czech (95%). They are descendants of Slavic people from the Black Sea-Carpathian region who settled in Bohemia, Moravia and parts of present-day Austria in the 6th century AD. Other ethnic groups include Germans, Romani, Poles and Hungarians. Historical minorities like Germans and Poles are declining due to assimilation. The Roma community is growing, while there is also a growing Vietnamese community. Other ethnic communities like Greeks, Turks, Italians and Yugoslavs are found in the capital city, Prague. Since the dissolution of Czechoslovakia, Slovaks living in the Czech Republic have comprised roughly 3% of the population.
There are different groups of national and ethnic minorities in the Czech Republic. The so-called "old minorities" live mostly in specific areas (e.g. Poles in the Zaolzie region, Germans in the Hultschiner region) while the "new minorities" are scattered among the majority population (generally in the larger towns). While some of the minorities have the whole social structure of Czech society (Poles, Slovaks, Greeks), other represent only some of the social groups (i.e. Russian newcomers of middle class, and Ukrainians and Romanis who generally represent the underclass).[3]
1880-1910
| Language | 1880 | 1890 | 1900 | 1910 |
|---|---|---|---|---|
| Czech | 62.5% | 62.4% | 62.4% | 62.9% |
| German | 35.8% | 35.6% | 35.1% | 34.6% |
| Polish | 1.0% | 1.2% | 1.6% | 1.6% |
| Other | 0.7% | 0.8% | 0.9% | 0.9% |
| Total population | 8,222,013 | 8,665,421 | 9,372,140 | 10,078,637 |
After World War I
| Ethnic group |
census 1921 1 | census 1930 | census 1950 | census 1961 | census 1970 | census 1980 | census 1991 | census 2001 | census 2011 | |||||||||
|---|---|---|---|---|---|---|---|---|---|---|---|---|---|---|---|---|---|---|
| Number | % | Number | % | Number | % | Number | % | Number | % | Number | % | Number | % | Number | % | Number | % | |
| Czechs | 6,758,983 | 67.5 | 7,304,588 | 68.3 | 8,343,558 | 93.9 | 9,023,501 | 94.2 | 9,270,617 | 94.4 | 9,733,925 | 94.6 | 8,363,768 | 81.2 | 9,249,777 | 90.5 | 6,732,104 | 63.7 |
| Moravians | 1,362,313 | 13.2 | 380,474 | 3.7 | 522,474 | 4.9 | ||||||||||||
| Silesians | 44,446 | 0.4 | 10,878 | 0.1 | 12,231 | 0.1 | ||||||||||||
| Slovaks | 15,732 | 0.2 | 44,451 | 0.4 | 258,025 | 2.9 | 275,997 | 2.9 | 320,998 | 3.3 | 359,370 | 3.5 | 314,877 | 3.1 | 193,190 | 1.9 | 149,140 | 1.4 |
| Poles | 103,521 | 1.0 | 92,689 | 0.9 | 70,816 | 0.8 | 66,540 | 0.7 | 64,074 | 0.7 | 66,123 | 0.6 | 59,383 | 0.6 | 51,968 | 0.5 | 39,269 | 0.4 |
| Germans | 3,061,369 | 30.6 | 3,149,820 | 29.5 | 159,938 | 1.8 | 134,143 | 1.4 | 80,903 | 0.8 | 58,211 | 0.6 | 48,556 | 0.5 | 39,106 | 0.4 | 18,772 | 0.3 |
| Ukrainians | 13,343 | 0.1 | 22,657 | 0.2 | 19,384 | 0.2 | 19,549 | 0.2 | 9,794 | 0.1 | 10,271 | 0.1 | 8,220 | 0.1 | 22,112 | 0.2 | 53,603 | 0.5 |
| Rusyns | 1,926 | 0.0 | 1,106 | 0.0 | ||||||||||||||
| Russians | 6,619 | 0.1 | 5,051 | 0.0 | 5,062 | 0.0 | 12,369 | 0.1 | 18,021 | 0.2 | ||||||||
| Vietnamese | 421 | 0.0 | 17,462 | 0.2 | 29,825 | 0.3 | ||||||||||||
| Hungarians | 7,049 | 0.1 | 11,427 | 0.1 | 13,201 | 0.1 | 15,152 | 0.2 | 18,472 | 0.2 | 19,676 | 0.2 | 19,932 | 0.2 | 14,672 | 0.1 | 9,049 | 0.1 |
| Romani[5] | 227 | 0.0 | 19,770 | 0.2 | 19,392 | 0.2 | 32,903 | 0.3 | 11,746 | 0.1 | 5,199 | 0.0 | ||||||
| Jews | 35,699 | 0.4 | 37,093 | 0.4 | 218 | 0.0 | ||||||||||||
| Yugoslavs | 4,749 | 0.0 | 3,957 | 0.0 | 3,386 | 0.0 | ||||||||||||
| Romanians | 966 | 0.0 | 3,205 | 0.0 | 1,034 | 0.0 | 1,238 | 0.0 | ||||||||||
| Others/undeclared | 10,038 | 0.1 | 5,719 | 0.1 | 11,441 | 0.1 | 10,095 | 0.1 | 36,220 | 0.4 | 39,300 | 0.4 | 39,129 | 0.4 | 220,660 | 2.6 | 2,742,6691 | 26.0 |
| Total | 10,005,734 | 10,674,386 | 8,896,133 | 9,571,531 | 9,807,697 | 10,291,927 | 10,302,215 | 10,230,060 | 10,562,214 | |||||||||
| 1 On the territory of the census date. | ||||||||||||||||||
1 In 2011 a large part of the population boycotted the nationality question as a sign of protest against government sponsored census.
The legal position of the minorities is defined foremost in the Act No. 273/2001 Coll. (The Rights of the Minorities Act) which implements the Charter of Fundamental Rights and Basic Freedoms, Framework Convention for the Protection of National Minorities and Recommendation of the Council of Europe No. 1201. There is a number of other enactments which to lesser extent deal with the minorities.
Special situation is in the case of Moravians and Silesians, who are frequently allocated within the group of Czechs when it comes to the statistical data.
Officially recognized minorities
Minorities, which "traditionally and on a long term basis live within the territory of the Czech Republic" enjoy some privileges. As of 2013 there are 14 such officially recognized minorities, which are (alphabetically): Belarusians, Bulgarians, Croatians, Germans, Greeks, Hungarians, Poles, Romanis, Russians, Rusyns, Serbians, Slovaks, Ukrainians and Vietnamese.[6]
Citizens belonging to the officially recognized minorities enjoy the right to "use their language in communication with authorities and in courts of law". Article 25 of the Czech Charter of Fundamental Rights and Basic Freedoms provides the right of the national and ethnic minorities to education and communication with authorities in their own language. Act No. 500/2004 Coll. (The Administrative Rule) in its paragraph 16 (4) (Procedural Language) provides that a citizen of the Czech Republic who belongs to a national or an ethnic minority, which traditionally and on a long-term basis lives within the territory of the Czech Republic, has the right to address an administrative agency and proceed before it in the language of the minority. In the case that the administrative agency does not have an employee with knowledge of the language, the agency is bound to obtain a translator at the agency's own expense. According to Act No. 273/2001 (About The Rights of Members of Minorities) paragraph 9 (The right to use language of a national minority in dealing with authorities and in the courts of law) the same also applies to members of national minorities in the courts of law.
Bulgarians
The economic migration of Bulgarians to the Czech Republic began in the 1990s. 4,363 citizens claimed to have Bulgarian nationality in the 2001 census. They mostly live in the large cities and towns, such as Prague, Brno, Ostrava, Karlovy Vary, Kladno, Ústí nad Labem, Děčín, and Havířov. Nowadays the newcomers from Bulgaria aim for these areas in particular, where they can join an already established community. Many of these economic immigrants have dual citizenship of both the Czech Republic and Bulgaria. However most of the recent immigrants still only have Bulgarian citizenship.
The Bulgarian Cultural Organisation publishes the magazine Roden Glas, while a folklore organisation Kytka promotes traditional Bulgarian dances. Among other organisations are Pirin, Zaedno, Vazraždane and Hyshove.[7]
As an officially recognized minority the Bulgarian citizens of the Czech Republic enjoy the right to use their language in communication with authorities and in the courts of law. They also enjoy a number of other rights connected to the status of recognized minority, e.g. the right to education in their own language: the first Bulgarian school in the current Czech Republic was established in 1946 in Prague.
Germans

The German minority of the Czech Republic, historically the largest minority of the country, was almost entirely removed when 3 million were forcibly expelled in 1945–6 on the basis of the Potsdam agreement. The constitution guarantees rights for minority languages, however there are 13 municipalities with German minority constituting 10% of population, which qualifies for such provisions.[9] There is no bilingual education system in Western and Northern Bohemia, where the German minority is mostly concentrated. However, this is in large part due to the absence of German-speaking youth, a heritage of the post-war policy of the Communist government.
According to the 2001 census there remain 13 municipalities and settlements in the Czech Republic with more than 10% Germans.[9]
Many representatives of expellees' organizations support the erection of bilingual signs in all formerly German-speaking territory as a visible sign of the bilingual linguistic and cultural heritage of the region, but their efforts are not supported by some of the current inhabitants, as the vast majority of the current population is not of German descent.
The German-Czech Declaration of 21 January 1997 covered the two most critical issues—the role of some Sudeten Germans in the breakup of Czechoslovakia in 1938 and their expulsion after World War II.[10]
Greeks
Another influential minority are Greeks. Large numbers of Greeks arrived in Czechoslovakia during the end of the Greek Civil War. The first transports of Greek children arrived in 1948 and 1949. Later, more transports, also including adults, arrived.[11] They were partly leftists, communists and guerillas with their relatives, hence the willingness of Czechoslovak government to allow the immigration.[12] This was viewed rather as a temporary solution. After the defeat of DSE and other left-wing guerillas, the Greeks stayed in Czechoslovakia. In total more than 12,000 Greeks immigrated to Czechoslovakia between 1948 and 1950.[12] Today, there are about 7000 Greeks in the country (3219 according to 2001 census data),[12] mostly in the 3 biggest towns – Prague, Brno, Ostrava – and also in Bohumín, Havířov, Jeseník, Karviná, Krnov, Šumperk, Třinec, Vrbno pod Pradědem and Žamberk (apart from the last one these towns are in Silesia).[13]
Poles
The most concentrated linguistic minority in the Czech Republic are ethnic Poles, historically the plurality, today constituting about 10% of the population of Karviná and Frýdek-Místek districts. Poles have the right to use their language in official dealings; the public media (Czech TV and Czech Radio) regularly broadcast in Polish; and there are many Polish primary and secondary schools in the area. The Polish minority has been decreasing substantially since World War II as education in Polish was difficult to obtain, while Czech authorities did not permit bilingual signs to maintain Polish awareness among the population.
The erection of bilingual signs has technically been permitted since 2001, if a minority constitutes 10% of the population of a municipality. The requirement that a petition be signed by the members of minority was cancelled, thus simplifying the whole process.[14] Still, only a couple of villages with large Polish minorities have bilingual signs (Vendryně/Wędrynia for instance).
Romanis
Another minority is the Roma, who nonetheless have very little influence on Czech policy. Around 90% of the Roma that lived in the Czech Republic prior to World War II were exterminated by the Nazi Porajmos. The Roma there now are 80% post-war immigrants from Slovakia or Hungary, or the descendants thereof. In total, the Roma in the CR now number around 200,000.[15] There is Romani press in the CR, written in both Czech and Romani, but Romani radio is broadcast in Czech and there is no Romani television. Romani is also absent from legislative, judiciary, and other political texts but it has recently entered some university and elementary school courses. Life expectancy, literacy, median wage, school enrolment, and other socio-economic markers remain low while, according to Říčan (1998), Roma compose the majority of prison and habitual offender populations despite accounting for only a fraction of a percent of Czech population.
Immigration

According to the 2011 census there were 543,000 permanent (i.e. legal) foreign residents in the Czech Republic (5% of the total population).[16] Residents from Ukraine are the largest group (118,000), followed by residents of Slovakia (84,000). There are also Asian minorities in the Czech Republic. The largest is the Vietnamese one (83,000 in 2011). During the communist era the governments of Czechoslovakia and Vietnam had a deal concerning the education of Vietnamese people in Czechoslovakia. Vietnamese people came to Czechoslovakia for the first time in 1956 and then the number of new migrants grew until the fall of communism. First generation Vietnamese work mostly as small-scale businessmen in markets. Still, many Vietnamese are without Czech citizenship. One of the towns with the largest Vietnamese communities is Cheb. There are also many people from Russia (36,000), Germany (21,000) and Poland (18,000).
- See also
- Armenians in the Czech Republic
- Chinese people in the Czech Republic
- Croats in the Czech Republic
- Germans in the Czech Republic
- Greeks in the Czech Republic
- History of the Jews in the Czech Republic
- Koreans in the Czech Republic
- Macedonians in the Czech Republic
- Mongolians in the Czech Republic
- Polish minority in the Czech Republic
- Romani people in the Czech Republic
- Slovaks in the Czech Republic
- Ukrainians in the Czech Republic
- Vietnamese people in the Czech Republic
Languages

The Czech language (divided into three dialects in Bohemia, four dialects in Moravia, and two dialects in Czech Silesia) is the official language of the state. There is also the transitional Cieszyn Silesian dialect as well as the Polish language in Cieszyn Silesia, both spoken in Czech Silesia. Various Sudeten German dialects are currently practically extinct: present Czech Germans speak mainly Czech or Standard German. Czech Sign Language is the language of most of the deaf community.
For other languages spoken in the Czech Republic, see the above section on officially recognised minorities.
Religion
| 1991 | 2001 | 2011 | ||||
|---|---|---|---|---|---|---|
| number | % | number | % | number | % | |
| Roman Catholic Church | 4,021,385 | 39.0 | 2,740,780 | 26.8 | 1,083,899 | 10.3 |
| Evangelical Church of Czech Brethren | 203,996 | 2.0 | 117,212 | 1.1 | 51,916 | 0.5 |
| Czechoslovak Hussite Church | 178,036 | 1.7 | 99,103 | 1.0 | 39,276 | 0.4 |
| Believers identified with another specific religion | 120,317 | 1.7 | 330,993 | 3.2 | 292,347 | 2.7 |
| Believers not identified with any specific religion | 707,649 | 6.7 | ||||
| No religion | 4,112,864 | 39.9 | 6,039,991 | 59.0 | 3,612,804 | 34.2 |
| No response, unknown | 1,665,617 | 16.2 | 901,981 | 8.8 | 4,774,323 | 45.2 |
| Total population | 10,302,215 | 10,230,060 | 10,562,214 | |||
Most of the Czech population prefer not to respond to religious questions in the Census (45.2%). Others claim to have no religion or that they are without religious affiliation (34.2%). In comparison, one in every five claims to have some personal belief (20.6%).
The largest denominations are Roman Catholicism, estimated at 10.3% of the population, Protestant (0.5%), Hussites (0.4%). Other organized religions, including non-organized believers, totalled about (9.4%) (as of Census 2011).
According to the most recent Eurobarometer Poll 2005,[22] 19% of Czech citizens responded that "they believe there is a God", whereas 50% answered that "they believe there is some sort of spirit or life force" and 30% that "they do not believe there is any sort of spirit, god, or life force"; the percentage of believers is thus the lowest of EU countries after Estonia with 16%.[23]
References
- ↑ "Czech Demographic Handbook 2007". Czech Statistical Office.
- ↑ "Total fertility rate by NUTS 3 region". Eurostat.
- ↑ "Postavení národnostních menšin" (in Czech). Retrieved 2010-12-01.
- ↑ Archived April 25, 2012, at the Wayback Machine.
- 1 2 In census people can leave the "nationality" field empty and they can also write down any nationality or ethnicity they want. Most Romani people fill in the Czech nationality. Thus, the real number of Romani in the country is estimated to be around 220,000. Petr Lhotka: Romové v České republice po roce 1989
- ↑ See Government Council for National Minorities, Belorussian and Vietnamese since 4 July 2013, see Česko má nové oficiální národnostní menšiny. Vietnamce a Bělorusy
- ↑ "Bulharská národnostní menšina" (in Czech). Vlada.cz. Retrieved 2010-11-30.
- ↑ Statistický lexikon obcí v Republice československé I. Země česká. Prague. 1934.
Statistický lexikon obcí v Republice československé II. Země moravskoslezská. Prague. 1935. - 1 2 Peter Josika: Mehrsprachig: Ein Faktor der Versöhnung at Prager Zeitung, 21 August 2007.
- ↑ Wolff, Stefan (2000). German minorities in Europe: ethnic identity and cultural belonging. Berghahn Books. p. 200. ISBN 978-1-57181-504-0.
- ↑ "Greeks in Czech Country". Dialogos-kpr.cz. Retrieved 2013-11-19.
- 1 2 3 Archived February 11, 2008, at the Wayback Machine.
- ↑ Vangelis Liolios. "Podkladové materiály pro Radu vlády pro národnostní menšiny o situaci řecké menšiny v České republice" (PDF) (in Czech). Dialogs-kpr.cz. Retrieved 2013-11-19.
- ↑ "Aktualności". www.polonica.cz. Retrieved 2013-11-19.
- ↑ "European Commission - Languages eac". Ec.europa.eu. 2011-01-13. Retrieved 2013-11-19.
- ↑ "Tab. 8.2 Population by citizenship and by regions" (PDF) (in Czech). Czso.cz. Retrieved 2013-11-19.
- ↑ "Europeans and their Languages" (PDF). Ec.europa.eu. Retrieved 2013-11-19.
- ↑ "Population by denomination and sex: as measured by 1921, 1930, 1950, 1991 and 2001 censuses" (PDF) (in Czech and English). Czech Statistical Office. Retrieved 2010-03-09.
- ↑ "Scitani lidu, domu a bytu 2001". Czso.cz. Retrieved 2013-11-19.
- ↑ "Tab 7.1 Population by religious belief and by municipality size groups" (PDF) (in Czech). Czso.cz. Retrieved 2013-11-19.
- ↑ "Tab 7.2 Population by religious belief and by regions" (PDF) (in Czech). Czso.cz. Retrieved 2013-11-19.
- ↑ "Eurobarometer on Social Values, Science and technology 2005 - page 11" (PDF). Retrieved 2007-05-05.
- ↑ "Social values, Science and Technology" (PDF). Eurobarometer. June 2005. Retrieved 2006-12-19.
External links
- Czech Statistical Office, state institution responsible to provide official data about Czech Republic
- Official European Union entry
| Officially recognized |
|
|---|---|
| Other | |