Demographics of Belarus

The demographics of Belarus is about the demographic features of the population of Belarus, including population growth, population density, ethnicity, education level, health, economic status, religious affiliations, and other aspects of the population. The ethnic majority in Belarus are called Belarusians.
Demographic trends
The population of Belarus suffered a dramatic decline during World War II, dropping from more than 9 million in 1940 to 7.7 million in 1951. It then resumed its long-term growth, rising to 10 million in 1999.[1] After that the population began a steady decline, dropping to 9.7 million in 2006-2007.[2] Originally a highly agrarian country with nearly 80% of its population in rural areas, Belarus has been undergoing a process of continuous urbanization. The share of its rural population decreased from 70% in 1959 to less than 30% in the 2000s.[3]
Population
- 9,608,058 (July 2014 est.)
- country comparison to the world: 93
Age structure
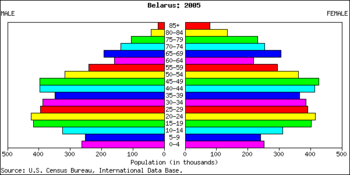
- 0-14 years: 15.4% (male 759,285/female 717,118)
- 15-24 years: 11.7% (male 575,907/female 544,170)
- 25-54 years: 45.5% (male 2,141,419/female 2,227,433)
- 55-64 years: 13.3% (male 562,639/female 716,216)
- 65 years and over: 14.2% (male 430,225/female 933,646) (2014 est.)
Median age
- Total: 39.4 years
- Male: 36.3 years
- Female: 42.4 years (2014 est.)
Sex ratio
- At birth: 1.06 male(s)/female
- 0-14 years: 1.06 male(s)/female
- 15-24 years: 1.06 male(s)/female
- 25-54 years: 0.96 male(s)/female
- 55-64 years: 0.87 male(s)/female
- 65 years and over: 0.46 male(s)/female
- Total population: 0.87 male(s)/female (2014 est.)
 |
 |
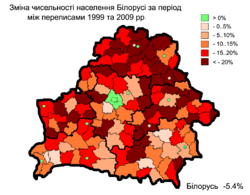 | ||
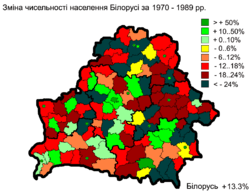
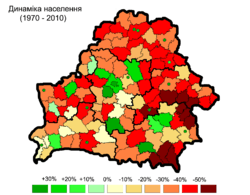
| 1970–1989 | 1970–2010 | 1999–2010 |
Vital statistics
Belarusian provinces of the Russian Empire
The figures below refer to the five governorates of the Russian Empire (Grodno, Vitebsk, Minsk, Mogilev, Vilna, ) with a Belarusian majority.[5]
| Average population (x 1000) | Live births | Deaths | Natural change | Crude birth rate (per 1000) | Crude death rate (per 1000) | Natural change (per 1000) | |
|---|---|---|---|---|---|---|---|
| 1900 | 9 009 | 393 612 | 222 350 | 171 262 | 43.7 | 24.7 | 19.0 |
| 1901 | 9 176 | 386 064 | 235 223 | 150 841 | 42.1 | 25.6 | 16.4 |
| 1902 | 9 328 | 408 209 | 220 421 | 187 788 | 43.8 | 23.6 | 20.1 |
| 1903 | 9 512 | 372 206 | 236 846 | 135 360 | 39.1 | 24.9 | 14.2 |
| 1904 | 9 676 | 387 501 | 236 530 | 150 971 | 40.0 | 24.4 | 15.6 |
| 1905 | 9 828 | 372 119 | 239 956 | 132 163 | 37.9 | 24.4 | 13.4 |
| 1906 | 10 004 | 381 101 | 210 556 | 170 545 | 38.1 | 21.0 | 17.0 |
| 1907 | 10 152 | 380 932 | 193 273 | 187 659 | 37.5 | 19.0 | 18.5 |
| 1908 | 10 373 | 363 095 | 204 611 | 158 484 | 35.0 | 19.7 | 15.3 |
| 1909 | 10 561 | 382 501 | 209 211 | 173 290 | 36.2 | 19.8 | 16.4 |
| 1910 | 10 725 | 371 091 | 224 884 | 146 207 | 34.6 | 21.0 | 13.6 |
| 1911 | 10 858 | 380 034 | 202 405 | 177 629 | 35.0 | 18.6 | 16.4 |
| 1912 | 11 072 | 387 594 | 188 434 | 199 160 | 35.0 | 17.0 | 18.0 |
| 1913 | 11 283 | 372 229 | 202 323 | 169 906 | 33.0 | 17.9 | 15.1 |
| 1914 | 11 587 | 384 682 | 210 515 | 174 167 | 33.2 | 18.2 | 15.0 |
After WW II [6][7]
| Average population (x 1000) | Live births | Deaths | Natural change | Crude birth rate (per 1000) | Crude death rate (per 1000) | Natural change (per 1000) | Total fertility rate | Abortions. reported | |
|---|---|---|---|---|---|---|---|---|---|
| 1950 | 7 745 | 197 200 | 62 000 | 135 200 | 25.5 | 8.0 | 17.5 | ||
| 1951 | 7 765 | 198 200 | 61 200 | 137 000 | 25.5 | 7.9 | 17.6 | ||
| 1952 | 7 721 | 191 100 | 64 200 | 126 900 | 24.8 | 8.3 | 16.4 | ||
| 1953 | 7 690 | 176 200 | 61 900 | 114 300 | 22.9 | 8.0 | 14.9 | ||
| 1954 | 7 722 | 193 100 | 61 600 | 131 500 | 25.0 | 8.0 | 17.0 | ||
| 1955 | 7 804 | 194 400 | 58 000 | 136 400 | 24.9 | 7.4 | 17.5 | ||
| 1956 | 7 880 | 199 500 | 56 000 | 143 500 | 25.3 | 7.1 | 18.2 | ||
| 1957 | 7 936 | 200 800 | 58 000 | 142 800 | 25.3 | 7.3 | 18.0 | ||
| 1958 | 8 009 | 207 700 | 53 700 | 154 000 | 25.9 | 6.7 | 19.2 | ||
| 1959 | 8 112 | 204 600 | 62 600 | 142 000 | 25.2 | 7.7 | 17.5 | ||
| 1960 | 8 190 | 200 218 | 54 037 | 146 181 | 24.4 | 6.6 | 17.8 | 2.80 | 170 787 |
| 1961 | 8 284 | 194 239 | 53 682 | 140 557 | 23.4 | 6.5 | 17.0 | 2.61 | 178 290 |
| 1962 | 8 385 | 185 302 | 60 676 | 124 626 | 22.1 | 7.2 | 14.9 | 2.57 | 185 554 |
| 1963 | 8 458 | 173 889 | 58 291 | 115 598 | 20.6 | 6.9 | 13.7 | 2.46 | 191 137 |
| 1964 | 8 519 | 161 794 | 53 967 | 107 827 | 19.0 | 6.3 | 12.7 | 2.36 | 200 534 |
| 1965 | 8 607 | 153 865 | 58 156 | 95 709 | 17.9 | 6.8 | 11.1 | 2.27 | 205 999 |
| 1966 | 8 709 | 153 414 | 58 265 | 95 149 | 17.6 | 6.7 | 10.9 | 2.28 | 203 430 |
| 1967 | 8 800 | 147 501 | 61 263 | 86 238 | 16.8 | 7.0 | 9.8 | 2.26 | 203 722 |
| 1968 | 8 877 | 146 095 | 62 354 | 83 741 | 16.5 | 7.0 | 9.4 | 2.23 | 198 955 |
| 1969 | 8 957 | 142 652 | 65 912 | 76 740 | 15.9 | 7.4 | 8.6 | 2.18 | 191 637 |
| 1970 | 9 038 | 146 676 | 68 974 | 77 702 | 16.2 | 7.6 | 8.6 | 2.30 | 187 935 |
| 1971 | 9 112 | 149 135 | 68 511 | 80 624 | 16.4 | 7.5 | 8.8 | 2.34 | 190 169 |
| 1972 | 9 178 | 147 813 | 71 866 | 75 947 | 16.1 | 7.8 | 8.3 | 2.36 | 185 101 |
| 1973 | 9 245 | 144 729 | 73 927 | 70 802 | 15.7 | 8.0 | 7.7 | 2.29 | 193 503 |
| 1974 | 9 312 | 146 876 | 73 181 | 73 695 | 15.8 | 7.9 | 7.9 | 2.24 | 194 247 |
| 1975 | 9 367 | 146 517 | 79 701 | 66 816 | 15.6 | 8.5 | 7.1 | 2.20 | 194 710 |
| 1976 | 9 411 | 147 912 | 82 400 | 65 512 | 15.7 | 8.8 | 7.0 | 2.16 | 199 121 |
| 1977 | 9 463 | 148 963 | 84 565 | 64 398 | 15.7 | 8.9 | 6.8 | 2.11 | 202 146 |
| 1978 | 9 525 | 151 053 | 86 612 | 64 441 | 15.9 | 9.1 | 6.8 | 2.08 | 201 619 |
| 1979 | 9 590 | 151 800 | 90 837 | 60 963 | 15.8 | 9.5 | 6.4 | 2.05 | 203 446 |
| 1980 | 9 658 | 154 432 | 95 514 | 58 918 | 16.0 | 9.9 | 6.1 | 2.04 | 201 852 |
| 1981 | 9 732 | 157 899 | 93 136 | 64 763 | 16.2 | 9.6 | 6.7 | 2.08 | 202 340 |
| 1982 | 9 804 | 159 364 | 93 840 | 65 524 | 16.3 | 9.6 | 6.7 | 2.02 | 198 011 |
| 1983 | 9 872 | 173 510 | 97 849 | 75 661 | 17.6 | 9.9 | 7.7 | 2.09 | 207 461 |
| 1984 | 9 938 | 168 749 | 104 274 | 64 475 | 17.0 | 10.5 | 6.5 | 2.14 | 210 844 |
| 1985 | 9 999 | 165 034 | 105 690 | 59 344 | 16.6 | 10.6 | 5.9 | 2.09 | 200 888 |
| 1986 | 10 058 | 171 611 | 97 276 | 74 335 | 17.1 | 9.7 | 7.4 | 2.10 | 171 114 |
| 1987 | 10 111 | 162 937 | 99 921 | 63 016 | 16.2 | 9.9 | 6.2 | 2.04 | 163 761 |
| 1988 | 10 144 | 163 193 | 102 671 | 60 522 | 16.1 | 10.1 | 6.0 | 2.031 | 140 921 |
| 1989 | 10 171 | 153 449 | 103 479 | 49 970 | 15.1 | 10.2 | 4.9 | 2.02 | 256 041 |
| 1990 | 10 190 | 142 167 | 109 582 | 32 585 | 14.0 | 10.8 | 3.2 | 1.91 | 260 839 |
| 1991 | 10 194 | 132 045 | 114 650 | 17 395 | 13.0 | 11.2 | 1.7 | 1.80 | 241 138 |
| 1992 | 10 217 | 127 971 | 116 674 | 11 297 | 12.5 | 11.4 | 1.1 | 1.76 | 240 387 |
| 1993 | 10 240 | 117 384 | 128 544 | -11 160 | 11.5 | 12.6 | -1.1 | 1.62 | 217 957 |
| 1994 | 10 227 | 110 599 | 130 003 | -19 404 | 10.8 | 12.7 | -1.9 | 1.53 | 212 533 |
| 1995 | 10 194 | 101 144 | 133 775 | -32 631 | 9.9 | 13.1 | -3.2 | 1.40 | 193 280 |
| 1996 | 10 160 | 95 798 | 133 422 | -37 624 | 9.4 | 13.1 | -3.7 | 1.33 | 174 098 |
| 1997 | 10 118 | 89 586 | 136 653 | -47 067 | 8.9 | 13.5 | -4.7 | 1.25 | 152 660 |
| 1998 | 10 069 | 92 645 | 137 296 | -44 651 | 9.2 | 13.6 | -4.4 | 1.30 | 145 339 |
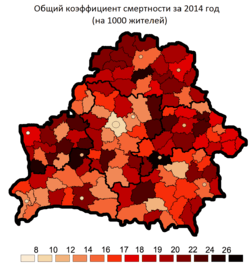
| 1999 | 10 032 | 92 975 | 142 027 | -49 052 | 9.3 | 14.2 | -4.9 | 1.31 | 135 829 |
| 2000 | 9 988 | 93 691 | 134 867 | -41 176 | 9.4 | 13.5 | -4.1 | 1.31 | 121 895 |
| 2001 | 9 929 | 91 720 | 140 299 | -48 579 | 9.2 | 14.1 | -4.9 | 1.28 | 101 402 |
| 2002 | 9 866 | 88 743 | 146 665 | -57 922 | 9.0 | 14.9 | -5.9 | 1.24 | 89 895 |
| 2003 | 9 797 | 88 512 | 143 200 | -54 688 | 9.0 | 14.6 | -5.6 | 1.23 | 80 174 |
| 2004 | 9 730 | 88 943 | 140 064 | -51 121 | 9.1 | 14.4 | -5.3 | 1.23 | 71 700 |
| 2005 | 9 664 | 90 508 | 141 857 | -51 349 | 9.4 | 14.7 | -5.3 | 1.25 | 64 655 |
| 2006 | 9 605 | 96 721 | 138 426 | -41 705 | 10.1 | 14.4 | -4.3 | 1.33 | 58 516 |
| 2007 | 9 561 | 103 626 | 132 993 | -29 367 | 10.8 | 13.9 | -3.1 | 1.42 | 46 287 |
| 2008 | 9 528 | 107 876 | 133 879 | -26 003 | 11.3 | 14.1 | -2.7 | 1.48 | 42 197 |
| 2009 | 9 507 | 109 263 | 135 056 | -25 793 | 11.5 | 14.2 | -2.7 | 1.50 | 35 967 |
| 2010 | 9 491 | 108 050 | 137 305 | -29 255 | 11.4 | 14.5 | -3.1 | 1.49 | 27 662 |
| 2011 | 9 473 | 109 147 | 135 099 | -25 952 | 11.5 | 14.3 | -2.7 | 1.51 | 26 858 |
| 2012 | 9 464 | 115 893 | 126 531 | -10 638 | 12.2 | 13.4 | -1.2 | 1.62 | |
| 2013 | 9 468 | 117 997 | 125 326 | -7 329 | 12.5 | 13.2 | -0.7 | 1.67 | |
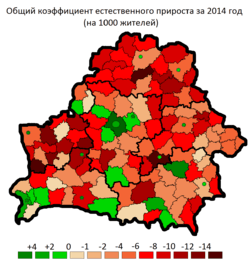
| 2014 | 9 469 | 118 534 | 121 542 | -3 008 | 12.5 | 12.8 | -0.3 | 1.69 | |
| 2015[8] | 9 481 | 119 509 | 120 130 | -621 | 12.6 | 12.7 | -0.1 | 1.72 |
Infant mortality rate
- Total: 4.0
 deaths/1,000 live births for 429 death. (2010)
 - Total: 3.9 deaths/1,000 live births for 422 death. (2011)
- Total: 3.4 deaths/1,000 live births for 386 death. (2012)
- Total: 3.5
 deaths/1,000 live births for 407 death. (2013)
 - Total: 3.5
 deaths/1,000 live births for 415 death. (2014)
- Total: 3.5 deaths/1,000 live births for 321 death. (January–September 2014)
- Total: 3.2 deaths/1,000 live births for 283 death. (January–September 2015)
Life expectancy at birth
- Total population: 72.15 years
- country comparison to the world: 138
- Male: 66.53 years
- Female: 78.1 years (2014 est.)
Demographic situation in 2015
| Top 10 cities with the highest birth rate | 2015 |
|---|---|
| Drybin | 20.7 |
| Brahin | 19.9 |
| Chachersk | 19.3 |
| Lahoysk | 19.0 |
| Logishin | 18.0 |
| Karma | 17.4 |
| Ivanava | 17.3 |
| Zhytkavichy | 17.0 |
| Obal | 16.8 |
| Slawharad | 16.7 |
| Zaslawye | 16.5 |
| Top 10 cities with the lowest birth rate | 2015 |
| Zarecha | 4.8 |
| Yanovichi | 4.9 |
| Vidzy | 5.3 |
| Horodyszcze | 6.2 |
| Damachava | 6.5 |
| Osveya | 6.6 |
| Lubcha | 7.2 |
| Vetrino | 7.3 |
| Kamaryn | 7.4 |
| Azarychy | 8.1 |
Natural increase current
Since the beginning of the year 2016 population of Belarus increased by 6 799 people during the period January–September. In January–September 2016, 89 434 babies were born in the country, which is 455 babies more than in January–September 2015[9]
-Number of births from January–September 2015 = ![]() 88,979
88,979
-Number of births from January–September 2016 = ![]() 89,434
89,434
Conversely the number of deaths during the same period was down by 1,825.
-Number of deaths from January-September 2015 = ![]() 90,741
90,741
-Number of deaths from January–September 2016 = ![]() 88,916
88,916
Total natural increase during January-September 2016 and January-September 2015.
Natural increase between January–September 2015 = ![]() -1,762
-1,762
Natural increase between January–September 2016 = ![]() 518
518
 |
 |
 | ||
| Birth rate (per 1000) | Death rate (per 1000) | Natural growth rate (per 1000) |
Ethnic groups
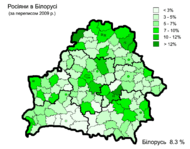
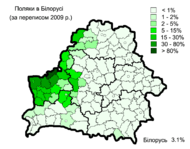
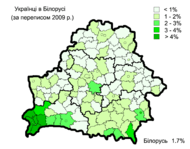
- Belarusians 81.2%, Russians 11.4%, Poles 3.9%, Ukrainians 2.4%, Jews 0.3%, Armenians 0.1%, Lipka Tatars 0.1%, Ruska Roma 0.1%, Lithuanians 0.1%, Azerbaijanis 0.1%, others 0.3% (1999 census).[1]
Prior to the Second World War
Prior to World War II, Jews were the second largest ethnic group in Belarus, and at 400,000 in the 1926 and 1939 censuses they even exceeded the number of Russians (although admittedly by a small margin).[10] Jews accounted for 7%-8% of the total population at that time, comprising more than 40% of the population in cities and towns, where Jews and Poles were the majority, while Belarusians mostly lived in rural areas.
The Poles were the fourth largest ethnic group in Belarussian SSR (current Eastern portion of Belarus), before World War II, comprising 1-2% of the population in the pre-war censuses (less than 100,000).[10]
| Ethnic group |
census 19261 | census 19392 | ||
|---|---|---|---|---|
| Number | % | Number | % | |
| Belarusians | 4,017,301 | 80.6 | 4,615,496 | 82.9 |
| Jews | 407,059 | 8.2 | 375,092 | 6.7 |
| Russians | 383,806 | 7.7 | 364,705 | 6.6 |
| Poles | 97,498 | 2.0 | 58,380 | 1.1 |
| Ukrainians | 34,681 | 0.7 | 104,247 | 1.9 |
| Germans | 7,075 | 0.1 | 8,448 | 0.2 |
| Latvians | 14,080 | 0.3 | 8,117 | 0.2 |
| Tatars | 3,777 | 0.1 | 7,664 | 0.1 |
| Lithuanians | 6,864 | 0.1 | 4,284 | 0.1 |
| Roma | 2,366 | 0.1 | 3,632 | 0.1 |
| Mordvins | 1,051 | 0.0 | 2,042 | 0.0 |
| Others | 7,682 | 0.2 | 16,887 | 0.3 |
| Total | 4,983,240 | 5,568,994 | ||
| 1 Source: . 2 Source: . | ||||
After the Second World War
The Holocaust decimated the Jewish population in Belarus, and after World War II, in 1959, Jews accounted for only 1.9% of the population. Since then, Jewish emigration to Israel and other countries reduced the number of Jews to 0.1% of the population (13,000 in 2009).
After the war, a large number of Poles (including Catholic Belarusians) were forced to move to Poland. In exchange, Belarusians from the former Belastok Voblast, which was returned to Poland in 1945, after being occupied in 1939 were displaced to Belarus. Due to changes in the western border of Belarus and Poland after World War II (see territorial changes of Poland), the number of Poles in Belarus increased to more than 500,000 according to the first post-war census (1959) and to about 400,000 according to the 1999 census. Poles are now the third largest ethnic group in Belarus (see Polish minority in Belarus). There are around 15,000 of Lipka Tatars and Ruska Roma (Russian Gypsies) who account for about 10,000 each.
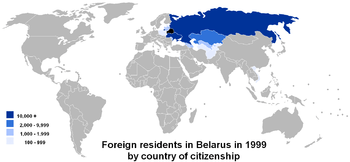
In the post-war period Belarus experienced an influx of workers from other parts of the Soviet Union, for example Russians and Ukrainians. The decade after independence saw a decline in the population of most of these minority groups, either by assimilation or emigration. The most significant exception to this trend has been a continued (if small-scale) net immigration of Armenians and Azeris, whose numbers increased from less than 2,000 in 1959 to around 10,000 in 1999.[1]
 |
 |
 |
 | |||
| Belarusian | Russians | Poles | Ukrainians |
| Ethnic group |
census 19591 | census 19702 | census 19793 | census 19894 | census 19995 | census 20096 | ||||||
|---|---|---|---|---|---|---|---|---|---|---|---|---|
| Number | % | Number | % | Number | % | Number | % | Number | % | Number | % | |
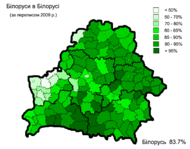
| Belarusians | 6,532,035 | 81.1 | 7,289,610 | 81.0 | 7,567,955 | 79.4 | 7,904,623 | 77.9 | 8,158,900 | 81.2 | 7,957,252 | 83.7 |
| Russians | 659,093 | 8.2 | 938,161 | 10.4 | 1,134,117 | 11.9 | 1,342,099 | 13.2 | 1,141,700 | 11.4 | 785,084 | 8.3 |
| Poles | 538,881 | 6.7 | 382,600 | 4.3 | 403,169 | 4.2 | 417,720 | 4.1 | 395,700 | 3.9 | 294,549 | 3.1 |
| Ukrainians | 133,061 | 1.7 | 190,839 | 2.1 | 230,985 | 2.4 | 291,008 | 2.9 | 237,000 | 2.4 | 158,723 | 1.7 |
| Jews | 150,084 | 1.9 | 148,011 | 1.6 | 135,450 | 1.4 | 111,975 | 1.1 | 27,800 | 0.3 | 12,926 | 0.1 |
| Armenians | 1,751 | 0.0 | 2,362 | 0.0 | 2,751 | 0.0 | 4,933 | 0.1 | 10,200 | 0.1 | 8,512 | 0.1 |
| Tatars | 8,650 | 0.1 | 9,992 | 0.1 | 10,851 | 0.1 | 12,436 | 0.1 | 10,100 | 0.1 | 7,316 | 0.1 |
| Romani | 4,662 | 0.1 | 6,843 | 0.1 | 8,408 | 0.1 | 10,762 | 0.1 | 9,900 | 0.1 | 7,316 | 0.1 |
| Azerbaijanis | 1,402 | 0.0 | 1,335 | 0.0 | 2,654 | 0.0 | 5,009 | 0.1 | 6,300 | 0.1 | 5,567 | 0.1 |
| Lithuanians | 8,363 | 0.1 | 8,092 | 0.1 | 6,993 | 0.1 | 7,606 | 0.1 | 6,400 | 0.1 | 5,087 | 0.1 |
| Others | 16,666 | 0.2 | 24,493 | 0.3 | 29,183 | 0.3 | 43,635 | 0.4 | 41,200 | 0.4 | 261,712 | 2.8 |
| Total | 8,054,648 | 9,002,338 | 9,532,516 | 10,151,806 | 10,045,200 | 9,503,807 | ||||||
| 1 Source: . 2 Source: . 3 Source: . 4 Source: . 5 Source: . 6 Source: . | ||||||||||||
Languages
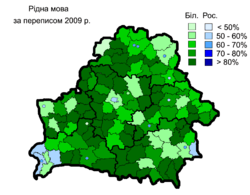
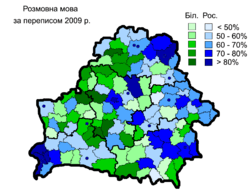
Belarusian and Russian are the official languages according to the Constitution of Belarus (Article 17). The constitution guarantees preservation of the cultural heritage of all ethnic minorities, including their languages (Article 15). Russian, and not Belarusian, is the dominant language in Belarus, spoken normally at home by 70% of the population (2009 census).
 |
 | |
| Native languages | Spoken languages |
Religion
According to 1997 estimates, 80% of the religious population belonged to the Eastern Orthodox Church and the others are mainly Roman Catholic, Greek Catholic, Protestants, Muslims, and Jews.[11]
Urbanization
- Urban population: 75% of total population (2011)
- Rate of urbanization: 0.21% annual rate of change (2010-15 est.)
See also
References
- 1 2 3 Ethnic composition of the population, 1999 Belarus Census.
- ↑ Population estimates 1995-2007, BelStat
- ↑ Statistical Yearbook of the Republic of Belarus 2007, BelStat, Minsk, 2007
- ↑ http://pop-stat.mashke.org/belarus-division.htm
- ↑ Statistical Yearbooks of the Russian Empire
- ↑ United Nations. Demographic Yearbooks
- ↑ National Statistical Committee of the Republic of Belarus
- ↑
- ↑
- 1 2 Ethnic composition of Belarus: 1926 and 1939 censuses
- ↑ https://www.cia.gov/library/publications/the-world-factbook/geos/bo.html
Belarus articles | |||||||
|---|---|---|---|---|---|---|---|
| History | .svg.png) | ||||||
| Geography | |||||||
| Politics | |||||||
| Economy | |||||||
| Society |
| ||||||
| |||||||