Demographics of Sweden
The demography of Sweden is monitored by Statistics Sweden (SCB). As of 31 December 2015, the population of Sweden was estimated to be 9.85 million people,[1] making it the 90th most populous country in the world.[2] The figure is projected to reach ten million in the course of 2016.[3] The three biggest cities are Stockholm, Gothenburg and Malmö. Approximately 85% of the country's population resides in its urban areas.[4]
| Historical populations | ||
|---|---|---|
| Year | Pop. | ±% p.a. |
| 1570 | 900,000 | — |
| 1650 | 1,225,000 | +0.39% |
| 1700 | 1,485,000 | +0.39% |
| 1720 | 1,350,000 | −0.48% |
| 1755 | 1,878,000 | +0.95% |
| 1815 | 2,465,000 | +0.45% |
| 1865 | 4,099,000 | +1.02% |
| 1900 | 5,140,000 | +0.65% |
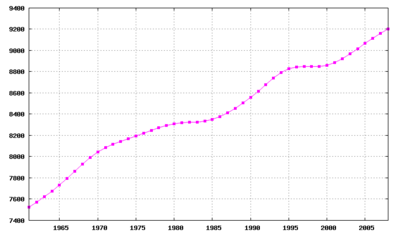
| 1970 | 8,081,142 | +0.65% |
| 1980 | 8,317,937 | +0.29% |
| 1990 | 8,562,000 | +0.29% |
| 2005 | 9,002,000 | +0.33% |
| 2010 | 9,348,000 | +0.76% |
| 2016 | 9,875,378 | +0.92% |
| Source: Historical figures - Sveriges land och folk,[5] Modern figures - Statistics Sweden [1] | ||
Population statistics
people/km²
At the housing and population census 1990 the Swedish population stood at 8 587 353 out of which 4 242 351 male and 4 345 002 female. According to a 2012 survey there were 1 473 256 foreign born within the country making up 15% of the population.[6] [7]
- Population: 9,644,864 (As of 2013)
- Annual population growth rate: 0.93% (As of 2013)
- Birth rate: 11.78 births/1,000 population (As of 2013 est.)
- Death rate: 9.37 deaths/1,000 population (As of 2013 est.)
- Net birth surplus rate: 2.40 deaths/1,000 population (As of 2013 est.)
- Net migration rate: 6.75 migrant(s)/1,000 population (As of 2013 est.)
- Total fertility rate: 1.94 children born/woman (2010 est.)
- Infant mortality rate: 2.75 deaths/1,000 live births (As of 2010 est.)
- Urbanisation: 85% of total population (As of 2010)
- Rate of urbanisation: 0.6% annual rate of change (2010-15 est.)
- Life expectancy at birth: 81.18 years
- Male: 78.86 years
- Female: 83.63 years (As of 2012 est.)
Sweden census 2005
The 2005 Swedish census showed an increase of 475,322 compared to the 1990 census, an average increase of 31,680 annually. During the 1990s, birth rate increased by more than 100,000 children per year while death rates fell and immigration surged. In the early 2000s, birth rate declined as immigration increased further, with the context of unrest in the Middle East, upholding steady population growth.[8]
Ethnicity
The majority of the population are Swedes. The Sweden Finns are a large ethnic minority comprising approximately 50,000 along the Swedish-Finnish border, and 450,000 first and second generation immigrated ethnic Finns, mainly living in the Mälaren Valley region. Meänkieli Finnish has official status in parts of northern Sweden near the Finnish border. In addition, Sweden's indigenous population groups includes the Sami people, historically a nomadic reindeer herding group that has been native to Fenno-Scandinavia for at least 5000 years.[9] Today, the Sami language holds the status of official minority language in four municipalities in the Norrbotten county.
Immigrants from the Middle East have been a rapidly growing share of Sweden’s population. According to the government agency Statistics Sweden, the number of Swedes born in all of Asia (including the Middle East) rose from just 1,000 in 1950 to 295,000 in 2003.[10] Most of those immigrants came from Iraq, Iran, Lebanon and Syria, according to Statistics Sweden.[10] A significant number of Syriac Christians have settled.
Additionally, the birth rate among immigrant women after arriving in Sweden is higher than among ethnic Swedes.[11] Taking into account the fact that immigrant women have on average fewer children than Swedish women of comparable age, the difference in total birth rate is only 0,1 children more if the woman is foreign born - with the disclaimer that some women may have children not immigrating to and not reported in Sweden who are not included in the statistics.[12]
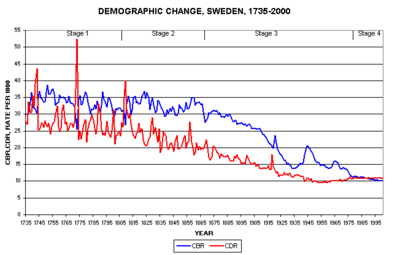
Vital statistics since 1900
Data according to Statistics Sweden, which collects the official statistics for Sweden.[13]
| Average population (× 1000) |
Live births | Deaths | Natural change | Crude birth rate (per 1000) | Crude death rate (per 1000) | Natural change (per 1000) | Fertility rates | |
|---|---|---|---|---|---|---|---|---|
| 1900 | 5 117 | 138 139 | 86 146 | 51 993 | 27.0 | 16.8 | 10.2 | 4,02 |
| 1901 | 5 156 | 139 370 | 82 772 | 56 598 | 27.0 | 16.1 | 11.0 | 4,04 |
| 1902 | 5 187 | 137 364 | 79 722 | 57 642 | 26.5 | 15.4 | 11.1 | 3,95 |
| 1903 | 5 210 | 133 896 | 78 610 | 55 286 | 25.7 | 15.1 | 10.6 | 3,82 |
| 1904 | 5 241 | 134 952 | 80 152 | 54 800 | 25.7 | 15.3 | 10.5 | 3,83 |
| 1905 | 5 278 | 135 409 | 82 443 | 52 966 | 25.7 | 15.6 | 10.0 | 3,83 |
| 1906 | 5 316 | 136 620 | 76 366 | 60 254 | 25.7 | 14.4 | 11.3 | 3,81 |
| 1907 | 5 357 | 136 793 | 78 149 | 58 644 | 25.5 | 14.6 | 10.9 | 3,77 |
| 1908 | 5 404 | 138 874 | 80 568 | 58 306 | 25.7 | 14.9 | 10.8 | 3,79 |
| 1909 | 5 453 | 139 505 | 74 538 | 64 967 | 25.6 | 13.7 | 11.9 | 3,71 |
| 1910 | 5 499 | 135 625 | 77 212 | 58 413 | 24.7 | 14.0 | 10.6 | 3,60 |
| 1911 | 5 542 | 132 977 | 76 462 | 56 515 | 24.0 | 13.8 | 10.2 | 3,49 |
| 1912 | 5 583 | 132 868 | 79 241 | 53 627 | 23.8 | 14.2 | 9.6 | 3,44 |
| 1913 | 5 621 | 130 200 | 76 724 | 53 476 | 23.2 | 13.6 | 9.5 | 3,32 |
| 1914 | 5 659 | 129 458 | 78 311 | 51 147 | 22.9 | 13.8 | 9.0 | 3,29 |
| 1915 | 5 696 | 122 997 | 83 587 | 39 410 | 21.6 | 14.7 | 6.9 | 3,06 |
| 1916 | 5 735 | 121 679 | 77 771 | 43 908 | 21.2 | 13.6 | 7.7 | 2,99 |
| 1917 | 5 779 | 120 855 | 77 385 | 43 470 | 20.9 | 13.4 | 7.5 | 2,93 |
| 1918 | 5 807 | 117 955 | 104 594 | 13 361 | 20.3 | 18.0 | 2.3 | 2,83 |
| 1919 | 5 830 | 115 193 | 84 289 | 30 904 | 19.8 | 14.5 | 5.3 | 2,72 |
| 1920 | 5 876 | 138 753 | 78 128 | 60 625 | 23.6 | 13.3 | 10.3 | 3,22 |
| 1921 | 5 929 | 127 723 | 73 536 | 54 187 | 21.5 | 12.4 | 9.1 | 2,93 |
| 1922 | 5 971 | 116 946 | 76 343 | 40 603 | 19.6 | 12.8 | 6.8 | 2,66 |
| 1923 | 5 997 | 113 435 | 68 424 | 45 011 | 18.9 | 11.4 | 7.5 | 2,55 |
| 1924 | 6 021 | 109 055 | 72 001 | 37 054 | 18.1 | 12.0 | 6.2 | 2,43 |
| 1925 | 6 045 | 106 292 | 70 918 | 35 374 | 17.6 | 11.7 | 5.9 | 2,34 |
| 1926 | 6 064 | 102 007 | 71 344 | 30 663 | 16.8 | 11.8 | 5.1 | 2,22 |
| 1927 | 6 081 | 97 994 | 77 219 | 20 775 | 16.1 | 12.7 | 3.4 | 2,11 |
| 1928 | 6 097 | 97 868 | 73 267 | 24 601 | 16.1 | 12.0 | 4.0 | 2,08 |
| 1929 | 6 113 | 92 861 | 74 538 | 18 323 | 15.2 | 12.2 | 3.0 | 1,95 |
| 1930 | 6 131 | 94 220 | 71 790 | 22 430 | 15.4 | 11.7 | 3.7 | 1,96 |
| 1931 | 6 152 | 91 074 | 77 121 | 13 953 | 14.8 | 12.5 | 2.3 | 1,88 |
| 1932 | 6 176 | 89 779 | 71 459 | 18 320 | 14.5 | 11.6 | 3.0 | 1,83 |
| 1933 | 6 201 | 85 020 | 69 607 | 15 413 | 13.7 | 11.2 | 2.5 | 1,72 |
| 1934 | 6 222 | 85 092 | 69 921 | 15 171 | 13.7 | 11.2 | 2.4 | 1,67 |
| 1935 | 6 242 | 85 906 | 72 813 | 13 093 | 13.8 | 11.7 | 2.1 | 1,70 |
| 1936 | 6 259 | 88 938 | 74 836 | 14 102 | 14.2 | 12.0 | 2.3 | 1,75 |
| 1937 | 6 276 | 90 373 | 75 392 | 14 981 | 14.4 | 12.0 | 2.4 | 1,77 |
| 1938 | 6 297 | 93 946 | 72 693 | 21 253 | 14.9 | 11.5 | 3.4 | 1,84 |
| 1939 | 6 326 | 97 380 | 72 876 | 24 504 | 15.4 | 11.5 | 3.9 | 1,90 |
| 1940 | 6 356 | 95 778 | 72 748 | 23 030 | 15.1 | 11.4 | 3.6 | 1,86 |
| 1941 | 6 389 | 99 727 | 71 910 | 27 817 | 15.6 | 11.3 | 4.4 | 1,92 |
| 1942 | 6 432 | 113 961 | 63 741 | 50 220 | 17.7 | 9.9 | 7.8 | 2,19 |
| 1943 | 6 491 | 125 392 | 66 105 | 59 287 | 19.3 | 10.2 | 9.1 | 2,41 |
| 1944 | 6 560 | 134 991 | 72 284 | 62 707 | 20.6 | 11.0 | 9.6 | 2,61 |
| 1945 | 6 636 | 135 373 | 71 901 | 63 472 | 20.4 | 10.8 | 9.6 | 2,63 |
| 1946 | 6 719 | 132 597 | 70 635 | 61 962 | 19.7 | 10.5 | 9.2 | 2,57 |
| 1947 | 6 803 | 128 779 | 73 579 | 55 200 | 18.9 | 10.8 | 8.1 | 2,50 |
| 1948 | 6 883 | 126 683 | 67 693 | 58 990 | 18.4 | 9.8 | 8.6 | 2,47 |
| 1949 | 6 956 | 121 272 | 69 537 | 51 735 | 17.4 | 10.0 | 7.4 | 2,39 |
| 1950 | 7 014 | 115 414 | 70 296 | 45 118 | 16.5 | 10.0 | 6.4 | 2,28 |
| 1951 | 7 073 | 110 168 | 69 799 | 40 369 | 15.6 | 9.9 | 5.7 | 2,20 |
| 1952 | 7 125 | 110 192 | 68 270 | 41 922 | 15.5 | 9.6 | 5.9 | 2,22 |
| 1953 | 7 171 | 110 144 | 69 553 | 40 591 | 15.4 | 9.7 | 5.7 | 2,25 |
| 1954 | 7 213 | 105 096 | 69 030 | 36 066 | 14.6 | 9.6 | 5.0 | 2,18 |
| 1955 | 7 262 | 107 305 | 68 634 | 38 671 | 14.8 | 9.5 | 5.3 | 2,25 |
| 1956 | 7 315 | 107 960 | 70 205 | 37 755 | 14.8 | 9.6 | 5.2 | 2,29 |
| 1957 | 7 364 | 107 168 | 73 132 | 34 036 | 14.6 | 9.9 | 4.6 | 2,29 |
| 1958 | 7 409 | 105 502 | 71 065 | 34 437 | 14.2 | 9.6 | 4.6 | 2,26 |
| 1959 | 7 446 | 104 743 | 70 889 | 33 854 | 14.1 | 9.5 | 4.5 | 2,29 |
| 1960 | 7 480 | 102 219 | 75 093 | 27 126 | 13.7 | 10.0 | 3.6 | 2,17 |
| 1961 | 7 520 | 104 501 | 73 555 | 30 946 | 13.9 | 9.8 | 4.1 | 2,21 |
| 1962 | 7 562 | 107 284 | 76 791 | 30 493 | 14.2 | 10.2 | 4.0 | 2,25 |
| 1963 | 7 604 | 112 903 | 76 460 | 36 443 | 14.8 | 10.1 | 4.8 | 2,33 |
| 1964 | 7 661 | 122 664 | 76 661 | 46 003 | 16.0 | 10.0 | 6.0 | 2,47 |
| 1965 | 7 734 | 122 806 | 78 194 | 44 612 | 15.9 | 10.1 | 5.8 | 2,39 |
| 1966 | 7 808 | 123 354 | 78 440 | 44 914 | 15.8 | 10.0 | 5.8 | 2,37 |
| 1967 | 7 868 | 121 360 | 79 783 | 41 577 | 15.4 | 10.1 | 5.3 | 2,28 |
| 1968 | 7 914 | 113 087 | 82 476 | 30 611 | 14.3 | 10.4 | 3.9 | 2,07 |
| 1969 | 7 968 | 107 622 | 83 352 | 24 270 | 13.5 | 10.5 | 3.0 | 1,94 |
| 1970 | 8 043 | 110 150 | 80 026 | 30 124 | 13.7 | 9.9 | 3.7 | 1,94 |
| 1971 | 8 098 | 114 484 | 82 717 | 31 767 | 14.1 | 10.2 | 3.9 | 1,98 |
| 1972 | 8 122 | 112 273 | 84 051 | 28 222 | 13.8 | 10.3 | 3.5 | 1,93 |
| 1973 | 8 137 | 109 663 | 85 640 | 24 023 | 13.5 | 10.5 | 3.0 | 1,88 |
| 1974 | 8 161 | 109 874 | 86 316 | 23 558 | 13.5 | 10.6 | 2.9 | 1,91 |
| 1975 | 8 193 | 103 632 | 88 208 | 15 424 | 12.6 | 10.8 | 1.9 | 1,78 |
| 1976 | 8 222 | 98 345 | 90 677 | 7 668 | 12.0 | 11.0 | 0.9 | 1,70 |
| 1977 | 8 252 | 96 057 | 88 202 | 7 855 | 11.6 | 10.7 | 1.0 | 1,64 |
| 1978 | 8 276 | 93 248 | 89 681 | 3 567 | 11.3 | 10.8 | 0.4 | 1,61 |
| 1979 | 8 294 | 96 255 | 91 074 | 5 181 | 11.6 | 11.0 | 0.6 | 1,66 |
| 1980 | 8 310 | 97 064 | 91 800 | 5 264 | 11.7 | 11.0 | 0.6 | 1,69 |
| 1981 | 8 320 | 94 065 | 92 034 | 2 031 | 11.3 | 11.1 | 0.2 | 1,63 |
| 1982 | 8 325 | 92 748 | 90 671 | 2 077 | 11.1 | 10.9 | 0.2 | 1,60 |
| 1983 | 8 329 | 91 780 | 90 791 | 989 | 11.0 | 10.9 | 0.1 | 1,61 |
| 1984 | 8 337 | 93 889 | 90 483 | 3 406 | 11.3 | 10.9 | 0.4 | 1,66 |
| 1985 | 8 350 | 98 463 | 94 032 | 4 431 | 11.8 | 11.3 | 0.5 | 1,74 |
| 1986 | 8 370 | 101 950 | 93 295 | 8 655 | 12.2 | 11.1 | 1.0 | 1,79 |
| 1987 | 8 398 | 104 699 | 93 307 | 11 392 | 12.5 | 11.1 | 1.4 | 1,84 |
| 1988 | 8 437 | 112 080 | 96 743 | 15 337 | 13.3 | 11.5 | 1.8 | 1,96 |
| 1989 | 8 493 | 116 023 | 92 110 | 23 913 | 13.7 | 10.8 | 2.8 | 2,02 |
| 1990 | 8 559 | 123 938 | 95 161 | 28 777 | 14.5 | 11.1 | 3.4 | 2,14 |
| 1991 | 8 617 | 123 737 | 95 202 | 28 535 | 14.4 | 11.0 | 3.3 | 2,12 |
| 1992 | 8 668 | 122 848 | 94 710 | 28 138 | 14.2 | 10.9 | 3.2 | 2,09 |
| 1993 | 8 719 | 117 998 | 97 008 | 20 990 | 13.5 | 11.1 | 2.4 | 2,00 |
| 1994 | 8 781 | 112 257 | 91 844 | 20 413 | 12.8 | 10.5 | 2.3 | 1,90 |
| 1995 | 8 831 | 103 326 | 96 910 | 6 416 | 11.7 | 11.0 | 0.7 | 1,74 |
| 1996 | 8 843 | 95 297 | 94 133 | 1 164 | 10.8 | 10.6 | 0.1 | 1,61 |
| 1997 | 8 846 | 89 171 | 92 674 | -3 503 | 10.1 | 10.5 | -0.4 | 1,52 |
| 1998 | 8 851 | 88 384 | 92 891 | -4 507 | 10.0 | 10.5 | -0.5 | 1,51 |
| 1999 | 8 858 | 88 173 | 94 726 | -6 553 | 10.0 | 10.7 | -0.7 | 1,50 |
| 2000 | 8 872 | 90 441 | 93 285 | -2 844 | 10.2 | 10.5 | -0.3 | 1,54 |
| 2001 | 8 896 | 91 466 | 93 752 | -2 286 | 10.3 | 10.5 | -0.3 | 1,57 |
| 2002 | 8 925 | 95 815 | 95 009 | 806 | 10.7 | 10.6 | 0.1 | 1,65 |
| 2003 | 8 958 | 99 157 | 92 961 | 6 196 | 11.1 | 10.4 | 0.7 | 1,71 |
| 2004 | 8 994 | 100 928 | 90 532 | 10 396 | 11.2 | 10.1 | 1.2 | 1.75 |
| 2005 | 9 030 | 101 346 | 91 710 | 9 636 | 11.2 | 10.2 | 1.1 | 1.77 |
| 2006 | 9 081 | 105 913 | 91 177 | 14 736 | 11.7 | 10.0 | 1.6 | 1.85 |
| 2007 | 9 148 | 107 421 | 91 729 | 15 692 | 11.7 | 10.0 | 1.7 | 1.88 |
| 2008 | 9 220 | 109 301 | 91 449 | 17 852 | 11.9 | 9.9 | 1.9 | 1.91 |
| 2009 | 9 299 | 111 801 | 90 080 | 21 721 | 12.0 | 9.7 | 2.3 | 1.94 |
| 2010 | 9 378 | 115 641 | 90 487 | 25 154 | 12.3 | 9.6 | 2.7 | 1.98 |
| 2011 | 9 449 | 111 770 | 89 938 | 21 832 | 11.8 | 9.5 | 2.3 | 1.90 |
| 2012 | 9 519 | 113 177 | 91 938 | 21 239 | 11.9 | 9.7 | 2.2 | 1.91 |
| 2013 | 9 644 | 113 593 | 90 402 | 23 191 | 11.8 | 9.4 | 2.4 | 1.89 |
| 2014 | 9 747 | 114 907 | 88 976 | 25 931 | 11.9 | 9.2 | 2.7 | 1.88 |
| 2015 | 9 851 | 114 870 | 90 907 | 23 963 | 11.7 | 9.3 | 2.4 | 1.85 |
| 2016 JS | 9 954 | 91 001 | 67 382 | 23 619 |
JS = January 2016 - September 2016
Current vital statistics [14]
Number of births :
- from January to September 2015 =
 88,281
 - from January to September 2016 =
 90,986
Number of deaths :
- from January to September 2015 =
 68,291
 - from January to September 2016 =
 67,176
Natural increase :
- from January to September 2015 = 19,990
- from January to September 2016 = 23,810
Population projections
Statistics Sweden projects the following population development in Sweden:[1]
| Year | Projection |
|---|---|
| 2014 | 9,751,329 |
| 2020 | 10,269,319 |
| 2030 | 10,727,419 |
| 2040 | 11,008,064 |
| 2050 | 11,342,891 |
| 2060 | 11,656,852 |
| 2070 | 11,953,578 |
| 2080 | 12,304,896 |
| 2090 | 12,656,802 |
| 2100 | 13,043,901 |
| 2110 | 13,388,925 |
Eurostat projects a population in Sweden reaching 10,382,000 people in 2035 and 10,875,000 in 2060.[15]
Migration
Immigration
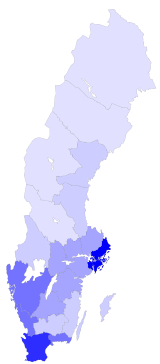
As of 2011, Statistics Sweden reported, around 1,858,000 or 19.6% inhabitants of Sweden were from a foreign background: that is, each such person either had been born abroad or had been born in Sweden to two parents who themselves had both been born abroad.[16]
Demographics
According to Eurostat, in 2010, there were 1.33 million foreign-born residents in Sweden, corresponding to 14.3% of the total population. Of these, 859,000 (64.3%) were born outside the EU and 477,000 (35.7%) were born in another EU Member State.[17][18]
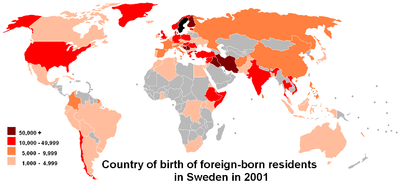
The ten largest groups of foreign-born persons in the Swedish civil registry in 2015 were:[19]
-
 Finland (156,045)
 -
 Iraq (131,888)
 -
 Syria (98,216)
 -
 Poland (85,517)
 -
 Iran (69,067)
 -
 Former Yugoslavia (67,190)
 -
 Somalia (60,623)
 -
 Bosnia and Herzegovina (57,705)
 -
 Germany (49,586)
 -
 Turkey (46,373)
The seven successor states of Yugoslavia (Slovenia, Croatia, Bosnia, Serbia, Macedonia, Kosovo and Montenegro) have a combined population of 165,239 persons residing in Sweden which would make them the largest foreign-born group if counted as one group.
The ten fastest growing groups of foreign-born residents in Sweden between 2014 and 2015 were the following nationalities:[20]
- Syria (+30,545)
-
 Eritrea (+6,789)
 - Poland (+3,820)
-
 Afghanistan (+2,824)
 - Somalia (+2,717)
- Iraq (+1,710)
-
 Romania (+1.692)
 -
 India (+1,308)
 -
 Croatia (+1,005)
 -
 Serbia (+1,002)
The growth largely reflects refugee and asylee resettlement (Syria, Eritrea, Somalia, Afghanistan, Iraq) and economic migration from the rest of the EU (Poland, Romania & Croatia).
History
- World War II
Immigration increased markedly with World War II. Historically, the most numerous of foreign born nationalities are ethnic Germans from Germany and other Scandinavians from Denmark and Norway. In short order, 70,000 war children were evacuated from Finland, of which 15,000 remained in Sweden. Also, many of Denmark's nearly 7,000 Jews who were evacuated to Sweden decided to remain there.
A sizable community from the Baltic States (Estonia, Latvia and Lithuania) arrived during the Second World War.[21]
- 1945 to 1967
During the 1950s and 1960s, the recruitment of immigrant labour was an important factor of immigration. The Nordic countries signed a trade agreement in 1952, establishing a common labour market and free movement across borders. This migration within the Nordic countries, especially from Finland to Scandinavia, was essential to create the tax-base required for the expansion of the strong public sector now characteristic of Scandinavia. This continued until 1967, when the labour market became saturated, and Sweden introduced new immigration controls.
On a smaller scale, Sweden took in political refugees from Hungary and the former Czechoslovakia after their countries were invaded by the Soviet Union in 1956 and 1968 respectively.
Contemporary immigration
Since the early 1970s, immigration to Sweden has been mostly due to refugee migration and family reunification from countries in the Middle East and Latin America.[22]
The first group of Assyrians/Syriacs moved to Sweden from Lebanon in 1967. Many of them live in Södertälje (Stockholm).[23][24] There are also around 40,000 Roma in Sweden.[25]
Immigration of Iraqis increased dramatically during the Iraq War, during 2003 to 2007. A total of 8,951 Iraqis came to Sweden in 2006, accounting for 45% of the entire Iraqi migration to Europe. By 2007, the community of Iraqis in Sweden numbered above 70,000. In 2008, Sweden introduced tighter rules on asylum seekers.[26]
Emigration
In the 19th century, Sweden's yearly population growth rate peaked at 1.2% (i.e. it doubled in less than 60 years), compared to 1% today (migration excluded). This considerable population growth rate led, before the Industrial Revolution, to a pauperisation of the rural population, for each generation inherited smaller and smaller shares. Due to years of crop failure in the 1840s and 1860s, the U.S. Homestead Act of 1862, and to a lesser extent religious persecution, emigration started and grew. Between 1850 and 1930 1,050,000 Swedes emigrated (re-migration excluded), chiefly to Canada, U.S. and to Denmark. If they had not left, Sweden's population would have been about 2,000,000 higher today, assuming famine and civil war would not have resulted from their staying. (After 1929 the net-migration has been directed towards Sweden.)
The re-migration of Swedish nationals from the U.S. was culturally more important than the absolute figures reveal. The re-migrants often re-settled in their native parish, where their relative wealth and foreign experience ensured a prestigious position in the community. U.S. views, values and not the least world-view followed the re-migrants, ensuring a popular perception of closeness to U.S., contrary to the situation in for instance neighbouring Denmark or Finland (and contrary to the Swedish elite's closeness to Germany and Continental Europe).
Language
The Swedish language is by far the dominating language in Sweden, and is used by the government administration.
Since 1999, Sweden has five officially recognised minority languages: Sami, Meänkieli, Standard Finnish, Romani chib and Yiddish.
The Sami language, spoken by about 7,000 people in Sweden, may be used in government agencies, courts, preschools and nursing homes in the municipalities of Arjeplog, Gällivare, Jokkmokk and Kiruna and its immediate neighbourhood.
Similarly, Finnish and Meänkieli can be used in the municipalities of Gällivare, Haparanda, Kiruna, Pajala and Övertorneå and its immediate neighbourhood. Finnish is also official language, along with Swedish, in the city of Eskilstuna.
During the mid to late 20th century, immigrant communities brought other languages, among others being Turkish, Serbo-Croatian, Arabic, Neo-Aramaic.[27]
Religion
The majority (66%) of the population belongs to the Church of Sweden,[28] the Lutheran church that was disestablished in 2000. This is because until 1996, those who had family members in the church automatically became members at birth. Other Christian denominations in Sweden include the Roman Catholic Church (see Catholic Church of Sweden), several Orthodox churches in diaspora, Baptist, Pentecostal, Neo-pietistic (nyevangeliska) and other evangelical Christian churches (frikyrkor = "free churches"). Shamanism persisted among the Sami people up until the 18th century, but no longer exists in its traditional form as most Sami today belong to the Lutheran church.
Jews were permitted to practice their religion in five Swedish cities in 1782, and have enjoyed full rights as citizens since 1870. The new Freedom of Religion Bill was passed in 1951, and former obstacles against Non-Lutherans working in schools and hospitals were removed. Further, that bill made it legal to leave any religious denomination, without entering another. There are also a number of Muslims, Buddhists, and Bahá'í in Sweden, mainly from immigration.
See also
- Statistics Sweden
- Municipalities of Sweden
- Demographical center of Sweden
- Immigration to Europe
- List of countries by immigrant population
- Aging of Europe
References
- 1 2 3 "Statistikdatabasen". Statistics Sweden. Retrieved 12 June 2016.
- ↑ "U.S. & World Population Clocks". Census.gov. Retrieved 2014-03-06.
- ↑ "Tio miljoner svenskar nästa år enligt ny prognos". Epoch Times Sverige. Retrieved 2016-10-29.
- ↑ Svanström, Stefan. "Varannan svensk bor nära havet". Retrieved 6 March 2014.
- ↑ Gustav Sundbärg, Sveriges land och folk (1901), page 90.
- ↑ http://www.scb.se/sv_/Hitta-statistik/Artiklar/Fortsatt-okning-av-utrikes-fodda-i-Sverige/
- ↑ Befolkningsstatistik. "Största folkökningen på nästan 70 år". Retrieved 6 March 2014.
- ↑ http://unstats.un.org/unsd/censuskb/article.aspx?id%3D10161. Retrieved March 21, 2010. Missing or empty
|title=(help) http://unstats.un.org/unsd/demographic/meetings/egm/Symposium2001/docs/symposium_13.htm Note Second link is as accessed November 2011: Only a paper "The 2005 population and housing census in Sweden will be totally register-based" on how the census was done, no information on results. - ↑ Broadbent, Noel (March 16, 2010). Lapps and Labyrinths: Saami Prehistory, Colonisation, and Cultural Resilience. Smithsonian Institution Scholarly Press. p. 304. ISBN 978-0-9788460-6-0.
- 1 2 P. 96, Immigration and emigration in the postwar period, Yugoslav immigration was substantial.Statistics Sweden 2004 http://www.scb.se/statistik/_publikationer/BE0701_1950I02_BR_BE51ST0405.pdf
- ↑ Statistics Sweden, 2008 http://www.scb.se/sv_/Hitta-statistik/Publiceringskalender/Visa-detaljerad-information/?publobjid=9030++
- ↑ "Får utrikes födda fler barn?". Statistiska Centralbyrån. Retrieved 2016-10-29.
- ↑ Statistics Sweden
- ↑ "Population Statistics". Statistics Sweden. Statistics of Sweden. Retrieved 9 November 2016.
- ↑ "From 2015, deaths projected to outnumber births in the EU27". Eurostat Commission. Retrieved 14 March 2014.
- ↑ http://www.scb.se/Pages/TableAndChart____26041.aspx Foreign background include foreign-born and Swedish-born with two foreign-born parents
- ↑ 6.5% of the EU population are foreigners and 9.4% are born abroad, Eurostat, Katya VASILEVA, 34/2011.
- ↑ http://www.ssd.scb.se/databaser/makro/SaveShow.asp
- ↑ "Befolkning efter födelseland och ursprungsland 31 december 2012" (in Swedish). Statistics Sweden. 31 December 2013. Retrieved 22 December 2013.
- ↑ "Invandring till Sverige 2015 och 2014 efter de 20 vanligaste födelseländerna". Statistics Sweden. Retrieved 19 March 2016.
- ↑ The Swedish Integration Board (2006). Pocket Facts: Statistics on Integration. Integrationsverket, 2006. ISBN 91-89609-30-1. Available online in pdf format. Retrieved 14 February 2007.
- ↑ Sweden: Restrictive Immigration Policy and Multiculturalism, Migration Policy Institute, 2006.
- ↑ Assyrians/Syriacs in Sweden (Swedish)
- ↑ K. Nordgren, Who Does History Belong To? History as Consciousness, Culture and Action in Multicultural Sweden, Karlstad University, Sweden, 2006. (Swedish)
- ↑ Romani people in Sweden
- ↑ "Sweden tightens rules on Iraqi asylum seekers". reuters.com. 2007-07-06. Retrieved 2010-12-14.
- ↑ "Sweden". Ethnologue. 1999-02-19. Retrieved 2013-10-03.
- ↑ Church of Sweden: Svenska kyrkans medlemsutveckling år 1972-2012
External links
- Population Statistics – in English
- Statistics Sweden – Official Data Base
Sweden articles | |||||||
|---|---|---|---|---|---|---|---|
| History |  | ||||||
| Geography | |||||||
| Politics | |||||||
| Economy | |||||||
| Society |
| ||||||
| |||||||
| Wikimedia Commons has media related to Demographics of Sweden. |