Demographics of Lithuania
This article is about the demographic features of the population of Lithuania, including population density, ethnicity, level of education, health, economic status, and religious affiliations.
Prehistory
The earliest evidence of inhabitants in present-day Lithuania dates back to 10,000 BC. Between 3000–2000 BC, the cord-ware culture people spread over a vast region of eastern Europe, between the Baltic Sea and the Vistula River in the West and the Moscow–Kursk line in the East. Merging with the indigenous peoples, they gave rise to the Balts, a distinct Indo-European ethnic group whose descendants are the present-day Lithuanian and Latvian nations and the former Old Prussians.
Historical demographics
Grand Duchy of Lithuania
- See also: Demographics and Languages of Grand Duchy of Lithuania, Demographics of the Polish–Lithuanian Commonwealth

The name of Lithuania – Lithuanians – was first mentioned in 1009. Among its etymologies there are a derivation from the word Lietava, for a small river, a possible derivation from a word leičiai, but most probable is the name for union of Lithuanian ethnic tribes ('susilieti, lietis' means to unite and the word 'lietuva' means something which has been united).
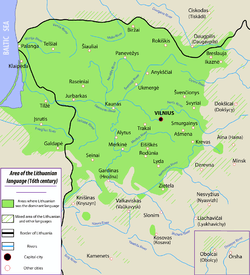
The primary Lithuanian state, the Duchy of Lithuania, emerged in the territory of Lietuva, the ethnic homeland of Lithuanians. At the birth of the Grand Duchy of Lithuania (GDL), ethnic Lithuanians made up about 70% of the population.[1] With the acquisition of new Ruthenian territories, this proportion decreased to 50% and later to 30%. By the time of the largest expansion towards Kievan Rus' lands, at the end of the 13th and during the 14th century, the territory of the GDL was about 800,000 km2, of which 10% was ethnically Lithuanian.[2] The ethnic Lithuanian population is estimated to have been 420,000 out of 1.4 million in 1375 (the territory was about 700,000 km2), and 550,000 out of 3.8 million in 1490 (territory: 850,000 km2)[3] Ruthenians were only nowadays Ukrainians and the whole Belarus including Smolensk and Mozhaisk Galindians were of Lithuanian ethnicity (belonging to the same family as Prussians or Latvians). In addition to the Ruthenians and Lithuanians, other significant ethnic groups throughout GDL were Jews and Tatars. The combined population of Poland and GDL in 1493 is estimated as 7.5 million, of whom 3.25 million were Poles, 3.75 million Ruthenians and 0.5 million Lithuanians.[4] With the Union of Lublin Lithuanian Grand Duchy lost large part of lands to the Polish Crown (see demographics of the Polish–Lithuanian Commonwealth). An ethnic Lithuanian proportion being about 1/4 in GDL after the Union of Lublin was held till the partitions. There was much devastation and population loss throughout the GDL in the mid and late 17th century,[5] including the ethnic Lithuanian population in Vilnius voivodeship. Besides devastation, the Ruthenian population declined proportionally after the territorial losses to the Russian Empire. In 1770 there were about 4.84 million inhabitants in GDL, of which the largest ethnic group were Ruthenians, about 1.39 million – Lithuanians.[1] The voivodeships with a majority ethnic Lithuanian population were Vilnius, Trakai and Samogitian voivodeships, and these three voivodeships comprised the political center of the state. In the southern angle of Trakai voivodeship and south-eastern part of Vilnius voivodeship there were also many Belarusians; in some of the south-eastern areas they were the major linguistic group.
The Ruthenian population formed a majority in GDL from the time of the GDL's expansion in the mid 14th century; and the adjective "Lithuanian", besides denoting ethnic Lithuanians, from early times denoted any inhabitant of GDL, including Slavs and Jews.
The Ruthenian language, corresponding to today's Belarusian and Ukrainian, was then called Russian, and was used as one of the chancellery languages by Lithuanian monarchs. However, there are fewer extant documents written in this language than those written in Latin and German from the time of Vytautas. Later, Ruthenian became the main language of documentation and writing. In the years that followed, it was the main language of government until the introduction of Polish as the chancellery language of the Lithuanian–Polish Commonwealth in 1697; however there are also examples of documents written in Ruthenian from the second half of the 18th century.[6] The Lithuanian language was used orally in Vilnius, Trakai and Samogitian voivodeships, and by small numbers of people elsewhere. At the court of Zygmunt August, the last king of the Duchy, both Polish and Lithuanian were spoken.[7]
Russian Empire
After the Third Partition of the Polish–Lithuanian Commonwealth on October 24, 1795, between the Russian Empire, the Kingdom of Prussia and Habsburg Austria, the Commonwealth ceased to exist and Lithuania became a part of the Russian empire. After the abolition of serfdom in 1861, the use of the Polish language noticeably increased in eastern Lithuania and western Belarus.[2] Many Lithuanians, living further east, were unable to receive the Lithuanian printed books smuggled into Lithuania by knygnešiai during the time of the ban on printing books in the Latin alphabet, and they switched to Polish. Although this also used the Latin alphabet, it was much less affected by the ban, because Polish was still used by the politically important class of the nobility, and also used predominantly in the biggest towns of Lithuania, and supported by the church.
National Revival
The Lithuanian National Revival had begun to intensify by the end of the 19th century, and the number of Lithuanian speakers and people identifying themselves as ethnic Lithuanians started to increase; but at the same time many Polish speaking Lithuanians, especially former szlachta, cut themselves adrift from the Lithuanian nation. There were population losses due to several border changes, Soviet deportations, the Holocaust of the Lithuanian Jews, and German and Polish repatriations during and after World War II. After World War II, the ethnic Lithuanian population remained stable: 79.3% in 1959 to 83.5% in 2002. Lithuania's citizenship law and the Constitution meet international and OSCE standards, guaranteeing universal human and civil rights.
Ethnic composition
Lithuanians are neither Slavic nor Germanic, although the union with Poland, German and Russian colonization and settlement left cultural and religious influences.
Before World War II
| Ethnic group |
census 1923 of Lithuania | census 1925 of the Klaipėda Region | ||
|---|---|---|---|---|
| Number | % | Number | % | |
| Lithuanians | 1,701,863 | 89.3 | 37,626 | 26.6 |
| Memels | 34,337 | 24.2 | ||
| Jews | 153,743 | 7.6 | 578 | 0.4 |
| Germans | 29,231 | 1.4 | 59,337 | 41.9 |
| Poles | 65,599 | 3.2 | 29 | 0.0 |
| Russians | 50,460 | 2.5 | 267 | 0.2 |
| Latvians | 14,883 | 0.7 | 47 | 0.0 |
| Belarusians | 4,421 | 0.2 | - | - |
| Tatars | 973 | 0.0 | ||
| Romani | 284 | 0.0 | ||
| Karaites | 141 | 0.0 | ||
| Estonians | 46 | 0.0 | ||
| Ukrainians | 43 | 0.0 | ||
| Others | 7,284 | 0.2 | 9,424 | 6.7 |
| Total | 2,028,971 | 141,645 | ||
| 1 Source: . The Klaipėda Region was annexed from Germany in 1923, but was not included in the 1923 census. A separate census in the Klaipėda region was held in 1925. | ||||
After World War II
Among the Baltic states, Lithuania has the most homogeneous population. According to the census conducted in 2001, 83.4% of the population identified themselves as Lithuanians, 6.7% as Poles, 6.3% as Russians, 1.2% as Belarusians, and 2.3% as members of other ethnic groups.
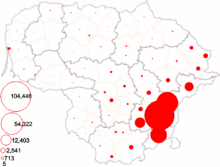
Poles are concentrated in the Vilnius Region, the area controlled by Poland in the interwar period. There are especially large Polish communities in Vilnius district municipality (61.3% of the population) and Šalčininkai district municipality (79.5%). The Electoral Action of Poles in Lithuania, an ethnic minority political party, has strong influence in these areas and has representation in the Seimas. The party is most active in local politics and controls several municipal councils.
| Ethnic group |
census 19591 | census 19702 | census 19793 | census 19894 | census 20015 | census 20115 | ||||||
|---|---|---|---|---|---|---|---|---|---|---|---|---|
| Number | % | Number | % | Number | % | Number | % | Number | % | Number | % | |
| Lithuanians | 2,150,767 | 79.3 | 2,506,751 | 80.1 | 2,712,233 | 80.0 | 2,924,251 | 79.6 | 2,907,293 | 83.4 | 2,561,314 | 84.2 |
| Poles | 230,107 | 8.5 | 240,203 | 7.7 | 247,022 | 7.3 | 257,994 | 7.0 | 234,989 | 6.7 | 200,317 | 6.6 |
| Russians | 231,014 | 8.5 | 267,989 | 8.6 | 303,493 | 8.9 | 344,455 | 9.4 | 219,789 | 6.3 | 176,913 | 5.8 |
| Belarusians | 30,256 | 1.1 | 45,412 | 1.5 | 57,584 | 1.7 | 63,169 | 1.7 | 42,866 | 1.2 | 36,227 | 1.2 |
| Ukrainians | 17,692 | 0.7 | 25,099 | 0.8 | 31,982 | 0.9 | 44,789 | 1.2 | 22,488 | 0.6 | 16,423 | 0.5 |
| Jews | 24,667 | 0.9 | 23,538 | 0.8 | 14,691 | 0.4 | 12,390 | 0.3 | 4,007 | 0.1 | 3,050 | 0.1 |
| Tatars | 3,020 | 0.1 | 3,454 | 0.1 | 3,984 | 0.1 | 5,135 | 0.1 | 3,235 | 0.1 | 2,793 | 0.1 |
| Germans | 11,166 | 0.4 | 1,904 | 0.1 | 2,616 | 0.1 | 2,058 | 0.1 | 3,243 | 0.1 | 2,418 | 0.1 |
| Romani | 1,238 | 0.1 | 1,880 | 0.1 | 2,306 | 0.1 | 2,718 | 0.1 | 2,571 | 0.1 | 2,115 | 0.1 |
| Latvians | 6,318 | 0.2 | 5,063 | 0.2 | 4,354 | 0.1 | 4,229 | 0.1 | 2,955 | 0.1 | 2,025 | 0.1 |
| Estonians | 352 | 0.0 | 551 | 0.0 | 546 | 0.0 | 598 | 0.0 | 400 | 0.0 | 314 | 0.0 |
| Karaites | 423 | 0.0 | 388 | 0.0 | 352 | 0.0 | 289 | 0.0 | 273 | 0.0 | 241 | 0.0 |
| Others or unspecified | 4,425 | 0.2 | 6,004 | 0.2 | 10,327 | 0.3 | 12,727 | 0.3 | 40,136 | 1.2 | 39,279 | 1.3 |
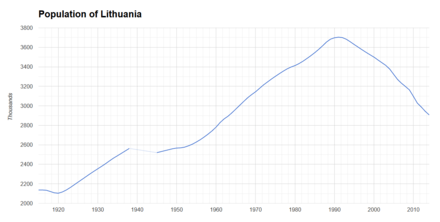
| Total | 2,711,445 | 3,128,236 | 3,391,490 | 3,674,802 | 3,483,972 | 3,043,429 | ||||||
| 1 Source: . 2 Source: . 3 Source: . 4 Source: . 5 Source: . | ||||||||||||
Russians, even though they are almost as numerous as Poles, are much more evenly scattered and lack strong political cohesion. The most prominent community lives in Visaginas (52%). Most of them are scientists who moved with their families from the Russian SFSR to work at the Ignalina Nuclear Power Plant. A number of ethnic Russians (mostly military) left Lithuania after the declaration of independence in 1990.
Another major change in the ethnic composition of Lithuania was the extermination of the Jewish population during the Holocaust. Before World War II about 7.5% of the population was Jewish; they were concentrated in cities and towns and had a significant influence on crafts and business. They were called Litvaks and had a strong culture. The population of Vilnius, sometimes nicknamed Northern Jerusalem, was about 30% Jewish. Almost all of these Jews were killed during the Nazi German occupation, or later emigrated to the United States and Israel. Now there are only about 4,000 Jews living in Lithuania.
Citizenship
Lithuania's membership of the European Union has made Lithuanian citizenship all the more appealing. Lithuanian citizenship is theoretically easier (see court ruling notes below) to obtain than that of many other European countries—only one great-grandparent is necessary to become a Lithuanian citizen. Persons who held citizenship in the Republic of Lithuania prior to June 15, 1940, and their children, grandchildren, and great-grandchildren (provided that these persons did not repatriate) are eligible for Lithuanian citizenship .
Lithuanian citizens are allowed to travel and work throughout the European Union without a visa or other restrictions.
Dual citizenship ruled unconstitutional
The Lithuanian Constitutional Court ruled in November 2006 that a number of provisions of the Law of the Republic of Lithuania on citizenship are in conflict with the Lithuanian Constitution. In particular, the court ruled that a number of current provisions of the Citizenship Law implicitly or explicitly allowing dual citizenship are in conflict with the Constitution; such provisions amounted to the unconstitutional practice of making dual citizenship a common phenomenon rather than a rare exception. The provisions of the Citizenship Law announced unconstitutional are no longer valid and applicable to the extent stated by the Constitutional Court.
The Lithuanian Parliament amended the Citizenship Law substantially as a result of this court ruling, allowing dual Citizenship for children of at least one Lithuanian parent that are born abroad, but preventing Lithuanians from keeping their Lithuanian citizenship after obtaining citizenship of another country.
There are some special cases still permitting dual citizenship. See Lithuanian nationality law.
Languages
The Lithuanian language is the country's sole official language countrywide. It is the first language of almost 85% of population and is also spoken by 286,742 out of 443,514 non-Lithuanians.[10] The Soviet era had imposed the official use of Russian, so most adult Lithuanians speak Russian as a second language, while the Polish population generally speaks Polish. Russians who immigrated after World War II speak Russian as their first language. The younger generation usually speaks English as their second language, while a substantial portion of the total population (37%) speak at least two foreign languages. According to census of 2011, 30% of the population can speak English.[10]
Approximately 14,800 pupils started their 2012 school year in schools where the curriculum is conducted in Russian (down from 76,000 in 1991), and about 12,300 enrolled in Polish schools (compared to 11,400 in 1991 and 21,700 in 2001). There are also schools in the Belarusian language, as well as in French and English.[11]
There are perhaps 50 speakers of Karaim, a Turkic language spoken by Karaite Jews, in Lithuania.[12]
Lithuanian Sign Language and Russian Sign Language are used by the deaf community.
Religion
As per the 2011 census, 77.2% of Lithuanians identified themselves as Roman Catholic.[13] The Church has been the majority denomination since the Christianisation of Lithuania at the end of the 14th century. Some priests actively led the resistance against the Communist regime (symbolised by the Hill of Crosses).
In the first half of the 20th century, the Lutheran Protestant church had around 200,000 members, 9% of the total population, mostly Protestant Lithuanians from the former Memel Territory and Germans, but it has declined since 1945. Small Protestant communities are dispersed throughout the northern and western parts of the country. Believers and clergy suffered greatly during the Soviet occupation, with many killed, tortured or deported to Siberia. Various Protestant churches have established missions in Lithuania since 1990.[14] 4.1% are Orthodox, 0.8% are Old Believers (both mainly among the Russian minority), 0.8% are Protestant and 6.1% have no religion.
Lithuania was historically home to a significant Jewish community and was an important center of Jewish scholarship and culture from the 18th century, until the community, numbering about 160,000 before World War II, was almost entirely annihilated during the Holocaust.[15][16] By 2011, around 3000 people in Lithuania identified themselves as Jews, while around 1200 identified with Judaic religious community.[17][18]
According to the 2005 Eurobarometer Poll,[19] 12% said that "they do not believe there is any sort of spirit, god, or life force", 36% answered that "they believe there is some sort of spirit or life force" and 49% of Lithuanian citizens responded that "they believe there is a God".
CIA World Factbook demographic statistics
The following demographic statistics are from the CIA World Factbook, unless otherwise indicated.
Age structure:
0–14 years: 14.2% (male 258,423/female 245,115)
15–64 years: 69.6% (male 1,214,743/female 1,261,413)
65 years and over: 16.2% (male 198,714/female 376,771) (2009 est.)
Population growth rate: −0.28% (2009 est.)
Net migration rate: −0.72 migrant(s)/1,000 population (2009 est.)

Sex ratio:
at birth:
1.06 male(s)/female
under 15 years:
1.05 male(s)/female
15–64 years:
0.96 male(s)/female
65 years and over:
0.53 male(s)/female
total population:
0.89 male(s)/female (2009 est.)
Infant mortality rate:
Total: 6.47 deaths/1,000 live births
male: 7.73 deaths/1,000 live births
female: 5.13 deaths/1,000 live births (2009 est.)
Life expectancy at birth:
total population: 74.9 years
male: 69.98 years
female: 80.1 years (2009 est.)
Total fertility rate: 1.29 children born/woman (2014)
Suicide rate: 31.5 suicides per every 100,000 people (2009)[20]
Divorce rate: With 2.8 divorces per every 1000 people (2009), Lithuania in 2004 had one of the highest divorce rate in the European Union .
Table of birth and death rates
Before World War II
| Average population (x 1000) | Live births | Deaths | Natural change | Crude birth rate (per 1000) | Crude death rate (per 1000) | Natural change (per 1000) | |
|---|---|---|---|---|---|---|---|
| 1915 | 2 137 | 38 722 | 43 596 | −4 874 | 18.1 | 20.4 | −2.3 |
| 1916 | 2 137 | 35 565 | 31 512 | 4 053 | 16.6 | 14.7 | 1.9 |
| 1917 | 2 134 | 32 266 | 43 047 | −10 781 | 15.1 | 20.2 | −5.1 |
| 1918 | 2 121 | 33 176 | 47 522 | −14 346 | 15.6 | 22.4 | −6.8 |
| 1919 | 2 108 | 41 095 | 51 930 | −10 835 | 19.5 | 24.6 | −5.1 |
| 1920 | 2 104 | 47 642 | 44 487 | 3 155 | 22.6 | 21.1 | 1.5 |
| 1921 | 2 116 | 51 864 | 31 915 | 19 949 | 24.5 | 15.1 | 9.4 |
| 1922 | 2 136 | 58 064 | 37 598 | 20 466 | 27.2 | 17.6 | 9.6 |
| 1923 | 2 161 | 60 869 | 32 432 | 28 437 | 28.2 | 15.0 | 13.2 |
| 1924 | 2 189 | 63 864 | 35 493 | 28 371 | 29.2 | 16.2 | 13.0 |
| 1925 | 2 217 | 63 743 | 37 179 | 26 564 | 28.8 | 16.8 | 12.0 |
| 1926 | 2 245 | 63 655 | 34 380 | 29 275 | 28.4 | 15.3 | 13.0 |
| 1927 | 2 273 | 66 114 | 38 897 | 27 217 | 29.1 | 17.1 | 12.0 |
| 1928 | 2 301 | 65 945 | 35 698 | 27 116 | 28.7 | 15.5 | 11.8 |
| 1929 | 2 328 | 63 083 | 39 669 | 23 414 | 27.1 | 17.0 | 10.1 |
| 1930 | 2 354 | 64 164 | 37 151 | 27 013 | 27.3 | 15.8 | 11.5 |
| 1931 | 2 380 | 63 419 | 37 478 | 25 941 | 26.6 | 15.7 | 10.9 |
| 1932 | 2 407 | 65 371 | 36 577 | 28 794 | 27.2 | 15.2 | 12.0 |
| 1933 | 2 436 | 62 145 | 32 749 | 29 396 | 25.5 | 13.4 | 12.1 |
| 1934 | 2 464 | 60 770 | 35 789 | 24 981 | 24.7 | 14.5 | 10.1 |
| 1935 | 2 488 | 57 970 | 34 595 | 23 375 | 23.3 | 13.9 | 9.4 |
| 1936 | 2 513 | 60 446 | 33 440 | 25 939 | 24.1 | 13.3 | 10.3 |
| 1937 | 2 538 | 56 393 | 33 260 | 22 433 | 22.2 | 13.1 | 8.8 |
| 1938 | 2 563 | 57 951 | 32 256 | 24 562 | 22.6 | 12.6 | 9.6 |
| 19391 | 2 432 | 54 184 | 32 983 | 21 201 | 22.3 | 13.6 | 8.7 |
1 the figures of 1939 exclude the Klaipėda Region
After World War II
- Source: Statistics Lithuania
| Average population (x 1000) | Live births | Deaths | Natural change | Crude birth rate (per 1000) | Crude death rate (per 1000) | Natural change (per 1000) | Total fertility rate | |
|---|---|---|---|---|---|---|---|---|
| 1945 | 2 520 | 60 392 | 35 201 | 25 191 | 24.0 | 14.0 | 10.0 | |
| 1946 | 2 530 | 58 399 | 37 688 | 20 711 | 23.1 | 14.9 | 8.2 | |
| 1947 | 2 540 | 59 680 | 39 716 | 19 964 | 23.5 | 15.6 | 7.9 | |
| 1948 | 2 550 | 58 780 | 35 137 | 23 643 | 23.1 | 13.8 | 9.3 | |
| 1949 | 2 560 | 63 034 | 32 049 | 30 985 | 24.6 | 12.5 | 12.1 | |
| 1950 | 2 567 | 60 719 | 30 870 | 29 849 | 23.7 | 12.0 | 11.6 | |
| 1951 | 2 569 | 58 504 | 29 693 | 28 811 | 22.8 | 11.6 | 11.2 | |
| 1952 | 2 576 | 56 944 | 28 166 | 28 778 | 22.1 | 10.9 | 11.2 | |
| 1953 | 2 590 | 52 610 | 27 118 | 25 492 | 20.3 | 10.5 | 9.8 | |
| 1954 | 2 607 | 54 229 | 25 559 | 28 670 | 20.8 | 9.8 | 11.0 | |
| 1955 | 2 629 | 55 525 | 24 138 | 31 387 | 21.1 | 9.2 | 11.9 | |
| 1956 | 2 653 | 53 741 | 21 869 | 31 872 | 20.3 | 8.2 | 12.0 | |
| 1957 | 2 681 | 56 223 | 23 361 | 32 862 | 21.0 | 8.7 | 12.3 | |
| 1958 | 2 711 | 61 190 | 22 103 | 39 087 | 22.6 | 8.2 | 14.4 | |
| 1959 | 2 744 | 62 241 | 24 688 | 37 553 | 22.7 | 9.0 | 13.7 | 2,63 |
| 1960 | 2 782 | 62 485 | 21 611 | 40 874 | 22.5 | 7.8 | 14.7 | 2,59 |
| 1961 | 2 828 | 62 775 | 23 365 | 39 410 | 22.2 | 8.3 | 13.9 | 2,57 |
| 1962 | 2 865 | 59 728 | 24 925 | 34 803 | 20.8 | 8.7 | 12.1 | 2,64 |
| 1963 | 2 893 | 57 024 | 23 112 | 33 912 | 19.7 | 8.0 | 11.7 | 2,45 |
| 1964 | 2 928 | 55 856 | 21 830 | 34 026 | 19.1 | 7.5 | 11.6 | 2,31 |
| 1965 | 2 967 | 53 818 | 23 467 | 30 351 | 18.1 | 7.9 | 10.2 | 2,21 |
| 1966 | 3 006 | 54 275 | 23 799 | 30 476 | 18.1 | 7.9 | 10.1 | 2,34 |
| 1967 | 3 045 | 53 806 | 24 571 | 29 235 | 17.7 | 8.1 | 9.6 | 2,27 |
| 1968 | 3 083 | 54 258 | 25 725 | 28 533 | 17.6 | 8.3 | 9.3 | 2,25 |
| 1969 | 3 115 | 54 263 | 27 156 | 27 107 | 17.4 | 8.7 | 8.7 | 2,29 |
| 1970 | 3 144 | 55 519 | 28 048 | 27 471 | 17.7 | 8.9 | 8.7 | 2,40 |
| 1971 | 3 179 | 56 044 | 26 972 | 29 072 | 17.6 | 8.5 | 9.1 | 2,41 |
| 1972 | 3 214 | 54 616 | 29 252 | 25 364 | 17.0 | 9.1 | 7.9 | 2,35 |
| 1973 | 3 244 | 51 944 | 29 160 | 22 784 | 16.0 | 9.0 | 7.0 | 2,22 |
| 1974 | 3 274 | 51 941 | 29 612 | 22 329 | 15.9 | 9.0 | 6.8 | 2,21 |
| 1975 | 3 302 | 51 766 | 31 265 | 20 501 | 15.7 | 9.5 | 6.2 | 2,18 |
| 1976 | 3 329 | 52 296 | 31 972 | 20 324 | 15.7 | 9.6 | 6.1 | 2,18 |
| 1977 | 3 355 | 52 166 | 32 932 | 19 234 | 15.5 | 9.8 | 5.7 | 2,14 |
| 1978 | 3 379 | 51 821 | 34 008 | 17 813 | 15.3 | 10.1 | 5.3 | 2,09 |
| 1979 | 3 398 | 51 937 | 34 897 | 17 040 | 15.3 | 10.3 | 5.0 | 2,05 |
| 1980 | 3 413 | 51 765 | 35 871 | 15 894 | 15.2 | 10.5 | 4.7 | 1,99 |
| 1981 | 3 433 | 52 249 | 35 579 | 16 670 | 15.2 | 10.4 | 4.9 | 1,98 |
| 1982 | 3 457 | 53 141 | 35 040 | 18 101 | 15.4 | 10.1 | 5.2 | 1,97 |
| 1983 | 3 485 | 57 589 | 36 451 | 21 138 | 16.5 | 10.5 | 6.1 | 2,10 |
| 1984 | 3 514 | 57 576 | 38 666 | 18 910 | 16.4 | 11.0 | 5.4 | 2,07 |
| 1985 | 3 545 | 58 454 | 39 169 | 19 285 | 16.5 | 11.0 | 5.4 | 2,09 |
| 1986 | 3 579 | 59 705 | 35 788 | 23 917 | 16.7 | 10.0 | 6.7 | 2,12 |
| 1987 | 3 616 | 59 360 | 36 917 | 22 443 | 16.4 | 10.2 | 6.2 | 2,11 |
| 1988 | 3 655 | 56 727 | 37 649 | 19 078 | 15.5 | 10.3 | 5.2 | 2,02 |
| 1989 | 3 684 | 55 782 | 38 150 | 17 632 | 15.1 | 10.3 | 4.8 | 1,98 |
| 1990 | 3 698 | 56 868 | 39 760 | 17 108 | 15.3 | 10.7 | 4.6 | 2,02 |
| 1991 | 3 704 | 56 219 | 41 013 | 15 206 | 15.2 | 11.1 | 4.1 | 2,00 |
| 1992 | 3 700 | 53 617 | 41 455 | 12 162 | 14.5 | 11.2 | 3.3 | 1,94 |
| 1993 | 3 683 | 47 464 | 46 107 | 1 357 | 12.9 | 12.5 | 0.4 | 1,74 |
| 1994 | 3 657 | 42 376 | 46 486 | −4 110 | 11.6 | 12.7 | −1.1 | 1,57 |
| 1995 | 3 629 | 41 195 | 45 306 | −4 111 | 11.4 | 12.5 | −1.1 | 1,55 |
| 1996 | 3 602 | 39 066 | 42 896 | −3 830 | 10.8 | 11.9 | −1.1 | 1,49 |
| 1997 | 3 575 | 37 812 | 41 143 | −3 331 | 10.6 | 11.5 | −0.9 | 1,47 |
| 1998 | 3 549 | 37 508 | 40 793 | −3 285 | 10.6 | 11.5 | −0.9 | 1,46 |
| 1999 | 3 524 | 36 415 | 40 003 | −3 588 | 10.3 | 11.4 | −1.1 | 1,46 |
| 2000 | 3 500 | 34 149 | 38 919 | −4 770 | 9.8 | 11.1 | −1.3 | 1,39 |
| 2001 | 3 471 | 31 185 | 40 399 | −8 853 | 9.0 | 11.6 | −2.5 | 1,29 |
| 2002 | 3 443 | 29 541 | 41 072 | −11 058 | 8.6 | 11.9 | −3.2 | 1,23 |
| 2003 | 3 415 | 29 977 | 40 990 | −11 013 | 8.8 | 12.0 | −3.0 | 1,26 |
| 2004 | 3 377 | 29 769 | 41 340 | −11 571 | 8.8 | 12.2 | −3.2 | 1,27 |
| 2005 | 3 323 | 29 510 | 43 799 | −14 289 | 8.9 | 13.2 | −3.9 | 1,29 |
| 2006 | 3 270 | 29 606 | 44 813 | −15 207 | 9.1 | 13.7 | −4.1 | 1,33 |
| 2007 | 3 231 | 30 020 | 45 624 | −15 064 | 9.3 | 14.1 | −4.1 | 1,36 |
| 2008 | 3 198 | 31 536 | 43 832 | −12 296 | 9.9 | 13.7 | −2.7 | 1,45 |
| 2009 | 3 163 | 32 165 | 42 032 | −9 867 | 10.2 | 13.3 | −1.7 | 1,50 |
| 2010 | 3 097 | 30 676 | 42 120 | −11 444 | 9.9 | 13.6 | −2.1 | 1.50 |
| 2011 | 3 028 | 30 268 | 41 037 | −10 769 | 10.0 | 13.6 | −2.2 | 1.55 |
| 2012 | 2 988 | 30 459 | 40 938 | −10 479 | 10.2 | 13.7 | −3.5 | 1.60 |
| 2013 | 2 944 | 29 885 | 41 511 | −11 626 | 10.1 | 14.0 | −3.6 | 1.59 |
| 2014 | 2 907 | 30 369 | 40 252 | −9 883 | 10.3 | 13.7 | −3.4 | 1.63 |
| 2015 | 2 878 | 31 475 | 41 802 | −9 834 | 11.1 | 14.5 | -3.4 | 1.70 |
Current vital statistics[21]
- Number of births from January to October 2015 =
 26,656
 - Number of births from January to October 2016 =
 26,392
 - Number of deaths from January to October 2015 =
 34,865
 - Number of deaths from January to October 2016 =
 34,233
During the period of January–October 2016 the natural increase was:
Natural increase from January to October 2015 = ![]() −8,209
−8,209
Natural increase from January to October 2016 = ![]() −7,841
−7,841
Literacy and education
According to the 2011 census, only around 0.2% of the Lithuanian population aged 10 and over were illiterate, the majority of them in rural areas. The proportion is similar for males and females.[22]
The general education system in Lithuania consists of primary, basic, secondary and tertiary education. Primary, basic and secondary (or high school) education is free of charge to all residents and is compulsory for pupils under 16 years of age.[23] Pre-primary education is also available free of charge to 5-year-old or 6-year-old children but is not compulsory. Pre-primary schooling is attended by about 90% of pre-school age children in Lithuania.[24] Primary, basic and secondary education in Lithuania is available to some ethnic minorities in their native languages, including Polish, Russian and Belarusian.
Primary schooling (Lithuanian: pradinis ugdymas) is available to kids that have reached 7 years of age (or younger, should the parents so desire) and lasts four years. Primary school students are not assessed through a grade system, instead using oral or written feedback. Students begin studying their first foreign language in their second year of primary school.[25] Data from the 2011 census showed that 99.1% of the population aged 20 and older have attained at least primary education, while around 27,000 pupils started the first grade in 2012.[26]
Basic education (Lithuanian: pagrindinis ugdymas) covers grades 5 to 10. It is provided by basic, secondary, youth, vocational schools and gymnasiums. After completing the 10th grade, the students must take the basic education achievement test in the Lithuanian language, mathematics, and an elective basic education achievement test in Mother Tongue (Belarusian, Polish, Russian or German).[23] In 2011, 90.9% of the population of Lithuania aged 20 or older had attained the basic level of education.[26]
Secondary education (Lithuanian: vidurinis ugdymas) in Lithuania is optional and available to students who have attained basic education. It covers two years (11-12th grades in secondary schools and 3-4th grades in gymnasiums). At this level, students have the opportunity to adapt their study plans (subjects and study level) to their individual preferences.[25] Secondary education is completed upon passing national matura examinations. Matura examinations consist of as many as six separate examinations of which two (Lithuanian Language and Literature and one elective subject) are required to attain the diploma. As of 2011, 78.2% of the population of Lithuania aged 20 or older had attained the secondary level of education, including secondary education provided by vocational schools.[26]
More than 60% of the graduates from secondary school every year choose to continue education at colleges and universities of the Lithuanian higher education system. As of 2013, there were 23 universities (including academies and business schools recognized as such) and 24 colleges operating in Lithuania. Vilnius University, founded in 1579, is the oldest and largest university in Lithuania. More than 48,000 students enrolled to all higher education programmes in Lithuania in 2011, including level I (professional bachelor and bachelor), level II (masters) and level III (doctorate) studies.[27] Higher education in Lithuania is partly state-funded, with free-of-charge access to higher education constitutionally guaranteed to students deemed "good". There are also stipends available to the best students.
See also
- Lithuania
- Lithuanians in Brazil
- Ethnic history of the Vilnius region
- Russians in Lithuania
- Aging of Europe
Notes
- 1 2 Letukienė, Nijolė; Gineika, Petras (2003). "Istorija. Politologija: kurso santrauka istorijos egzaminui" (in Lithuanian). Vilnius: Alma littera: 182. Statistical numbers, probably accepted in historiography (the sources, their treatment, the procedure of counting is not discussed in this book) are given, according which in 1260 there were about 0.27 million Lithuanians of 0.4 million of a whole population; in percentage: 67,5%.
- 1 2 Bjorn Wiemer, Dialect and language contacts on the territory of the Grand Duchy from the 15th century until 1939, Kurt Braunmüller, Gisella Ferraresi, Aspects of multilingualism in European language history, John Benjamins Publishing Company, 2003, ISBN 90-272-1922-2, Google Print, p.109; 125
- ↑ Letukienė, N., Istorija. Politologija: kurso santrauka istorijos egzaminui, 2003, p. 182. There can be found also different numbers, for example: Kevin O'Connor, The history of the Baltic States, Greenwood Publishing Group, 2003, ISBN 0-313-32355-0, Google Print, p.17. Here author estimates that there were 9 millions of inhabitants in GDL, and 1 million of them were ethnic Lithuanians by 1387.
- ↑ Based on 1493 population map (p.92) from Iwo Cyprian Pogonowski, Poland a Historical Atlas, Hippocrene Books, 1987, ISBN 0-88029-394-2
- ↑ Jarmo Kotilaine, Russia's foreign trade and economic expansion in the seventeenth century: windows on the world, BRILL, 2005, ISBN 90-04-13896-X, Google Print, p.45
- ↑ (Lithuanian) Lietuvos Didžiosios kunigaikštystės kanceliarinės slavų kalbos termino nusakymo problema Z. Zinkevičius
- ↑ Daniel. Z Stone, A History of East Central Europe, p.4
- ↑ Statistics Lithuania census 2011: GYVENTOJAI PAGAL TAUTYBĘ, GIMTĄJĄ KALBĄ IR TIKYBĄ
- ↑ Eurobarometer: Europeans and their languages, 2012, factsheet Lithuania
- 1 2 Census 2011: GYVENTOJAI PAGAL IŠSILAVINIMĄ IR KALBŲ MOKĖJIMĄ
- ↑ General school pupils, Statistics Lithuania
- ↑ UNESCO, Audio-visual resources. Retrieved 2011-09-12.
- ↑ Department of Statistics to the Government of the Republic of Lithuania. "Ethnicity, mother tongue and religion".. 2013-03-15.
- ↑ "United Methodists evangelize in Lithuania with ads, brochures". Umc.org. 11 August 2006. Retrieved 25 April 2010.
- ↑ Arūnas Bubnys (2004). "Holocaust in Lithuania: An Outline of the Major Stages and Their Results". The Vanished World of Lithuanian Jews. Rodopi. pp. 218–219. ISBN 90-420-0850-4.
- ↑ "Lithuania". Holocaust Encyclopedia. United States Holocaust Memorial Museum. Retrieved 12 April 2012.
- ↑ "Census 2011. Population by ethnicity and municipality". Statistics Lithuania. Retrieved 28 October 2013.
- ↑ "Census 2011. Population by religious community indicated, municipalities". Statistics Lithuania. Retrieved 28 October 2013.
- ↑ "Eurobarometer on Social Values, Science and technology 2005" (PDF). p. 11. Retrieved 2007-05-05.
- ↑ "Death Due To Suicide". Eurostat. European Commission. 2009. Retrieved 2010-01-10.
- ↑ "Vital Statistics". Official Statistics Portal. Statistics of Lithuania. Retrieved 15 November 2016.
- ↑ Statistics Lithuania, 2011 Census, Population by educational attainment and command of languages
- 1 2 Ministry of Education and Science, Education, Lower secondary education
- ↑ Ministry of Education and Science, Education, Pre-school education
- 1 2 Government of the Republic of Lithuania, The Official Gateway of Lithuania, Education System
- 1 2 3 Statistics Lithuania, 2011 Census, Population by educational attainment, age group and municipality
- ↑ Ministry of Education and Science of the Republic of Lithuania, Lietuvos švietimas skaičiais, 2012
External links
- statistics about education in Lithuania (PDF)
- Key results of Lithuanian census
- Suicide statistics as of 2005 (Lith.)
Lithuania articles | ||||||||||||||||
|---|---|---|---|---|---|---|---|---|---|---|---|---|---|---|---|---|
| History |
|  | ||||||||||||||
| Geography | ||||||||||||||||
| Politics |
| |||||||||||||||
| Economy | ||||||||||||||||
| Society |
| |||||||||||||||
| ||||||||||||||||
| Largest ethnic minorities | |
|---|---|
| Smaller ethnic minorities | |
| Other small ethnic minorities |
|
| Other | |