Demographics of Moldova
This article is about the demographic features of the population of Moldova, including distribution, ethnicity, languages, religious affiliation and other statistical data.
| Demographics of Moldova | |
|---|---|
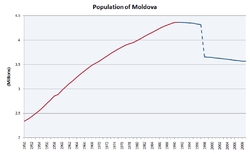
|
Population in millions, 1950 – January 2009. (Note: Data after 1997 doesn't include regions under the control of Transnistria). | |
| Population | 3,559,500 (2012) |
| Density | 120.0 |
| Growth rate | −0.0 (2012) |
| Birth rate |
11.1 births/1,000 population (2012) |
| Death rate |
11.1 deaths/1,000 population (2012) |
| Life expectancy | 70.99 years (2012) |
| • male |
67.08 years (2012) |
| • female |
74.86 years (2012) |
| Fertility rate |
1.28 children born/woman (2012) |
| Infant mortality rate |
9.8 deaths/1,000 live births (2012) Male: 13.8 deaths/1,000 live births (2010) Female: 9.5 deaths/1,000 live births(2010) |
| Net migration rate | +0.0 migrant(s)/1,000 population (2012) |
| Age structure | |
| 0–14 years |
16.4% (male 301,150/female 284,400) |
| 15–64 years |
73.6% (male 1,277,900/female 1,341,650) |
| 65 and over |
10.0% (male 133,060/female 222,270) |
| Sex ratio | |
| Total | 0.91 male(s)/female (2008 est.) |
| At birth | 1.06 male(s)/female |
| Under 15 | 1.06 male(s)/female |
| 15–64 years | 0.94 male(s)/female |
| 65 and over | 0.59 male(s)/female |
| Nationality | |
| Nationality | Moldovan(s) |
| Major ethnic | Moldovans 75.8%[1] |
| Minor ethnic | Ukrainians 8.4%, Russians 5.8%, Gagauz 4.4%, Bulgarians 1.9% |
| Language | |
| Official | Romanian |
| Spoken | Moldovan/Romanian, Russian, Gagauz (a Turkish dialect) |
Overview of the demographic statistics
According to the 2004 Moldovan Census, 3,383,332 people lived in the areas controlled by the central government of Moldova. According to the 2004 Census in Transnistria, 555,347 people lived in the breakaway Transnistria, including the city of Bender, and the other localities de facto controlled by Transnistrian authorities. Thus, the total population of the country in 2004 amounted to 3,938,679.
| Median age | |
|---|---|
| total | 34.3 years (2008 est.) (up from 32.22 years in 2005) |
| male | 32.4 years (up from 30.14 years in 2005) |
| female | 36.4 years (up from 34.27 years in 2005) |
| Literacy rate | |
| total | 96% (1989); 99.1% (2003); 99.1% (2005) |
| male | 99% (1989); 99.6% (2003); 99.7% (2005) |
| female | 94% (1989); 98.7% (2003); 98.6% (2005) |
| definition | age 15 and over can read and write |
| Unemployment rate | |
| 8% (official), 40% (real) | |
| Source: The World Factbook, CIA;[2] UN[3],[4] | |
Urban–rural distribution of population
By district
| no | type | name | population | urban | rural | ||||
|---|---|---|---|---|---|---|---|---|---|
| population | % | cities | population | % | communes | ||||
| 1 | municipality | Chişinău | 712,218 | 644,204 | 90.45% | 7 | 68,014 | 9.55% | 12 |
| 2 | municipality | Bălţi | 127,561 | 122,669 | 96.16% | 1 | 4,892 | 3.84% | 2 |
| 3 | auton.territ.unit | Găgăuzia | 155,646 | 58,190 | 37.39% | 3 | 97,456 | 62.61% | 23 |
| 4 | district | Anenii Noi | 81,710 | 8,358 | 10.23% | 1 | 73,352 | 89.77% | 25 |
| 5 | district | Basarabeasca | 28,978 | 11,192 | 38.62% | 1 | 17,786 | 61.38% | 6 |
| 6 | district | Briceni | 78,027 | 14,230 | 18.24% | 2 | 63,797 | 81.76% | 26 |
| 7 | district | Cahul | 119,231 | 35,488 | 29.76% | 1 | 83,743 | 70.24% | 36 |
| 8 | district | Cantemir | 60,001 | 3,872 | 6.45% | 1 | 56,129 | 93.55% | 26 |
| 9 | district | Călăraşi | 75,075 | 14,516 | 19.34% | 1 | 60,559 | 80.66% | 27 |
| 10 | district | Căuşeni | 90,612 | 21,941 | 24.21% | 2 | 68,671 | 75.79% | 25 (out of 28) |
| 11 | district | Cimişlia | 60,925 | 12,858 | 21.10% | 1 | 48,067 | 78.90% | 22 |
| 12 | district | Criuleni | 72,254 | 7,138 | 9.88% | 1 | 65,116 | 90.12% | 24 |
| 13 | district | Donduşeni | 46,442 | 9,801 | 21.10% | 1 | 36,641 | 78.90% | 21 |
| 14 | district | Drochia | 87,092 | 16,606 | 19.07% | 1 | 70,486 | 80.93% | 27 |
| 15 | district | Dubăsari | 43,015 | - | - | - | 34,015 | 100% | 11 |
| 16 | district | Edineţ | 81,390 | 23,065 | % | 2 | 58,325 | % | 30 |
| 17 | district | Făleşti | 90,320 | 14,931 | % | 1 | 75,389 | % | 32 |
| 18 | district | Floreşti | 89,389 | 17,086 | % | 3 | 17,086 | % | 37 |
| 19 | district | Glodeni | 60,975 | 10,465 | % | 1 | 50,510 | % | 18 |
| 20 | district | Hînceşti | 119,762 | 15,281 | % | 1 | 104,481 | % | 38 |
| 21 | district | Ialoveni | 97,704 | 15,041 | % | 1 | 82,663 | % | 24 |
| 22 | district | Leova | 51,056 | 14,411 | % | 2 | 36,645 | % | 23 |
| 23 | district | Nisporeni | 64,924 | 12,105 | % | 1 | 52,819 | % | 22 |
| 24 | district | Ocniţa | 56,510 | 19,270 | % | 3 | 37,240 | % | 18 |
| 25 | district | Orhei | 116,271 | 25,641 | % | 1 | 90,630 | % | 37 |
| 26 | district | Rezina | 48,105 | 10,196 | % | 1 | 37,909 | % | 24 |
| 27 | district | Rîşcani | 69,454 | 13,351 | % | 2 | 56,103 | % | 26 |
| 28 | district | Sîngerei | 87,153 | 15,760 | % | 2 | 71,393 | % | 24 |
| 29 | district | Soroca | 94,986 | 28,362 | % | 1 | 66,624 | % | 34 |
| 30 | district | Străşeni | 88,900 | 19,633 | % | 2 | 69,267 | % | 25 |
| 31 | district | Şoldăneşti | 42,227 | 6,304 | % | 1 | 35,923 | % | 22 |
| 32 | district | Ştefan Vodă | 70,594 | 7,768 | % | 1 | 62,826 | % | 22 |
| 33 | district | Taraclia | 43,154 | 13,756 | % | 1 | 29,398 | % | 14 |
| 34 | district | Teleneşti | 70,126 | 6,855 | % | 1 | 63,271 | % | 30 |
| 35 | district | Ungheni | 110,545 | 35,311 | % | 2 | 75,234 | % | 31 |
| Subtotal control by central government | 3,383,332 | 1,305,655 | 38.59% | 54 | 2,077,677 | 61.41% | 844 | ||
| 36 | territorial unit | Transnistria | 439,528 | 280,6401 | 63.85% | 10 | 158,8881 | 36.15% | 69 |
| 37 | municipality | Bender | 100,169 | 97,027 | 96.86% | 1 | 3,142 | 3.14% | 1 |
| 10 | parts of district | Căuşeni | 14,935 | - | - | - | 14,935 | 100% | 3 (out of 28) |
| 15 | parts of district | Dubăsari | 715 | - | - | - | 715 | 100% | parts of 1 |
| Subtotal control by breakaway Tiraspol | 555,347 | 377,667 | 68.01% | 11 | 177,680 | 31.99% | 73 | ||
| Total | 3,938,679 | 1,683,322 | 42.74% | 65 | 2,255,357 | 57.26% | 917 | ||
Note: 1The breakaway Transnistrian authorities count as rural the population of the towns of Crasnoe, Maiac, and Tiraspolul Nou. Since their exact population isn't available, so does this table.
Transnistrian-controlled areas
| Population | urban | rural | ||||||||||||
|---|---|---|---|---|---|---|---|---|---|---|---|---|---|---|
| population | cities | population | communes | |||||||||||
| Tiraspol | 158,069 | 158,069 | 1 | – | – | |||||||||
| Camenca District | 27,284 | 10,323 | 1 | 16,961 | 12 | |||||||||
| Rîbnița District | 82,699 | 53,648 | 1 | 29,051 | 22 | |||||||||
| Dubăsari District | 36,734 | 23,650 | 1 | 13,084 | 9 | |||||||||
| Grigoriopol District | 48,000 | 11,4731 | 2 | 36,5271 | 14 | |||||||||
| Slobozia District | 86,742 | 23,4772 | 4 | 63,2652 | 12 | |||||||||
| Subtotal Transnistria | 439,528 | 280,640 | 10 | 158,888 | 69 | |||||||||
| Bender (w/o Proteagailovca) | 97,027 | 97,027 | 1 | – | – | |||||||||
| Proteagailovca | 3,142 | – | – | 3,142 | 1 | |||||||||
| Gîsca | 4,841 | – | – | 4,841 | 1 | |||||||||
| Chiţcani (incl. Mereneşti and Zahorna) | ~9,000 | – | – | ~9,000 | 1 | |||||||||
| Cremenciug | 1,094 | – | – | 1,094 | 1 | |||||||||
| Roghi | 715 | – | – | 715 | parts of 1 | |||||||||
| Subotal other localities | 115,819 | 97,027 | 1 | 18,792 | 4 | |||||||||
| Total Tiraspol-controlled areas | 555,347 | 377,667 | 11 | 177,680 | 73 | |||||||||
Note:
1 The breakaway Transnistrian authorities have counties as urban only the population of the town of Grigoriopol, while that of the town of Maiac was counted as rural.
2 The breakaway Transnistrian authorities have counties as urban only the population of the towns of Slobozia and Dnestrovsc, while those of the towns of Crasnoe and Tiraspolul Nou were counted as rural.
Vital Statistics
Bessarabia Governorate (1900-1914)[5]
| Average population (x 1000) | Live births | Deaths | Natural change | Crude birth rate (per 1000) | Crude death rate (per 1000) | Natural change (per 1000) | |
|---|---|---|---|---|---|---|---|
| 1900 | 2 037 | 83 306 | 48 480 | 34 826 | 40.9 | 23.8 | 17.1 |
| 1901 | 2 073 | 87 797 | 46 296 | 41 501 | 42.3 | 22.3 | 20.0 |
| 1902 | 2 113 | 96 641 | 55 423 | 41 218 | 45.7 | 26.2 | 19.5 |
| 1903 | 2 154 | 94 936 | 53 236 | 41 700 | 44.1 | 24.7 | 19.4 |
| 1904 | 2 194 | 99 265 | 55 436 | 43 829 | 45.3 | 25.3 | 20.0 |
| 1905 | 2 237 | 80 085 | 62 387 | 17 698 | 35.8 | 27.9 | 7.9 |
| 1906 | 2 267 | 95 090 | 55 638 | 39 452 | 41.9 | 24.5 | 17.4 |
| 1907 | 2 303 | 107 195 | 59 964 | 47 231 | 46.5 | 26.0 | 20.5 |
| 1908 | 2 345 | 96 088 | 54 772 | 41 316 | 41.0 | 23.4 | 17.6 |
| 1909 | 2 395 | 105 681 | 62 498 | 43 183 | 44.1 | 26.1 | 18.0 |
| 1910 | 2 441 | 101 544 | 77 356 | 24 188 | 41.6 | 31.7 | 9.9 |
| 1911 | 2 488 | 97 864 | 74 093 | 23 771 | 39.3 | 29.8 | 9.6 |
| 1912 | 2 540 | 102 654 | 77 431 | 25 223 | 40.4 | 30.5 | 9.9 |
| 1913 | 2 602 | 102 397 | 77 745 | 24 652 | 39.4 | 29.9 | 9.5 |
| 1914 | 2 625 | 100 871 | 79 202 | 21 669 | 38.4 | 30.2 | 8.3 |
After WW II, total area[6][7]
| Average population (x 1000) | Live births | Deaths | Natural change | Crude birth rate (per 1000) | Crude death rate (per 1000) | Natural change (per 1000) | Total fertility rate | Urban Fertility | Rural Fertility | |
|---|---|---|---|---|---|---|---|---|---|---|
| 1945 | 2 028 (e) | 42 795 | 78 797 | -36 002 | 21.1 | 38.9 | -17.8 | |||
| 1946 | 2 254 (e) | 64 462 | 64 371 | 91 | 28.6 | 28.5 | 0.1 | |||
| 1947 | 2 188 (e) | 57 555 | 165 049 | -107 494 | 26.3 | 75.5 | -49.2 | |||
| 1948 | 2 126 (e) | 73 123 | 35 846 | 37 277 | 34.4 | 16.9 | 17.5 | |||
| 1949 | 2 236 (e) | 94 180 | 30 407 | 63 773 | 42.1 | 13.6 | 28.5 | |||
| 1950 | 2 341 | 91 137 | 26 363 | 64 774 | 38.9 | 11.3 | 27.7 | |||
| 1951 | 2 381 | 91 645 | 25 957 | 65 688 | 38.5 | 10.9 | 27.6 | |||
| 1952 | 2 432 | 80 918 | 30 968 | 49 950 | 33.3 | 12.7 | 20.5 | |||
| 1953 | 2 491 | 79 041 | 23 257 | 55 784 | 31.7 | 9.3 | 22.4 | |||
| 1954 | 2 557 | 83 607 | 24 077 | 59 530 | 32.7 | 9.4 | 23.3 | |||
| 1955 | 2 627 | 79 772 | 21 864 | 57 908 | 30.4 | 8.3 | 22.0 | |||
| 1956 | 2 701 | 81 372 | 20 109 | 61 263 | 30.1 | 7.4 | 22.7 | |||
| 1957 | 2 777 | 85 743 | 21 114 | 64 629 | 30.9 | 7.6 | 23.3 | |||
| 1958 | 2 853 | 87 502 | 18 741 | 68 761 | 30.7 | 6.6 | 24.1 | 3.54 | ||
| 1959 | 2 929 | 92 176 | 21 467 | 70 709 | 31.5 | 7.3 | 24.1 | 3.64 | ||
| 1960 | 3 003 | 87 910 | 19 290 | 68 620 | 29.3 | 6.4 | 22.9 | 3.41 | ||
| 1961 | 3 073 | 86 683 | 19 590 | 67 093 | 28.2 | 6.4 | 21.8 | 3.20 | ||
| 1962 | 3 141 | 80 494 | 21 365 | 59 129 | 25.6 | 6.8 | 18.8 | 3.00 | ||
| 1963 | 3 208 | 78 422 | 20 737 | 57 685 | 24.4 | 6.5 | 18.0 | 2.89 | ||
| 1964 | 3 273 | 73 583 | 19 944 | 53 639 | 22.5 | 6.1 | 16.4 | 2.71 | ||
| 1965 | 3 335 | 67 996 | 20 571 | 47 425 | 20.4 | 6.2 | 14.2 | 2.68 | ||
| 1966 | 3 395 | 71 406 | 21 474 | 49 326 | 21.0 | 6.3 | 14.5 | 2.73 | ||
| 1967 | 3 453 | 71 380 | 23 406 | 47 294 | 20.7 | 6.8 | 13.7 | 2.69 | ||
| 1968 | 3 506 | 69 997 | 24 268 | 45 532 | 20.0 | 6.9 | 13.0 | 2.65 | ||
| 1969 | 3 549 | 67 575 | 26 249 | 40 651 | 19.0 | 7.4 | 11.5 | 2.58 | ||
| 1970 | 3 594 | 69 778 | 26 577 | 43 201 | 19.4 | 7.4 | 12.0 | 2.56 | ||
| 1971 | 3 647 | 73 643 | 27 889 | 45 754 | 20.2 | 7.6 | 12.5 | 2.63 | ||
| 1972 | 3 700 | 76 198 | 28 001 | 48 197 | 20.6 | 7.6 | 13.0 | 2.63 | ||
| 1973 | 3 748 | 76 339 | 30 756 | 45 583 | 20.4 | 8.2 | 12.2 | 2.59 | ||
| 1974 | 3 794 | 77 474 | 32 216 | 45 258 | 20.4 | 8.5 | 11.9 | 2.55 | ||
| 1975 | 3 839 | 79 169 | 35 635 | 43 534 | 20.6 | 9.3 | 11.3 | 2.52 | ||
| 1976 | 3 877 | 79 863 | 34 812 | 45 051 | 20.6 | 9.0 | 11.6 | 2.46 | ||
| 1977 | 3 910 | 79 022 | 37 250 | 41 772 | 20.2 | 9.5 | 10.7 | 2.40 | ||
| 1978 | 3 936 | 78 994 | 38 410 | 40 584 | 20.1 | 9.8 | 10.3 | 2.38 | 1.70 | 3.00 |
| 1979 | 3 967 | 80 152 | 41 729 | 38 423 | 20.2 | 10.5 | 9.7 | 2.39 | 1.80 | 2.90 |
| 1980 | 4 010 | 79 580 | 40 472 | 39 108 | 19.8 | 10.1 | 9.8 | 2.41 | 1.80 | 2.90 |
| 1981 | 4 054 | 82 279 | 41 476 | 40 803 | 20.3 | 10.2 | 10.1 | 2.45 | 1.80 | 3.10 |
| 1982 | 4 097 | 83 258 | 41 046 | 42 212 | 20.3 | 10.0 | 10.3 | 2.43 | 1.79 | 3.19 |
| 1983 | 4 137 | 91 304 | 44 329 | 46 975 | 22.1 | 10.7 | 11.4 | 2.57 | 1.87 | 3.46 |
| 1984 | 4 175 | 89 637 | 45 537 | 44 100 | 21.5 | 10.9 | 10.6 | 2.67 | 1.95 | 3.65 |
| 1985 | 4 214 | 90 453 | 46 075 | 44 378 | 21.5 | 10.9 | 10.5 | 2.70 | 2.00 | 3.70 |
| 1986 | 4 255 | 94 726 | 40 437 | 54 289 | 22.3 | 9.5 | 12.8 | 2.78 | 2.00 | 3.80 |
| 1987 | 4 290 | 91 762 | 40 185 | 51 577 | 21.4 | 9.4 | 12.0 | 2.70 | 2.10 | 3.80 |
| 1988 | 4 321 | 88 568 | 40 912 | 47 656 | 20.5 | 9.5 | 11.0 | 2.63 | 2.00 | 3.60 |
| 1989 | 4 349 | 82 221 | 40 113 | 42 108 | 18.9 | 9.2 | 9.7 | 2.46 | 2.02 | 3.00 |
| 1990 | 4 364 | 77 085 | 42 427 | 34 658 | 17.7 | 9.7 | 7.9 | 2.39 | 1.91 | 3.07 |
| 1991 | 4 363 | 72 020 | 45 849 | 26 171 | 16.5 | 10.5 | 6.0 | 2.26 | 1.79 | 2.84 |
| 1992 | 4 353 | 69 654 | 44 522 | 25 132 | 16.0 | 10.2 | 5.8 | 2.21 | 1.68 | 2.86 |
| 1993 | 4 350 | 66 179 | 46 637 | 19 542 | 15.2 | 10.7 | 4.5 | 2.10 | 1.53 | 2.77 |
| 1994 | 4 350 | 62 085 | 52 153 | 9 932 | 14.3 | 12.0 | 2.3 | 1.95 | 1.44 | 2.54 |
| 1995 | 4 340 | 56 411 | 52 969 | 3 442 | 13.0 | 12.2 | 0.8 | 1.76 | 1.31 | 2.24 |
| 1996 | 4 325 | 51 865 | 49 748 | 2 117 | 12.0 | 11.5 | 0.5 | 1.60 | 1.19 | 2.05 |
| 1997 | 4 311 | 51 286 | 51 138 | 148 | 11.9 | 11.9 | 0.0 | 1.55 | ||
| 1998 | 4 299 | 46 755 | 47 691 | – 936 | 10.9 | 11.1 | -0.2 | 1.48 | ||
| 1999 | 4 287 | 43 511 | 48 904 | -5 393 | 10.1 | 11.4 | -1.3 | 1.43 |
(e)= estimate
Moldova under the central government control
| Average population (x 1000) | Live births | Deaths | Natural change | Crude birth rate (per 1000) | Crude death rate (per 1000) | Natural change (per 1000) | Total fertility rate (TFR) | Urban TFR | Rural TFR | |
|---|---|---|---|---|---|---|---|---|---|---|
| 1997 | 3 654 | 45 583 | 42 957 | 2 626 | 12.5 | 11.8 | 0.7 | 1.73 | 1.36 | 2.09 |
| 1998 | 3 652 | 41 332 | 39 922 | 1 410 | 11.3 | 10.9 | 0.4 | 1.67 | 1.32 | 2.03 |
| 1999 | 3 647 | 38 501 | 41 315 | -2 814 | 10.6 | 11.3 | -0.8 | 1.61 | 1.26 | 1.97 |
| 2000 | 3 640 | 36 939 | 41 224 | -4 285 | 10.2 | 11.3 | -1.2 | 1.57 | 1.23 | 1.95 |
| 2001 | 3 631 | 36 448 | 40 075 | -3 627 | 10.0 | 11.0 | -1.0 | 1.48 | 1.21 | 1.92 |
| 2002 | 3 623 | 35 705 | 41 852 | -6 147 | 9.9 | 11.6 | -1.7 | 1.41 | 1.13 | 1.89 |
| 2003 | 3 613 | 36 471 | 43 079 | -6 608 | 10.1 | 11.9 | -1.8 | 1.47 | 1.18 | 1.88 |
| 2004 | 3 604 | 38 272 | 41 668 | -3 396 | 10.6 | 11.6 | -0.9 | 1.50 | 1.19 | 1.91 |
| 2005 | 3 595 | 37 695 | 44 689 | -6 994 | 10.5 | 12.4 | -1.9 | 1.219 | 0,94 | 1.301 |
| 2006 | 3 586 | 37 587 | 43 137 | -5 550 | 10.5 | 12.0 | -1.5 | 1.228 | 1.025 | 1.387 |
| 2007 | 3 577 | 37 973 | 43 050 | -5 077 | 10.6 | 12.0 | -1.4 | 1.256 | 0.973 | 1.543 |
| 2008 | 3 570 | 39 018 | 41 948 | -2 930 | 10.9 | 11.7 | -0.8 | 1.277 | 1.018 | 1.533 |
| 2009 | 3 566 | 40 809 | 42 122 | -1 313 | 11.4 | 11.8 | -0.4 | 1.326 | 1.048 | 1.582 |
| 2010 | 3 563 | 40 474 | 43 631 | -3 157 | 11.4 | 12.3 | -0.9 | 1.309 | 1.055 | 1.531 |
| 2011 | 3 560 | 39 182 | 39 249 | -67 | 11.0 | 11.0 | -0.0 | 1.266 | 1.009 | 1.482 |
| 2012 | 3 560 | 39 234 | 39 560 | -326 | 11.0 | 11.1 | -0.1 | 1.279 | 1.030 | 1.483 |
| 2013 | 3 559 | 37 859 | 38 060 | -201 | 10.6 | 10.7 | -0.1 | 1.238 | 0.975 | 1.449 |
| 2014 | 3 555 | 38 616 | 39 494 | -878 | 10.9 | 11.1 | -0.2 | 1.279 | 0.996 | 1.499 |
| 2015 | 3 553 | 38 610 | 39 906 | -1,296 | 10.9 | 11.2 | -0.3 | 1.301 | 0.980 | 1.542 |
Transnistrian-controlled areas[8]
| Average population (x 1000) | Live births | Deaths | Natural change | Crude birth rate (per 1000) | Crude death rate (per 1000) | Natural change (per 1000) | |
|---|---|---|---|---|---|---|---|
| 1997 | 657 | 5 703 | 8 181 | -2 478 | 8.7 | 12.5 | -3.8 |
| 1998 | 647 | 5 423 | 7 769 | -2 346 | 8.4 | 12.0 | -3.6 |
| 1999 | 640 | 5 010 | 7 589 | -2 579 | 7.8 | 11.9 | -4.0 |
| 2000 | 656 | 5 010 | 7 770 | -2 760 | 7.6 | 11.8 | -4.2 |
| 2001 | 647 | 4 530 | 7 770 | -3 240 | 7.0 | 12.0 | -5.0 |
| 2002 | 638 | 4 660 | 8 100 | -3 440 | 7.3 | 12.7 | -5.4 |
| 2003 | 629 | 4 460 | 8 170 | -3 710 | 7.1 | 13.0 | -5.9 |
| 2004 | 558 | 4 840 | 8 031 | -3 191 | 8.7 | 14.4 | -5.7 |
| 2005 | 551 | 4 664 | 8 186 | -3 522 | 8.5 | 14.8 | -6.4 |
| 2006 | 544 | 4 840 | 8 320 | -3 480 | 8.9 | 15.3 | -6.4 |
| 2007 | 537 | 4 893 | 8 132 | -3 239 | 9.1 | 15.1 | -6.0 |
| 2008 | 531 | 5 290 | 7 967 | -2 677 | 10.0 | 15.0 | -5.0 |
| 2009 | 525 | 5 189 | 7 454 | -2 265 | 9.9 | 14.2 | -4.3 |
| 2010 | 520 | 5 189 | 7 709 | -2 520 | 10.0 | 14.8 | -4.8 |
| 2011 | 516 | 4 999 | 7 289 | -2 290 | 9.7 | 14.1 | -4.4 |
| 2012 | 511 | 5 173 | 7 280 | -2 107 | 10.1 | 14.2 | -4.1 |
| 2013 | 507 | 4 825 | 6 867 | -2 042 | 9.5 | 13.5 | -4.0 |
Fertility Rate (The Demographic Health Survey) [9]
Fertility Rate (TFR) (Wanted Fertility Rate) and CBR (Crude Birth Rate):
| Year | CBR (Total) | TFR (Total) | CBR (Urban) | TFR (Urban) | CBR (Rural) | TFR (Rural) |
|---|---|---|---|---|---|---|
| 2005 | 12,0 | 1,7 | 12,5 | 1,5 | 11,7 | 1,8 |
Ethnic groups
Moldovans are the largest ethnic group in Moldova. According to the combined data of the census in the government controlled area and the census in Transnistria in 2004 they account for 69.6% of the country's population. The proportion of Ukrainians and Russians decreased considerably in comparison to the last Soviet census in 1989: from 13.8% to 11.2% and from 13.0% to 9.4% respectively. This is mostly due to emigration. Ukrainians mostly live in the east (Transnistria) and the north, while Russians mostly live in urban areas: 27% of all Russians live in Chişinău, 18% live in Tiraspol, 11% in Bender and 6% in Bălţi. The Gagauz people are the fourth-largest ethnic group (3.8% in 2004). Most of them live in the south of Moldova in the autonomous region of Gagauzia.
Total area
| Ethnic group |
census 19591 | census 19702 | census 19793 | census 19894 | census 20045 | census 20145 | ||||||
|---|---|---|---|---|---|---|---|---|---|---|---|---|
| Number | % | Number | % | Number | % | Number | % | Number | % | Number | % | |
| Moldovans8 | 1,886,566 | 65.4 | 2,303,916 | 64.6 | 2,525,687 | 63.9 | 2,794,749 | 64.5 | 2,742,231 | 69.6 | 1,654,744 | 56.8 |
| Romanians | 1,663 | 0.1 | 1,581 | 0.0 | 1,657 | 0.0 | 2,477 | 0.1 | 73,529 | 1.9 | 675,881 | 23.2 |
| Ukrainians | 420,820 | 14.6 | 506,560 | 14.2 | 560,679 | 14.2 | 600,366 | 13.8 | 442,475 | 11.2 | 221,409 | 7.6 |
| Russians | 292,930 | 10.2 | 414,444 | 11.6 | 505,730 | 12.8 | 562,069 | 13.0 | 369,896 | 9.4 | 159,065 | 5.4 |
| Gagauzians | 95,856 | 3.3 | 124,902 | 3.5 | 138,000 | 3.5 | 153,548 | 3.5 | 151,596 | 3.8 | 113,327 | 3.9 |
| Bulgarians | 61,652 | 2.1 | 73,776 | 2.1 | 80,665 | 2.0 | 88,419 | 2.0 | 79,520 | 2.0 | 47,778 | 1.7 |
| Romani | 7,265 | 0.3 | 9,235 | 0.3 | 10,666 | 0.3 | 11,571 | 0.3 | 12,778 | 0.3 | ||
| Jews | 95,104 | 3.3 | 98,062 | 2.7 | 80,124 | 2.0 | 65,799 | 1.5 | 4,867 | 0.1 | ||
| Poles | 4,783 | 0.2 | 4,899 | 0.1 | 4,961 | 0.1 | 4,739 | 0.1 | 4,174 | 0.1 | ||
| Others | 17,838 | 0.6 | 31,498 | 0.9 | 41,587 | 1.1 | 51,623 | 1.2 | 57,613 | 1.5 | 41,077 | 1.4 |
| Total | 2,884,477 | 3,568,873 | 3,949,756 | 4,335,360 | 3,938,679 | 2,913,281 | ||||||
| 1 Source: . 2 Source: . 3 Source: . 4 Source: . 5 Source: 6 2004 combined censuses of the government controlled area and Transnistria 6 2014 census only in government controlled area. 8 There is an ongoing controversy, whether Romanians and Moldovans should be counted together. | ||||||||||||
Moldova under the central government control
Ethnic composition of the main part of Moldova, according to the 2004 census, was:
| ethnic group | total population | urban | rural | |||
|---|---|---|---|---|---|---|
| population | % | population | % | population | % | |
| Moldovans | 2,564,849 1 | 75.8% | 826,103 | 63.27% | 1,738,747 | 83.69% |
| Ukrainians | 282,406 | 8.35% | 145,890 | 11.17% | 136,516 | 6.57% |
| Russians | 201,218 | 5.95% | 166,395 | 12.74% | 34,823 | 1.68% |
| Gagauzians | 147,500 | 4.36% | 53,613 | 4.11% | 93,887 | 4.52% |
| Romanians | 73,276 | 2.2% | 44,342 | 3.4% | 28,934 | 1.39% |
| Bulgarians | 65,662 | 1.94% | 29,447 | 2.26% | 36,215 | 1.74% |
| Gypsies | 12,271 | 0.36% | 8,139 | 0.62% | 4,132 | 0.20% |
| Jews | 3,608 | 0.11% | 3,509 | 0.27% | 99 | 0.01% |
| Poles | 2,383 | 0.07% | 2,019 | 0.15% | 364 | 0.02% |
| others and undeclared | 30,157 | 0.89% | 26,197 | 2.01% | 3,960 | 0.19% |
| Total | 3,383,332 | 100% | 1,305,655 | 100% | 2,077,677 | 100% |
Declared country of birth for the current inhabitants of the part of Moldova under the central government control, according to the 2004 census:
| ethnic group | total population | urban | rural | |||||||||||||||
|---|---|---|---|---|---|---|---|---|---|---|---|---|---|---|---|---|---|---|
| total | Moldova | former USSR | other countries | non-declared | total | Moldova | former USSR | other countries | non-declared | total | Moldova | former USSR | other countries | non-declared | ||||
| Moldovans and Romanians | 2,638,125 100% | 2,604,051 98.71% | 30,360 1.15% | 3,345 0.13% | 369 0.01% | 870,445 100% | 848,554 % | 19,501 % | 2,081 % | 309 % | 1,767,680 100% | 1,755,497 % | 10,859 % | 1,264 % | 60 % | |||
| Ukrainians | 282,406 100% | 227,750 80.65% | 54,036 19.13% | 598 0.21% | 22 0.01% | 145,890 100% | 103,039 % | 42,318 % | 514 % | 19 % | 136,516 100% | % | 11,718 % | 84 % | 3 % | |||
| Russians | 201,218 100% | 129,664 64.44% | 70,380 34.98% | 1,096 0.54% | 78 0.04% | 166,395 100% | 106,580 % | 58,739 % | 1,011 % | 65 % | 34,823 100% | 23,084 % | 11,641 % | 85 % | 13 % | |||
| Gagauzians | 147,500 100% | 144,268 97.81% | 3,101 2.10% | 120 0.08% | 11 0.01% | 53,613 100% | 51,586 % | 1,941 % | 76 % | 10 % | 93,887 100% | 92,682 % | 1,160 % | 44 % | 1 % | |||
| Bulgarians | 65,662 100% | 59,489 90.60% | 5,968 9.09% | 199 0.30% | 6 0.01% | 29,447 100% | 25,215 % | 4,071 % | 156 % | 5 % | 36,215 100% | 34,274 % | 1,897 % | 43 % | 1 % | |||
| others | 34,401 100% | 22,702 65.99% | 10,797 31.39% | 894 2.60% | 8 0.02% | 26,058 100% | 16,973 % | 8,358 % | 722 % | 5 % | 8,343 100% | 5,729 % | 2,439 % | 172 % | 3 % | |||
| non-declared | 14,020 100% | 13,894 99.10% | 12 0.09% | 28 0.20% | 86 0.61% | 13,807 100% | 13,668 % | 9 % | 27 % | 83 % | 213 100% | 206 % | 3 % | 1 % | 3 % | |||
| Total | 3,383,332 100% | 3,201,818 94.64% | 174,654 5.16% | 6,280 0.19% | 580 0.02% | 1,305,655 100% | 1,165,635 89.28% | 134,937 10.33% | 4,587 0.35% | 496 0.04% | 2,077,677 100% | 2,036,183 98.00% | 39,717 1.91% | 1,693 0.08% | 84 0.004% | |||
Population by district, according to the 2004 census:
| Population | Moldovans1 | Ukrainians | Russians | Gagauzians | Bulgarians | Romanians1 | Jews | Poles | Gypsies | others | |
|---|---|---|---|---|---|---|---|---|---|---|---|
| Chişinău | 712,218 | 481,626
|
58,945
|
99,149
|
6,446
|
8,868
|
31,984
|
2,649
|
834
|
507
|
21,210
|
| Bălţi | 127,561 | 66,877
|
30,288
|
24,526
|
243
|
297
|
2,258
|
411
|
862
|
272
|
1,527
|
| Gagauzia | 155,646 | 7,481
|
4,919
|
5,941
|
127,835
|
8,013
|
38
|
17
|
28
|
486
|
888
|
| Anenii Noi | 81,710 | 68,761
|
6,526
|
4,135
|
235
|
481
|
857
|
17
|
28
|
228
|
442
|
| Basarabeasca | 28,978 | 20,218
|
1,948
|
2,568
|
2,220
|
1,544
|
70
|
13
|
5
|
216
|
176
|
| Briceni | 78,027 | 55,123
|
19,939
|
2,061
|
59
|
45
|
314
|
84
|
10
|
187
|
205
|
| Cahul | 119,231 | 91,001
|
7,842
|
7,702
|
3,665
|
5,816
|
2,095
|
40
|
29
|
238
|
803
|
| Cantemir | 60,001 | 52,986
|
969
|
710
|
519
|
3,736
|
910
|
–
|
11
|
43
|
117
|
| Călăraşi | 75,075 | 69,190
|
2,799
|
947
|
54
|
47
|
1,490
|
21
|
11
|
378
|
138
|
| Căuşeni | 90,612 | 79,432
|
2,469
|
3,839
|
653
|
1,108
|
2,844
|
8
|
9
|
30
|
220
|
| Cimişlia | 60,925 | 52,972
|
3,376
|
2,371
|
278
|
1,341
|
331
|
7
|
10
|
95
|
144
|
| Criuleni | 72,254 | 67,046
|
2,692
|
1,008
|
49
|
72
|
1,170
|
6
|
6
|
36
|
169
|
| Donduşeni | 46,442 | 37,302
|
5,893
|
2,714
|
31
|
36
|
247
|
12
|
15
|
68
|
124
|
| Drochia | 87,092 | 74,369
|
9,849
|
1,641
|
44
|
33
|
675
|
14
|
10
|
272
|
185
|
| Dubăsari | 34,015 | 32,652
|
521
|
611
|
45
|
16
|
102
|
9
|
2
|
–
|
57
|
| Edineţ | 81,390 | 58,749
|
16,084
|
5,084
|
143
|
91
|
446
|
23
|
26
|
499
|
245
|
| Făleşti | 90,320 | 75,863
|
10,711
|
3,064
|
39
|
32
|
306
|
6
|
20
|
57
|
222
|
| Floreşti | 89,389 | 75,797
|
8,023
|
4,633
|
45
|
51
|
433
|
19
|
29
|
120
|
239
|
| Glodeni | 60,975 | 46,317
|
11,918
|
1,693
|
32
|
44
|
329
|
8
|
174
|
303
|
157
|
| Hînceşti | 119,762 | 108,189
|
6,218
|
1,463
|
99
|
212
|
3,046
|
19
|
16
|
305
|
195
|
| Ialoveni | 97,704 | 91,379
|
1,117
|
1,112
|
95
|
935
|
2,608
|
5
|
12
|
197
|
244
|
| Leova | 51,056 | 43,673
|
1,245
|
1,167
|
432
|
3,804
|
471
|
8
|
9
|
105
|
142
|
| Nisporeni | 64,924 | 60,774
|
223
|
339
|
17
|
28
|
2,329
|
1
|
4
|
1,147
|
62
|
| Ocniţa | 56,510 | 32,491
|
17,351
|
2,764
|
79
|
60
|
104
|
14
|
43
|
3,417
|
187
|
| Orhei | 116,271 | 100,469
|
4,520
|
2,216
|
113
|
90
|
8,253
|
46
|
23
|
221
|
320
|
| Rezina | 48,105 | 44,721
|
1,691
|
1,093
|
34
|
40
|
375
|
30
|
5
|
13
|
103
|
| Rîşcani | 69,454 | 50,391
|
15,632
|
1,726
|
60
|
61
|
777
|
8
|
42
|
602
|
155
|
| Sîngerei | 87,153 | 74,139
|
8,456
|
3,029
|
47
|
43
|
1,162
|
10
|
48
|
56
|
163
|
| Soroca | 94,986 | 84,728
|
4,752
|
2,601
|
53
|
48
|
931
|
65
|
17
|
1,564
|
227
|
| Străşeni | 88,900 | 83,368
|
985
|
1,576
|
70
|
109
|
2,542
|
13
|
14
|
24
|
199
|
| Şoldăneşti | 42,227 | 40,354
|
1,055
|
376
|
9
|
14
|
299
|
2
|
-
|
74
|
44
|
| Ştefan Vodă | 70,594 | 65,318
|
2,182
|
1,918
|
64
|
145
|
562
|
1
|
4
|
219
|
181
|
| Taraclia | 43,154 | 5,980
|
2,646
|
2,139
|
3,587
|
28,293
|
29
|
2
|
9
|
218
|
251
|
| Teleneşti | 70,126 | 67,309
|
879
|
537
|
16
|
16
|
1,262
|
4
|
1
|
6
|
96
|
| Ungheni | 110,545 | 97,805
|
7,743
|
2,766
|
90
|
93
|
1,627
|
16
|
17
|
68
|
320
|
| Subtotal controlled by central government | 3,383,332 | 2,564,850
|
282,406
|
201,218
|
147,500
|
65,662
|
73,276
|
3,608
|
2,383
|
12,271
|
30,157
|
1There is an ongoing controversy over whether Moldovans are a subset of Romanians, or a distinct ethnic group. At the 2004 Moldovan Census, citizens could declare only one nationality. Consequently, one could not declare oneself both Moldovan and Romanian.
Transnistrian-controlled areas
| Population | Mold. | Russians | Ukrainians | Gagauzes | Bulg. | Gyps. | Jews | Poles | Belor. | Germ. | Armen. | others, non-decl. | |
|---|---|---|---|---|---|---|---|---|---|---|---|---|---|
| Tiraspol | 158,069 | 23,790
15.05% |
65,928
41.71% |
52,278
33.07% |
1,988
1.26% |
2,450
1.55% |
116
0.07% |
573
0.36% |
324
0.20% |
1,712
1.08% |
701
0.44% |
360
0.23% |
7,849
|
| Camenca District | 27,284 | 13,048
47.82% |
1,880
6.89% |
11,610
42.55% |
43
0.16% |
59
0.22% |
9
0.03% |
10
0.04% |
447
1.64% |
85
0.31% |
26
0.10% |
16
0.06% |
51
0.19% |
| Rîbnița District | 82,699 | 24,729
29.90% |
14,237
17.22% |
37,554
45.41% |
149
0.18% |
309
0.37% |
51
0.06% |
177
0.21% |
528
0.64% |
412
0.50% |
150
0.18% |
81
0.10% |
4,322
5.23% |
| Dubăsari District | 36,734 | 18,080
49.22% |
7,125
19.40% |
10,594
28.84% |
92
0.25% |
134
0.36% |
46
0.13% |
46
0.13% |
53
0.14% |
185
0.50% |
63
0.17% |
126
0.34% |
190
0.52% |
| Grigoriopol District | 48,000 | 31,118
64.83% |
7,332
15.28% |
8,333
17.36% |
123
0.26% |
240
0.50% |
13
0.03% |
26
0.05% |
100
0.21% |
187
0.39% |
327
0.68% |
62
0.13% |
139
0.29% |
| Slobozia District | 86,742 | 36,651
42.25% |
20,636
23.79% |
19,872
22.91% |
512
0.59% |
7,323
8.44% |
133
0.15% |
35
0.04% |
137
0.16% |
475
0.55% |
496
0.57% |
140
0.16 |
332
0.38% |
| Subtotal Transnistria | 439,528 | 147,416
33.54% |
117,138
26.65% |
140,241
31.91% |
2,907
0.66% |
10,515
2.39% |
368
0.08% |
867
0.20% |
1,589
0.36% |
3,056
0.70% |
1,763
0.40% |
785
0.18% |
12,883
2.93% |
| Bender (w/o Protegailovca) | 97,027 | 24,374
25.12% |
41,949
43.23% |
17,348
17.88% |
1,066
1.10% |
3,001
3.09% |
132
0.14% |
383
0.39% |
190
0.21% |
713
0.73% |
258
0.27% |
173
0.18% |
7,440
7.67% |
| Proteagailovca | 3,142 | 756–761
24.12% |
1,482
47.17% |
658
20.94% |
25
0.80% |
163
5.19% |
0–5
0.06% |
2
0.06% |
0–12
0.19% |
19
0.60% |
6
0.19% |
0–16
0.25% |
0–31
0.48% |
| Gîsca | 4,841 | 819–824
16.98% |
2,956
61.06% |
719
14.85% |
91
1.88% |
168
3.47% |
0–5
0.04% |
7
0.14% |
0–12
0.12% |
8
0.17% |
22
0.45% |
0–16
0.17% |
13–44
0.60% |
| Chiţcani (incl. Mereneşti and Zahorna) | ~9,000 | ~3,100
~35% |
~4,800
~53% |
~900
~10% |
N/A
90% |
N/A
90% |
N/A
90% |
N/A
90% |
N/A
90% |
N/A
90% |
N/A
90% |
N/A
90% |
~200
~2% |
| Cremenciug | 1,094 | 465
42.50% |
353
32.27% |
203
18.56% |
7
0.64% |
11
1.01% |
2
0.18% |
-
- |
-
- |
15
1.37% |
22
2.01% |
6
0.55% |
10
0.91% |
| Roghi | 715[10] | ~700
~95% |
N/A
90% |
N/A
90% |
N/A
90% |
N/A
90% |
N/A
90% |
N/A
90% |
N/A
90% |
N/A
90% |
N/A
90% |
N/A
90% |
~15
~5% |
| Subotal other localities | 115,819 | 30,219
26.09% |
51,540
44.50% |
19,828
17.12% |
1,189
1.03% |
3,343
2.89% |
139
0.12% |
392
0.34% |
202
0.17% |
755
0.65% |
308
0.27% |
195
0.17% |
7,709
6.66% |
| Total Tiraspol-controlled areas | 555,347 | 177,635
31.99% |
168,678
30.37% |
160,069
28.82% |
4,096
0.74% |
13,858
2.50% |
507
0.09% |
1,259
0.23% |
1,791
0.32% |
3,811
0.69% |
2,071
0.37% |
980
0.18% |
20,592
3.71% |
Notes:
- The exact numbers in the above table are taken from the data published by the Transnistrian breakaway authorities after the 2004 Census in Transnistria, except the population of Roghi, which was taken from website of the Dubăsari District of Transnistria.
- The number of inhabitants of Slobozia District + that of the commune Chiţcani was given by Transnisrian authorities as 95,742. Other sources indicate ~9,000 for Chiţcani. In this table it is assumed there are 9,000 inhabitantts in Chiţcani, and 86,742 in Slobozia District. Should the exact data of the census for Chiţcani be available, the entries in the lines of Slobozia District and of Chiţcani should be corrected accordingly.
- Transnistrian authorities have published the ethnic composition for the combined population of the Dubăsari District and the village of Roghi in Molovata Nouă commune. Other sources indicate that the latter is almost entirely Moldovan. In this table it is assumed that of the 715 inhabitants of this village, 700 are Moldovan and 15 are others. Should the exact ethnicity data of the census for Roghi be available, the entries for ethnicities in the lines of Dubăsari District and of Roghi should be corrected accordingly.
- Percentages are calculated from the absolute numbers
Languages
Romanian is the official language of Moldova. However, many speakers use the term Moldovan to describe the language they speak, despite the fact that its literary standard is virtually identical to Romanian.
Native language
Currently, 2,588,355 people or 76.51% of the inhabitants of right bank Moldova (proper) have Moldovan/Romanian as native language, of which 2,029,847 (60.00%) declared it Moldovan and 558,508 (16.51%) declared it Romanian. 380,796 people or 11.26% have Russian as native language, 186,394 or 5.51% – Ukrainian, 137,774 or 4.07% – Gagauz, 54,401 or 1.61% – Bulgarian, 21,504 or 0.63% – another language, and 14,108 or 0.41% did not declare one.
First language in daily use
According to the 2004 census, 2,543,354 people or 75.17% of the inhabitants of Moldova (proper) have Moldovan/Romanian as first language, of which 1,988,540 (58.77%) declared it Moldovan and 554,814 (16.40%) declared it Romanian. 540,990 people or 15.99% have Russian as first language, 130,114 or 3.85% – Ukrainian, 104,890 or 3.10% – Gagauz, 38,565 or 1.14% – Bulgarian, 11,318 or 0.34% – another language, and 14,101 or 0.41% did not declare one.
| Ethnic group \ First language | Moldovan | Romanian | Russian | Ukrainian | Gagauzian | Bulgarian | other language | did non declare | Total |
|---|---|---|---|---|---|---|---|---|---|
| Moldovans | 1,949,318 | 475,126 | 128,372 | 9,170 | 799 | 1,113 | 951 | - | 2,564,849 |
| Romanians | 1,597 | 69,936 | 1,537 | 81 | 5 | 4 | 116 | - | 73,276 |
| Russians | 8,852 | 2,805 | 187,526 | 1,224 | 329 | 344 | 138 | – | 201,218 |
| Ukrainians | 17,491 | 4,158 | 141,206 | 118,699 | 427 | 294 | 131 | – | 282,406 |
| Gagauzians | 2,756 | 609 | 40,445 | 413 | 102,395 | 821 | 61 | – | 147,500 |
| Bulgarians | 4,652 | 1,046 | 23,259 | 188 | 673 | 35,808 | 36 | – | 65,662 |
| other ethnic groups | 3,828 | 1,133 | 18,610 | 339 | 262 | 181 | 9,856 | 192 | 34,401 |
| did non declare | 46 | 1 | 35 | – | – | – | 29 | 13,909 | 14,020 |
| Total by language of first use | 1,988,540 58.77% |
554,814 16.4% |
540,990 15.99% |
130,114 3.85% |
104,890 3.10% |
38,565 1.14% |
11,318 0.34% |
14,101 0.41% |
3,383,332 100% |
Usage of own language by the ethnic groups of Moldova
| ethnic group | own language | Moldovan and Romanian | Russian |
|---|---|---|---|
| Moldovans | 94.52% | – | 5% |
| Romanians | 97.62% | – | 2.1% |
| Russians | 93.20% | 5.79% | – |
| Ukrainians | 42.03% | 7.66% | 50.00% |
| Gagauzians | 69.42% | 2.28% | 27.42% |
| Bulgarians | 54.53% | 8.68% | 35.42% |
| others | up to 28.65% | 14.42% | 54.10% |
Urban areas
| ethnic group | own language | Moldovan and Romanian | Russian |
|---|---|---|---|
| Moldovans | 86.71% | – | 13.07% |
| Romanians | 96.88% | – | 2.85% |
| Russians | 95.85% | 3.82% | – |
| Ukrainians | 13.06% | 6.56% | 80.19% |
| Gagauzians | 40.10% | 2.19% | 57.23% |
| Bulgarians | 36.81% | 7.93% | 54.45% |
| others | up to 28.11% | 8.35% | 62.05% |
Rural areas
| ethnic group | own language | Moldovan and Romanian | Russian |
|---|---|---|---|
| Moldovans | 98.24% | – | 1.17% |
| Romanians | 98.76% | – | 0.94% |
| Russians | 80.52% | 15.25% | – |
| Ukrainians | 72.99% | 8.85% | 17.74% |
| Gagauzians | 86.16% | 2.33% | 10.40% |
| Bulgarians | 68.95% | 9.29% | 19.95% |
| others | up to 30.34% | 33.39% | 29.25% |
Soviet era data
In the Soviet census of 1989 members of most of the ethnic groups in Moldavian SSR claimed the language of their ethnicity as their mother tongue: Moldovans (95%), Ukrainians (62%), Russians (99%), Gagauz (91%), Bulgarians (79%), and Gipsies (82%). The exceptions were Jews (26% citing Yiddish), Belarusians (43%), Germans (31%), and Poles (10%).
In the Soviet census of 1989, 62% of the total population claimed Moldovan as their native language. Only 4% of the entire population claimed Moldovan as a second language.
In 1979, Russian was claimed as a native language by a large proportion of Jews (66%) and Belarusians (62%), and by a significant proportion of Ukrainians (30%). Proportions of other ethnicities naming Russian as a native language ranged from 17% of Bulgarians to 3% of Moldovans (Russian was more spoken by urban Moldovans than by rural Moldovans). Russian was claimed as a second language by a sizeable proportion of all ethnicities: Moldovans (46%), Ukrainians (43%), Gagauz (68%), Jews (30%), Bulgarians (67%), Belarusians (34%), Germans (53%), Roma (36%), and Poles (24%).
Religion
According to the 2004 census, the population of Moldova has the following religious composition:
| Religion | Adherents | % of total |
|---|---|---|
| Eastern Orthodox Christians | 3,158,015 | 93.3% |
|
Newer Protestant faiths
|
|
1.79% |
|
Traditional Protestant
|
|
0.19% |
| Old-Rite Christians b | 5,094 | 0.15% |
| Roman Catholics | 4,645 | 0.14% |
| Other religions | 29,813 | 0.88% |
| Non-religious | 33,207 | 0.98% |
| Atheists | 12,724 | 0.38% |
Notes: 75,727 (2.24% of population) did not answer that question.
a Known as Creştini după Evanghelie, Pentecostal group.
b Traditionally Orthodox Lipovans.
History
In 1940–1941, and 1944–1991, the Soviet government strictly limited the activities of the Orthodox Church (and all religions) and at times sought to exploit it, with the ultimate goal of abolishing it and all religious activity altogether. Most Orthodox churches and monasteries in Moldova were demolished or converted to other uses, such as administrative buildings or warehouses, and clergy were sometimes punished for leading services. Still, many believers continued to practice their faith.
People in the independent Moldova have much greater religious freedom than they did in Soviet times. Legislation passed in 1992 guarantees religious freedom, but requires all religious groups to be officially recognized by the government.
Orthodox Christians
In 1991, Moldova had 853 Orthodox churches and eleven Orthodox monasteries (four for monks and seven for nuns). In 1992 construction or restoration of 221 churches was underway, but clergy remained in short supply. As of 2004, Christian Orthodox constitute the vast majority of the population in all districts of Moldova.
In the interwar period, the vast majority of ethnic Moldovans belonged to the Romanian Orthodox Church (Bucharest Patriarchate), but today both Romanian and Russian Orthodox Church (Moscow Patriarchate) have jurisdiction in Moldova, with the latter having more parishes. According to the local needs, liturgy is performed in Romanian, Russian, and Turkic (Gagauz). After the revival of religious activity in the last 20 years, a minority of the clergy and the faithful wanted to return to the Bucharest Patriarchate (Metropolis of Bessarabia). Because higher-level church authorities were unable to resolve the matter, Moldova now has two episcopates, one for each patriarchate. After the Soviet occupation in 1940, the Metropolis was downgraded to a Bishopric. In late 1992, the Patriarch of Moscow and All Russia issued a decree upgrading its eparchy of Chişinău and Moldova to a Metropolis.
Greek Catholics
Moldova also has a Greek Catholic minority, mainly among ethnic Ukrainians, although the Soviet government declared the Greek Catholic Churches illegal in 1946 and forcibly united them with the Russian Orthodox Church. However, the Greek Catholic Churches had survived underground until the dissolution of the Soviet Union.
Roman Ctholics
Half of Moldova's Roman Catholics are in Chişinău, and 1/5 in Bălţi.
Old Believers
In addition, the Old Russian Orthodox Church (Old Believers) had fourteen churches and one monastery in Moldova in 1991.
Half of Moldova's Old Believers are in Floreşti district, and 1/5 in Sîngerei district.
Judaism
Despite the Soviet government's suppression and harassment, Moldova's practicing Jews managed to retain their religious identity. About a dozen Jewish newspapers were started in the early 1990s, and religious leaders opened a synagogue in Chişinău; there were six Jewish communities of worship throughout the country. In addition, Moldova's government created the Department of Jewish Studies at Chişinău State University, mandated the opening of a Jewish high school in Chişinău, and introduced classes in Judaism in high schools in several cities. The government also provides financial support to the Society for Jewish Culture.
Protestants
There are around 65,000 Protestants of all sects in Moldova today. There are more than 1,000 Baptists in the cities of Chişinău and Bălţi, in Cahul, Făleşti, Hînceşti, Sîngerei, Ştefan Vodă, and Ungheni districts, and in Găgăuzia. There are more than 1,000 Seventh-day Adventists in Cahul, Hînceşti and Sîngerei districts, and in Găgăuzia, there are more than 1,000 Penticostals in Chişinău and in Briceni district. There are more than 1,000 members of Brethren assemblies only in Chişinău. There are more than 1,000 Evangelical Synod-Presbyterians only in Chişinău.
Others
Other religious denominations in Moldova include:
- Armenian Apostolic Church
- Molokans (a Russian Orthodox sect).
Analysis
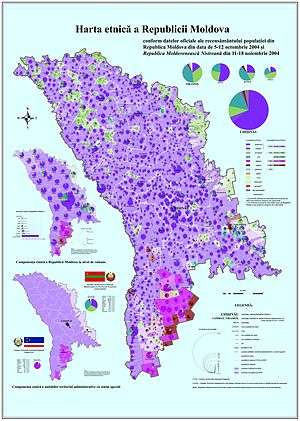
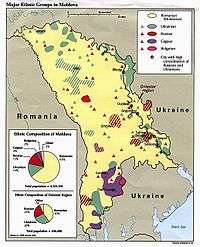
Moldova's territory is generally ethnically homogeneous. Moldovans form majorities in 33 of the 37 first-tier territorial units (including over 90% in 15 districts, between 80% and 90% in 9 districts, between 70% and 80% in 7 administrative units, and between 50% and 60% in two units), and a 33.5% plurality in Transnistria, where there are 32% Ukrainians and 27% Russians. Gagauzians represent an 82% majority in the autonomous territorial unit of Gagauzia, with only 5% Moldovans. Bulgarians represent a 66% majority in the Taraclia district, with 14% Moldovans. Finally, Russians represent a 43% plurality in the municipality of Bender, with 25% Moldovans. Ukrainians represent between 20% and 30% minorities in four units with Moldovan majority: Bălţi, Briceni, Ocniţa, and Rîşcani, and one with Moldovan plurality (Transnistria). Elsewhere, the ethnic populations are under 20% district-wise (generally much less). The Romanians are concentrated in the municipality of Chişinău, home to 44% of the Romanians in Moldova, although they represent only 4.5% of the population of the municipality.
Although before 1991 Moldova was the most densely populated of the former Soviet socialist republics (129 inhabitants per square kilometer in 1990, compared with 13 inhabitants per square kilometer for the Soviet Union as a whole), it had and has only few large cities.
The largest and most important of these is Chişinău, the country's capital and its most important industrial center, with a population of 712,218 in 2004. The city's population is 67.62% Moldovan, 13.92% Russian, 8.28% Ukrainian, 4.5% Romanians and 5.69% others (Bulganians, Gagauzians, Jews, Poles, Gypsies, etc.). The proportion of Russophones living in Moldova decreased in the years immediately after 1989 because of the emigration to Russia, after an immigration from Russia had taken place during the Soviet period.
The second largest city in the country, Tiraspol, had a population of 184,000 in 1990. Located in Transnistria, with a population of 158,069 in 2004, it is the capital of the breakaway republic. In contrast to Chişinǎu, Tiraspol has only some 15% Moldovans, with Russians comprising 41.7%, and Ukrainians 33%. Due to deportations by the breakaway authorities, and emigration during and after the 1992 War of Transnistria, it has been reported that the Moldovan and Romanian populations have gone down by up to 10,000 since 1990.
Other important cities include Bălţi, with a population of 162,000 in 1990, and 127,561 in 2004, and Bender, with a population of 132,000 in 1990 and 100,169 in 2004. Other major cities include Rîbniţa, population 53,648, Cahul, population 35,488, Ungheni, population 32,530, Soroca, population 28,362, and Orhei, population 25,641.
Traditionally a predominantly rural country, Moldova gradually began changing its character in the 20th century. As urban areas became the sites of new industrial and intellectual jobs and amenities such as hospitals, the population of cities and towns grew. The Soviets kept the population of Moldova under control with the famous Soviet policy of propiska, which forbade a person to live in another locality than the one written in his or her identity documents without approval of Soviet authorities. The new residents of Moldova's cities during the Soviet era were not only Moldovans, who had moved from the nearby rural areas, but also many Russians and Ukrainians who had been recruited to fill positions in industry and government, moving in from other parts of the Soviet Union.
Many people emigrated to Romania in 1940 (estimated at 200,000) and 1944 (estimated at more than 200,000), and others had lost their lives during the war (over 100,000 as Soviet soldiers in 1944–1945, and up to 50,000 as Romanian soldiers before 1944, including as Soviet POWs in 1944–1945), in Stalinist persecutions (over 8,000 executed, ca. 50,000 sent to Gulag, over 200,000 deported), and during the 1946–1947 famine (216,000 deceased). During the 1940s, thousands of young people were recruited to work in large-scale Soviet construction projects. Then, as a consequence of industrial growth after 1956, there was significant immigration to the Moldavian SSR by representatives of other ethnic groups, especially Russians and Ukrainians.
At the time of the 1989 census, Moldova's total population was 4,335,400. The largest ethnic group, Moldovans, numbered 2,795,000, accounting for 64.5% of the population. The other major ethnicities were Ukrainians, about 600,000 (14%); Russians, about 562,000 (13.0%); Gagauz, about 153,000 (4%); Bulgarians, about 88,000 (2%); and Jews, about 66,000 (2.0%). There were also smaller but appreciable numbers of Poles and Roma in the population. In Transnistria ethnic Moldovans accounted for 40% of the population in 1989, followed by Ukrainians (28%), and Russians (25%). In the early 1990s, there was significant emigration from the republic, primarily from urban areas and mainly by non-Moldovan minorities. Moldovans made up a sizable proportion of the urban population in 1989 (about half the population of Chişinǎu and other cities), as well as a large proportion of the rural population (over 85%), but only 23% of the ethnic Moldovans lived in the republic's ten largest cities, with the rest of the community being predominantly rural.
Unlike Moldovans, Russians tend to be urban dwellers in Moldova; more than 72% of them lived in the ten largest cities in 1989. Many of them came to the Moldova after it was occupied by the Soviet Union in 1940. Some of them came to alleviate the postwar shortage of qualified labor in the Moldavian SSR, which was created by the rapid industrialization, but also by the loss of human life during the war, deportations, and famine. Ethnic Russians settled mainly in Chişinǎu, Bălţi, Bender, and in the cities of the eastern bank of the Dniester, such as Tiraspol, Rîbniţa, and Dubăsari. Only about 25% of Moldova's Russians lived in Transnistria in 1990, as many as in Chişinǎu alone.
In 1990, Moldova's divorce rate of 3.0 divorces per 1,000 population had risen from the 1987 rate of 2.7 divorces per 1,000 population. The usual stresses of marriage were exacerbated by a society in which women were expected to perform most of the housework in addition to their work outside the home. Compounding this were crowded housing conditions (with their resulting lack of privacy) and the growing economic crisis.
See also
References
Inline:
- ↑ 2004 Moldovan census
- ↑ (English) The World Factbook, CIA (2008)
- ↑ (English) UN (2001/2002)
- ↑ (English) UN (2000)
- ↑ Statistical Yearbooks of the Russian Empire
- ↑ http://unstats.un.org/unsd/demographic/products/dyb/dyb2.htm#2001 United nations. Demographic Yearbooks
- ↑ Statistica Moldovei
- ↑
- ↑ http://www.dhsprogram.com/
- ↑ Webpage of Dubăsari District of Transnistria
General:
![]() This article incorporates public domain material from the CIA World Factbook website https://www.cia.gov/library/publications/the-world-factbook/index.html.
This article incorporates public domain material from the CIA World Factbook website https://www.cia.gov/library/publications/the-world-factbook/index.html.
External links
- Arianna Montanari, Rumanian national identity in the Republic of Moldova
- Disaster by Depopulation, a Red Cross report about impact of demographic changes on family structure and child care
Moldova articles | |||||||
|---|---|---|---|---|---|---|---|
| History |  | ||||||
| Geography |
| ||||||
| Politics | |||||||
| Economy | |||||||
| Society |
| ||||||
| |||||||