Demographics of Latvia

This article is about the demographic features of the population of the historical territory of Latvia, including population density, ethnic background, education level, health of the populace, economic status, religious affiliations and other aspects of the population.
Background
Latvia was settled by the Baltic tribes some three millennia ago. The territories along the eastern Baltic first came under foreign domination at the beginning of the 13th century, with the formal establishment of Riga in 1201 under the German Teutonic Knights.
Latvia, in whole or in parts, remained under foreign rule for the next eight centuries, finding itself at the cross-roads of all the regional superpowers of their day, including Denmark (the Danes held on lands around the Gulf of Riga), Sweden, and Russia, with southern (Courland) Latvia being at one time a vassal to Poland-Lithuania as well as Latgale falling directly under Poland-Lithuania rule. Through all this time, Latvia remained largely under Baltic German hegemony, with Baltic Germans comprising the largest land-owners, a situation which did not change until Latvia's independence.
Historically, Latvia has had significant German, Russian, Jewish and Polish minorities. The majority (roughly two thirds) of Latvians, under Swedish influences, adopted Lutheranism, while the minority (the remaining third) of Latvians under Poland-Lithuania, Latgale in particular, retained their Catholicism. Aglona, in Latgale, has been the site of annual Catholic pilgrimage for centuries, even through to today.
Recently introduced immigration law in Latvia provides framework for immigration through investment in various financial areas or real estate. In 2012, solely 2,435[1] applications for residence permit by investment in real estate were received by Office of Citizenship and Migration Affairs. Main immigrant countries are Russia, Belarus, Ukraine and Lithuania (Lithuania is in the European Union, thus no investment is needed). Moreover, Latvia receives residence permit applications from people of nationalities such as Afghans, Chinese, Libyans and people from various other distant countries.
Historical shifts
Latvia's indigenous population has been ravaged numerous times throughout history. The earliest such event occurred during the conquest of Latvia by Peter the Great in the Great Northern War with Sweden.
In 1897, the first official census in this area indicated that Latvians formed 68.3% of the total population of 1.93 million; Russians accounted for 12%, Jews for 7.4%, Germans for 6.2%, and Poles for 3.4%. The remainder were Lithuanians, Estonians, Gypsies, and various other nationalities.
The demographics shifted greatly in the 20th century due to the world wars, the repatriation of the Baltic Germans, the Holocaust, and occupation by the Soviet Union. Today, only the Russian minority, which has tripled in numbers since 1935, remains important. The share of ethnic Latvians grew from 77% (1,467,035) in 1935 to 80% (1,508,800), after human loss in World War II and human deportation and other repressive measures, fell strongly to 52% (1,387,757) in 1989.
In 2005, there were even fewer Latvians than in 1989, though their share of the population was larger - 1,357,099 (58.8% of the inhabitants). People who arrived in Latvia during the Soviet era, and their descendants born before 21 August 1991, have to pass a naturalisation process to receive Latvian citizenship. Their children born after the restoration of independence in 1991 are registered as citizens, if one of the parents requests it.
Ethnic Latvians have been one of the world's slowest-growing ethnic groups for a century. The number of Latvians today is actually less than it was in the 1920s.
Over 130,000 persons have been naturalized as Latvian citizens since 1995, but 290,660 persons, as of March 2011, live in Latvia with non-citizen's passports. Large numbers of Russians, as well as some Ukrainians and Belarusians remained in Latvia after the fall of the Soviet Union.
According to the provisional results of the Population and Housing Census 2011, the total population of Latvia on 1 March 2011 was 2,067,887. Since the previous census in 2000 the country's population decreased by 309 thousand or 13%. The proportion of ethnic Latvians increased to 62.1% of the population.[2] Livonians are the other indigenous ethnic group, with about 100 of them remaining. Latgalians are a distinctive subgroup of Latvians inhabiting or coming from Eastern Latvia.
According to rankings provided by the United States Census Bureau—International Data Base (IDB)—Country Rankings, Latvia is estimated to have a population of 1,249,812 in the year 2050.[3]
Immigration
Illegal immigration in Latvia has traditionally been from neighboring countries such as Russia but now migrants also come from other areas such as Latin America, Southeast Asia and Africa.[4] The Latvian government have sought to work with Russia to stem the problem.[5] The Latvian government has been criticized for its treatment of illegals[6][7]
For an immigrant not to become an illegal resident, a permit is required for a foreign national or a stateless person wishing to reside in the Republic of Latvia for more than 90 days within a 6-month period,[8] thus if the person does not acquire himself a residence permit, he will be considered an illegal immigrant.
Population
Age structure

| Census year | Children | Working age | Pensioners |
|---|---|---|---|
| 1897 | 41.0 | 52.8 | 6.2 |
| 1920 | 38.3 | 52.9 | 8.6 |
| 1935 | 30.4 | 60.3 | 9.2 |
| 1943 | 29.1 | 60.6 | 10.3 |
| 1959 | 30.0 | 63.2 | 6.8 |
| 1970 | 23.1 | 56.2 | 20.7 |
| 1979 | 21.8 | 58.3 | 19.9 |
| 1989 | 22.7 | 56.6 | 20.7 |
| 2000 | 18.0 | 58.9 | 23.1 |
| 2011 | 14.1 | 64.1 | 21.8 |
On 1 January 2011 the average age was 41.6 years—6 months more than the average age published earlier.
Vital statistics
- Source: Latvijas Statistika and UN Demographic Yearbooks
| Average population (× 1000) | Live births | Deaths | Natural change | Crude birth rate (per 1000) | Crude death rate (per 1000) | Natural change (per 1000) | Total fertility rate | Infant mortality rate (per 1000 births) | Life expectancy at birth (males) | Life expectancy at birth (females) | |
|---|---|---|---|---|---|---|---|---|---|---|---|
| 1920 | 1 727 | 29 434 | 33 891 | −4 457 | 17.0 | 19.6 | −2.6 | 128.4 | |||
| 1921 | 1 850 | 36 420 | 25 331 | 11 089 | 19.7 | 13.7 | 6.0 | 93.2 | |||
| 1922 | 1 883 | 41 146 | 27 553 | 13 593 | 21.9 | 14.6 | 7.2 | 90.8 | |||
| 1923 | 1 909 | 41 796 | 26 080 | 15 716 | 21.9 | 13.7 | 8.2 | 88.4 | |||
| 1924 | 1 845 | 41 172 | 28 399 | 12 773 | 22.3 | 15.4 | 6.9 | 100.8 | |||
| 1925 | 1 857 | 41 314 | 27 683 | 13 631 | 22.3 | 14.9 | 7.3 | 107.2 | |||
| 1926 | 1 871 | 41 073 | 27 557 | 13 516 | 22.0 | 14.7 | 7.2 | 87.9 | |||
| 1927 | 1 883 | 41 610 | 28 941 | 12 669 | 22.1 | 15.4 | 6.7 | 95.7 | |||
| 1928 | 1 895 | 39 126 | 27 299 | 11 827 | 20.7 | 14.4 | 6.2 | 96.3 | |||
| 1929 | 1 900 | 35 673 | 28 512 | 7 161 | 18.8 | 15.0 | 3.8 | 106.7 | |||
| 1930 | 1 910 | 37 835 | 27 110 | 10 725 | 19.8 | 14.2 | 5.6 | 90.0 | |||
| 1931 | 1 920 | 36 972 | 26 891 | 10 081 | 19.3 | 14.0 | 5.3 | 86.3 | |||
| 1932 | 1 931 | 37 366 | 26 342 | 11 024 | 19.4 | 13.6 | 5.7 | 89.3 | |||
| 1933 | 1 939 | 34 576 | 26 319 | 8 257 | 17.8 | 13.6 | 4.3 | 76.4 | |||
| 1934 | 1 947 | 33 383 | 27 065 | 6 318 | 17.2 | 13.9 | 3.2 | 95.1 | |||
| 1935 | 1 953 | 34 419 | 27 660 | 6 759 | 17.6 | 14.2 | 3.5 | 78.9 | |||
| 1936 | 1 961 | 35 468 | 27 646 | 7 822 | 18.1 | 14.1 | 4.0 | 80.1 | |||
| 1937 | 1 968 | 34 863 | 28 083 | 6 780 | 17.7 | 14.3 | 3.4 | 85.0 | |||
| 1938 | 1 978 | 36 386 | 26 703 | 9 683 | 18.4 | 13.5 | 4.9 | 68.1 | |||
| 1939 | 2 000 | 36 932 | 27 827 | 9 105 | 18.5 | 13.9 | 4.6 | 70.2 | |||
| 1940 | 1 940 | 37 493 | 30 355 | 7 138 | 19.3 | 15.7 | 3.6 | 73.2 | |||
| 1941 | 1 755 | 36 295 | 30 434 | 5 861 | 20.7 | 17.3 | 3.4 | 81.7 | |||
| 1942 | 36 370 | 29 940 | 6 430 | 81.1 | |||||||
| 1943 | 35 915 | 29 904 | 6 011 | 93.4 | |||||||
| 1944 | |||||||||||
| 1945 | 26 217 | 32 230 | −6 013 | 111.1 | |||||||
| 1946 | 1 636 | 30 544 | 32 266 | −1 722 | 18.7 | 19.7 | −1.1 | 93.9 | |||
| 1947 | 1 787 | 34 832 | 32 435 | 2 397 | 19.5 | 18.2 | 1.3 | 108.7 | |||
| 1948 | 1 872 | 35 402 | 26 500 | 8 902 | 18.9 | 14.2 | 4.8 | 79.3 | |||
| 1949 | 1 886 | 35 671 | 25 640 | 10 031 | 18.9 | 13.6 | 5.3 | 83.3 | |||
| 1950 | 1 887 | 33 137 | 24 250 | 8 887 | 17.6 | 12.9 | 4.7 | 70.0 | |||
| 1951 | 1 895 | 32 764 | 23 898 | 8 866 | 17.3 | 12.6 | 4.7 | 69.6 | |||
| 1952 | 1 906 | 32 278 | 22 680 | 9 598 | 16.9 | 11.9 | 5.0 | 52.9 | |||
| 1953 | 1 926 | 30 986 | 22 761 | 8 225 | 16.1 | 11.8 | 4.3 | 46.8 | |||
| 1954 | 1 953 | 33 202 | 22 500 | 10 702 | 17.0 | 11.5 | 5.5 | 45.9 | |||
| 1955 | 1 981 | 32 968 | 21 330 | 11 638 | 16.6 | 10.8 | 5.9 | 42.0 | |||
| 1956 | 2 018 | 32 590 | 20 339 | 12 251 | 16.1 | 10.1 | 6.1 | 33.9 | |||
| 1957 | 2 054 | 33 714 | 21 087 | 12 627 | 16.4 | 10.3 | 6.1 | 32.3 | |||
| 1958 | 2 073 | 35 068 | 20 910 | 14 158 | 16.9 | 10.1 | 6.8 | 29.5 | |||
| 1959 | 2 092 | 35 028 | 22 601 | 12 427 | 16.7 | 10.8 | 5.9 | 1.94 | 30.8 | ||
| 1960 | 2 121 | 35 468 | 21 314 | 14 154 | 16.7 | 10.0 | 6.7 | 1.99 | 27.0 | ||
| 1961 | 2 153 | 35 993 | 21 759 | 14 234 | 16.7 | 10.1 | 6.6 | 2.01 | 24.1 | ||
| 1962 | 2 182 | 35 061 | 23 592 | 11 469 | 16.1 | 10.8 | 5.3 | 1.91 | 24.2 | ||
| 1963 | 2 211 | 33 843 | 22 703 | 11 140 | 15.3 | 10.3 | 5.0 | 1.85 | 25.9 | ||
| 1964 | 2 241 | 33 053 | 21 165 | 11 888 | 14.7 | 9.4 | 5.3 | 1.79 | 22.0 | ||
| 1965 | 2 266 | 31 212 | 22 780 | 8 432 | 13.8 | 10.1 | 3.7 | 1.74 | 18.9 | ||
| 1966 | 2 283 | 31 974 | 23 350 | 8 624 | 14.0 | 10.2 | 3.8 | 1.76 | 17.0 | ||
| 1967 | 2 301 | 32 232 | 24 362 | 7 870 | 14.0 | 10.6 | 3.4 | 1.80 | 17.3 | ||
| 1968 | 2 324 | 32 693 | 25 104 | 7 589 | 14.1 | 10.8 | 3.3 | 1.83 | 18.9 | ||
| 1969 | 2 343 | 32 915 | 26 229 | 6 686 | 14.0 | 11.2 | 2.9 | 1.88 | 17.7 | ||
| 1970 | 2 359 | 34 333 | 26 546 | 7 787 | 14.6 | 11.3 | 3.3 | 2.01 | 17.7 | ||
| 1971 | 2 376 | 35 239 | 26 275 | 8 964 | 14.8 | 11.1 | 3.8 | 2.04 | 15.9 | ||
| 1972 | 2 396 | 35 007 | 27 296 | 7 711 | 14.6 | 11.4 | 3.2 | 2.03 | 16.0 | ||
| 1973 | 2 416 | 34 008 | 28 139 | 5 869 | 14.1 | 11.6 | 2.4 | 1.96 | 15.8 | ||
| 1974 | 2 437 | 34 920 | 28 143 | 6 777 | 14.3 | 11.5 | 2.8 | 2.00 | 18.4 | ||
| 1975 | 2 456 | 34 810 | 30 042 | 4 768 | 14.2 | 12.2 | 1.9 | 1.96 | 20.3 | ||
| 1976 | 2 470 | 34 644 | 30 373 | 4 271 | 14.0 | 12.3 | 1.7 | 1.93 | 20.1 | ||
| 1977 | 2 485 | 34 240 | 30 869 | 3 371 | 13.8 | 12.4 | 1.4 | 1.88 | 18.3 | ||
| 1978 | 2 498 | 34 258 | 31 261 | 2 997 | 13.7 | 12.5 | 1.2 | 1.85 | 18.1 | ||
| 1979 | 2 506 | 34 683 | 32 162 | 2 521 | 13.8 | 12.8 | 1.0 | 1.87 | 18.3 | ||
| 1980 | 2 512 | 35 534 | 32 100 | 3 434 | 14.1 | 12.8 | 1.4 | 1.90 | 15.3 | ||
| 1981 | 2 519 | 35 732 | 32 090 | 3 642 | 14.2 | 12.7 | 1.4 | 1.90 | 16.0 | ||
| 1982 | 2 531 | 37 477 | 31 234 | 6 243 | 14.8 | 12.3 | 2.5 | 1.98 | 13.9 | ||
| 1983 | 2 546 | 40 572 | 32 330 | 8 242 | 15.9 | 12.7 | 3.2 | 2.13 | 15.9 | ||
| 1984 | 2 562 | 40 847 | 33 406 | 7 441 | 15.9 | 13.0 | 2.9 | 2.15 | 12.9 | ||
| 1985 | 2 579 | 39 571 | 34 166 | 5 405 | 15.3 | 13.2 | 2.1 | 2.09 | 13.0 | ||
| 1986 | 2 600 | 41 960 | 31 328 | 10 632 | 16.1 | 12.0 | 4.1 | 2.22 | 12.8 | ||
| 1987 | 2 627 | 42 135 | 32 150 | 9 985 | 16.0 | 12.2 | 3.8 | 2.21 | 11.3 | ||
| 1988 | 2 653 | 41 275 | 32 421 | 8 854 | 15.6 | 12.2 | 3.3 | 2.16 | 11.0 | 66.3 | 75.0 |
| 1989 | 2 667 | 38 922 | 32 584 | 6 338 | 14.6 | 12.2 | 2.4 | 2.04 | 11.3 | 65.3 | 75.2 |
| 1990 | 2 663 | 37 918 | 34 812 | 3 106 | 14.2 | 13.1 | 1.2 | 2.00 | 13.7 | 64.2 | 74.6 |
| 1991 | 2 651 | 34 633 | 34 749 | −116 | 13.1 | 13.1 | −0.0 | 1.85 | 15.7 | 63.8 | 74.8 |
| 1992 | 2 614 | 31 569 | 35 420 | −3 851 | 12.1 | 13.6 | −1.5 | 1.74 | 17.6 | 63.3 | 74.8 |
| 1993 | 2 563 | 26 759 | 39 197 | −12 438 | 10.4 | 15.3 | −4.9 | 1.52 | 16.2 | 61.6 | 73.8 |
| 1994 | 2 521 | 24 256 | 41 757 | −17 501 | 9.6 | 16.6 | −6.9 | 1.41 | 15.7 | 60.7 | 72.9 |
| 1995 | 2 485 | 21 595 | 38 931 | −17 336 | 8.7 | 15.7 | −7.0 | 1.27 | 18.8 | 60.8 | 73.1 |
| 1996 | 2 457 | 19 782 | 34 320 | −14 538 | 8.1 | 14.0 | −5.9 | 1.18 | 15.9 | 63.9 | 75.6 |
| 1997 | 2 433 | 18 830 | 33 533 | −14 703 | 7.7 | 13.8 | −6.0 | 1.13 | 15.3 | 64.2 | 75.9 |
| 1998 | 2 410 | 18 410 | 34 200 | −15 790 | 7.6 | 14.2 | −6.6 | 1.11 | 15.0 | 64.1 | 75.5 |
| 1999 | 2 390 | 19 396 | 32 844 | −13 448 | 8.1 | 13.7 | −5.6 | 1.18 | 11.3 | 64.9 | 76.2 |
| 2000 | 2 373 | 20 248 | 32 205 | −11 957 | 8.5 | 13.6 | −5.0 | 1.24 | 10.3 | 64.8 | 76.0 |
| 2001 | 2 355 | 19 664 | 32 991 | −13 327 | 8.3 | 14.0 | −5.7 | 1.21 | 11.0 | 64.5 | 75.7 |
| 2002 | 2 320 | 20 044 | 32 498 | −12 454 | 8.7 | 14.1 | −5.3 | 1.25 | 9.8 | 64.7 | 76.1 |
| 2003 | 2 299 | 21 006 | 32 437 | −11 431 | 9.2 | 14.2 | −4.9 | 1.32 | 9.4 | 65.6 | 76.0 |
| 2004 | 2 277 | 20 334 | 32 024 | −11 690 | 9.1 | 14.2 | −5.1 | 1.29 | 9.3 | 65.9 | 76.3 |
| 2005 | 2 250 | 21 497 | 32 777 | −11 280 | 9.8 | 14.6 | −4.9 | 1.39 | 7.7 | 65.2 | 76.5 |
| 2006 | 2 228 | 22 264 | 33 098 | −10 834 | 10.3 | 14.9 | −4.7 | 1.46 | 7.4 | 65.2 | 76.3 |
| 2007 | 2 209 | 23 273 | 33 042 | −9 769 | 10.9 | 15.0 | −4.3 | 1.54 | 8.5 | 65.3 | 76.2 |
| 2008 | 2 192 | 23 948 | 31 006 | −7 058 | 11.2 | 14.2 | −3.1 | 1.59 | 6.6 | 66.7 | 77.7 |
| 2009 | 2 163 | 21 677 | 29 897 | −8 220 | 10.3 | 14.0 | −3.6 | 1.47 | 7.6 | 67.7 | 77.8 |
| 2010 | 2 121 | 19 219 | 30 040 | −10 821 | 9.4 | 14.3 | −4.8 | 1.36 | 5.6 | 68.1 | 78.1 |
| 2011 | 2 075 | 18 825 | 28 540 | −9 715 | 9.1 | 13.9 | −4.8 | 1.34 | 6.6 | 68.7 | 78.7 |
| 2012 | 2 041 | 19 897 | 29 025 | −9 128 | 9.8 | 14.2 | −4.4 | 1.44 | 6.3 | 69.1 | 78.9 |
| 2013 | 2 005 | 20 596 | 28 691 | −8 095 | 10.2 | 14.3 | −4.0 | 1.52 | 4.4 | 69.5 | 79.0 |
| 2014 | 1 995 | 21 746 | 28 466 | −6 720 | 10.8 | 14.3 | −3.5 | 1.65 | 3.8 | 69.1 | 79.3 |
| 2015 | 1 986 | 21 979 | 28 319 | −6 330 | 11.0 | 14.3 | -3.3 | 1.70 | 4.1 | 69.7 | 79.3 |
Current natural decrease[11]
- Number of births from January–October 2015 =
 18,516
 - Number of births from January–October 2016 =
 18,427
- Number of deaths from January–October 2015 =
 23,740
 - Number of deaths from January–October 2016 = 23,594
- Natural growth from January–October 2015 = -5,224
- Natural growth from January–October 2016 = -5,167
Ethnic groups
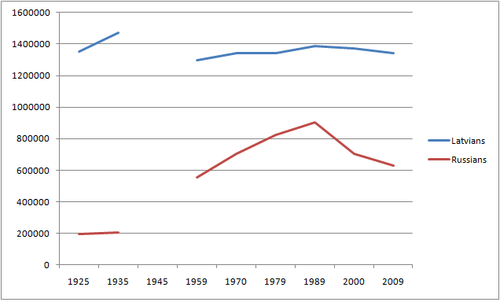
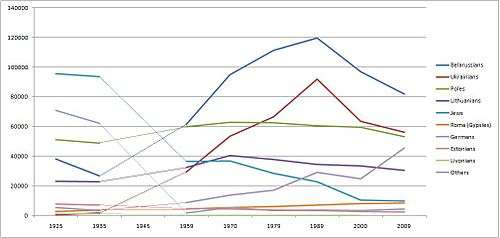
Latvians have always been the largest ethnic group in Latvia during the past century, but minority peoples have always been numerous. Before WW II the proportion of non-Latvians was approximately 25%, the Russians being the largest minority (app. 10%), followed by Jews (approx. 5%), Germans and Poles (2–3%). After World War 2 only small numbers of Jews and Germans remained and following a massive immigration of Russians, Ukrainians and Belarusians, Latvians almost became a minority. In 1989, the proportion of Latvians had decreased to only 52% (from 75.5% in 1935). Despite the decreasing number of Latvians due to low fertility rates, the proportion of Latvians has considerably increased during the past two decades and reached 62.1% in 2011 (slightly higher than the 62.0% in 1959). This is due to large scale emigration of Russians, Ukrainians and Belarusians. The number of these peoples almost halved between 1989 and 2011.
| Ethnic group |
census 1925 [12] | census 1935 [12] | census 1959 [13] | census 1970 [14] | census 1979 [15] | census 1989 [16] | census 2000 [17] | census 2011[2] | statistics 2014[18] | |||||||||
|---|---|---|---|---|---|---|---|---|---|---|---|---|---|---|---|---|---|---|
| Number | % | Number | % | Number | % | Number | % | Number | % | Number | % | Number | % | Number | % | Number | % | |
| Latvians | 1,354,126 | 73.4 | 1,472,612 | 75.5 | 1,297,881 | 62.0 | 1,341,805 | 56.8 | 1,344,105 | 53.7 | 1,387,757 | 52.0 | 1,370,703 | 57.7 | 1,285,136 | 62.1 | 1,229,067 | 61,6 |
| Russians | 193,648 | 10.5 | 206,499 | 10.6 | 556,448 | 26.6 | 704,599 | 29.8 | 821,464 | 32.8 | 905,515 | 34.0 | 703,243 | 29.6 | 557,119 | 26.9 | 520,136 | 25,8 |
| Belarusians | 38,010 | 2.1 | 26,867 | 1.4 | 61,587 | 2.9 | 94,898 | 4.0 | 111,505 | 4.5 | 119,702 | 4.5 | 97,150 | 4.1 | 68,202 | 3.3 | 68,695 | 3,4 |
| Ukrainians | 512 | 0.0 | 1,844 | 0.1 | 29,440 | 1.4 | 53,461 | 2.3 | 66,703 | 2.7 | 92,101 | 3.5 | 63,644 | 2.7 | 45,798 | 2.2 | 45,282 | 2,3 |
| Poles | 51,143 | 2.8 | 48,949 | 2.5 | 59,774 | 2.9 | 63,045 | 2.7 | 62,690 | 2.5 | 60,416 | 2.3 | 59,505 | 2.5 | 44,772 | 2.2 | 43,365 | 2,1 |
| Lithuanians | 23,192 | 1.3 | 22,913 | 1.2 | 32,383 | 1.6 | 40,589 | 1.7 | 37,818 | 1.5 | 34,630 | 1.3 | 33,430 | 1.4 | 24,479 | 1.2 | 25,025 | 1,3 |
| Jews | 95,675 | 5.2 | 93,479 | 4.8 | 36,592 | 1.8 | 36,680 | 1.6 | 28,331 | 1.1 | 22,897 | 0.9 | 10,385 | 0.4 | 6,437 | 0.3 | 5,402 | 0,3 |
| Roma | 2,870 | 0.2 | 3,839 | 0.2 | 4,301 | 0.2 | 5,427 | 0.2 | 6,134 | 0.3 | 7,044 | 0.3 | 8,205 | 0.3 | 6,489 | 0.3 | 5,594 | 0,3 |
| Germans | 70,964 | 3.8 | 62,144 | 3.2 | 1,609 | 0.1 | 5,413 | 0.2 | 3,299 | 0.1 | 3,783 | 0.1 | 3,465 | 0.1 | 3,042 | 0.1 | 2,886 | 0,1 |
| Estonians | 7,893 | 0.4 | 7,014 | 0.4 | 4,610 | 0.2 | 4,334 | 0.2 | 3,681 | 0.2 | 3,312 | 0.1 | 2,652 | 0.1 | 2,007 | 0.1 | 1,882 | 0,1 |
| Livonians | 1,268 | 0.1 | 944 | 0.0 | 185 | 0.0 | 48 | 0.0 | 107 | 0.0 | 135 | 0.0 | 180 | 0.0 | 250 | 0.1 | 171 | 0,0 |
| Others | 5,504 | 0.3 | 3,398 | 0.2 | 8,648 | 0.4 | 13,828 | 0.6 | 16,979 | 0.7 | 29,275 | 1.1 | 24,824 | 1.1 | 26,640 | 1.3 | 54,134 | 2.7% |
| Total | 1,844,805 | 1,950,502 | 2,093,458 | 2,364,127 | 2,502,816 | 2,666,567 | 2,377,383 | 2,070,371 | 2,001,468 | |||||||||
Languages
- official: Latvian
- considered indigenous in some legislation: Livonian, Latgalian
- other languages registered as main language spoken at home by at least 500 speakers in 2011 census[19] (in declining order): Russian, Belarusian, Ukrainian, Lithuanian, Polish, Romani, Tatar, Yiddish and Hebrew, Estonian, German
- other languages widely spoken: English
- Latvian Sign Language and Russian Sign Language
In the 2011 census, 1,164,894 persons in Latvia reported Latvian as their main language spoken at home; 698,757 respondents listed Russian as their main language spoken at home,[19] representing 37.2% of the total population, whereas Latvian was recorded as the main language spoken at home for 62.1%.[20] Latvian was spoken as a second language by 20.8% of the population, and 43.7% spoke Russian as a second language.[21] In total, 71% of ethnic Latvians said they could speak Russian, and 52% of Russians could speak Latvian in census 2000.[22]
Religion
In a 2005 survey, 24.1% described themselves as Russian Orthodox, 20.7% Catholics, 20.0% Lutherans, 4.4% Old Believers, 10.6% non-denominational believers and 15.8% non-believers.[23] Lutheranism was the majority religion before World War II, but has now fallen to third place behind Russian Orthodoxy and Catholicism.
See also
| Wikimedia Commons has media related to Demographics of Latvia. |
References
- ↑ "Statistics - residence permit requests". 2013. Retrieved 22 June 2015.
- 1 2 Population Census 2011—Key Indicators
- ↑ "International Data Base Country Rankings". census.gov/. Retrieved September 25, 2016.
- ↑ "Illegal immigrants from Africa and Latin America increase in Latvia". The Baltic Times. Retrieved 2012-04-15.
- ↑ "Estonia urges cooperation with Russia in fighting illegal immigration". Baltic Review. Retrieved 2012-04-15.
- ↑ "2009 Human Rights Report: Latvia". US State Department. Retrieved 2012-04-15.
- ↑ "New measures for restricting employment of illegal immigrants". Saeima Press Service. Retrieved 2012-04-15.
- ↑ "Statistics show immigration in Latvia is growing". Baltic Legal. Retrieved 2012-08-18.
- ↑ 1897-1959. uzrādītas vecuma grupas līdz 20 gadiem, 20-65 g. un virs 65 g. (1959. - virs 70 g.), skat.: Jānis Rutkis. Latvijas ģeogrāfija. Apgāds Zemgale. Stokholma. 1960. 421. lpp.
- ↑ 1970-2006. uzrādītas vecuma grupas atbilstoši attiecīgo gadu likumdošanā noteiktajam darbspējas un pensijas vecumam, skat.: Demogrāfija 2006. LR CSP. Rīga. 2006. ISBN 9984-06-287-2. 21–22 lpp.
- ↑ "Statistics Database". Centrala Statistikas Parvalde. Statistics Of Latvia. Retrieved 21 November 2016.
- 1 2 "Ethnicities in region of Latvia. Statistics". roots-saknes.lv. Retrieved 2010-01-02.
- ↑ Всесоюзная перепись населения 1959 года. Национальный состав населения по республикам СССР (in Russian). demoscope.ru. Retrieved 2010-01-02.
- ↑ Всесоюзная перепись населения 1970 года. Национальный состав населения по республикам СССР (in Russian). demoscope.ru. Retrieved 2010-01-02.
- ↑ Всесоюзная перепись населения 1979 года. Национальный состав населения по республикам СССР (in Russian). demoscope.ru. Retrieved 2010-01-02.
- ↑ Всесоюзная перепись населения 1989 года. Национальный состав населения по республикам СССР (in Russian). demoscope.ru. Retrieved 2010-01-02.
- ↑ "Integrācijas politika Latvijā: daudzpusīga pieeja" (in Latvian). 2010-04-10. Archived from the original on May 10, 2011. Retrieved 2015-12-26.
- ↑ http://data.csb.gov.lv/Selection.aspx?px_path=Sociala__Ikgad%C4%93jie%20statistikas%20dati__Iedz%C4%ABvot%C4%81ji__Iedz%C4%ABvot%C4%81ji%20skaits%20un%20t%C4%81%20izmai%C5%86as&px_tableid=IS0191.px&px_language=lv&px_db=Sociala&rxid=992a0682-2c7d-4148-b242-7b48ff9fe0c2
- 1 2 3 (Latvian)
- ↑ — choose "Results of Population Census Year 2011, in short" and "Iedzīvotāju dzimtā valoda un citu valodu prasme"(Latvian)
- ↑ LR CSP preses izlaidums: 2000. Gada Tautas Skaitīšana Latvijā; 07.11.2000.(Latvian)
- ↑ Dažādu tautu valodu prasme(Latvian)
- ↑ Samazinās to Latvijas iedzīvotāju īpatsvars, kuri sevi uzskata par luterāņiem(Latvian)
External links
- Naturalization Board of the Republic of Latvia: Figures and facts
- Office of Citizenship and Migration Affairs: Statistics
Latvia articles | |||||||
|---|---|---|---|---|---|---|---|
| History |
|  | |||||
| Geography |
| ||||||
| Politics | |||||||
| Economy | |||||||
| Society |
| ||||||
| |||||||