Demographics of Bulgaria
| Demographics of Bulgaria | |
|---|---|
|
Bulgarian demographic scale | |
| Population |
|
| Growth rate |
|
| Birth rate |
|
| Death rate |
|
| Life expectancy |
|
| • male |
|
| • female |
|
| Fertility rate |
|
| Infant mortality rate |
|
| Net migration rate | -0.7 migrant(s)/1,000 population (2012) |
| Age structure | |
| 0–14 years | 13.2% |
| 15–64 years | 68.3% |
| 65 and over | 18.5% (2011) [2] |
| Sex ratio | |
| At birth | 1.06 male(s)/female |
| Under 15 | 1.05 male(s)/female |
| 15–64 years | 0.97 male(s)/female |
| 65 and over | 0.68 male(s)/female |
| Nationality | |
| Nationality | noun: Bulgarian(s) adjective: Bulgarian |
| Major ethnic | Bulgarian (84.8%) |
| Minor ethnic |
Turkish (8.8%) Roma (4.9%) Other and unknown (1.5%) |
| Language | |
| Official | Bulgarian (85.2%) |
The demography of the Republic of Bulgaria is monitored by the "Natsionalen Statisticheski Institut" (National Statistical Institute of Bulgaria).
This article is about the demographic features of the population of Bulgaria, including population density, ethnicity, education level, health of the populace, economic status, religious affiliations and other aspects of the population.
Bulgaria has a high Human Development Index of 0.782, ranking 57th in the world in 2012[3] and holds the 38th position in Newsweek's rankings of the world's best countries to live in, measuring health, education, political environment and economic dynamism.[4]
Demographic history
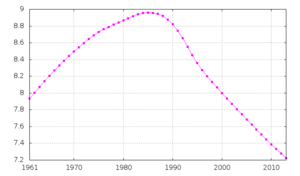
Various estimates have put Bulgaria's medieval population at 1.1 million in 700 AD and 2.6 million in 1365.[5] The latest 2011 census, the population inhabiting Bulgaria is 7,364,570 in total.[2] The peak was in 1989, the year when the borders opened after a half of a century of totalitarian regime, when the population numbered 9,009,018.
| Census population and average annual growth rate | ||
|---|---|---|
| Year | Pop. | ±% p.a. |
| 1887 | 3,154,375 | — |
| 1892 | 3,310,713 | +0.97% |
| 1900 | 3,744,283 | +1.55% |
| 1905 | 4,035,575 | +1.51% |
| 1910 | 4,337,513 | +1.45% |
| 1920 | 4,846,971 | +1.12% |
| 1926 | 5,528,741 | +2.22% |
| 1934 | 6,077,939 | +1.19% |
| 1946 | 7,029,349 | +1.22% |
| 1956 | 7,613,709 | +0.80% |
| 1965 | 8,227,966 | +0.87% |
| 1975 | 8,727,771 | +0.59% |
| 1985 | 8,948,649 | +0.25% |
| 1992 | 8,487,317 | −0.75% |
| 2001 | 7,932,984 | −0.75% |
| 2011 | 7,364,570 | −0.74% |
| 2015 | 7,168,009[6] | −0.67% |
| Source: Censuses in Bulgaria | ||

Vital statistics

Vital statistics 1900–1915
| Average population (x 1000) | Live births | Deaths | Natural change | Crude birth rate (per 1000) | Crude death rate (per 1000) | Natural change (per 1000) | |
|---|---|---|---|---|---|---|---|
| 1900 | 3 710 | 157 000 | 84 000 | 73 000 | 42.3 | 22.6 | 19.7 |
| 1901 | 3 740 | 141 000 | 87 000 | 54 000 | 37.7 | 23.3 | 14.4 |
| 1902 | 3 800 | 149 000 | 91 000 | 58 000 | 39.2 | 23.9 | 15.3 |
| 1903 | 3 850 | 159 000 | 88 000 | 71 000 | 41.3 | 22.9 | 18.4 |
| 1904 | 3 910 | 167 000 | 84 000 | 83 000 | 42.7 | 21.5 | 21.2 |
| 1905 | 4 000 | 174 000 | 87 000 | 87 000 | 43.5 | 21.8 | 21.8 |
| 1906 | 4 100 | 179 000 | 91 000 | 88 000 | 43.7 | 22.2 | 21.5 |
| 1907 | 4 150 | 180 000 | 92 000 | 88 000 | 43.4 | 22.2 | 21.2 |
| 1908 | 4 200 | 169 000 | 102 000 | 67 000 | 40.2 | 24.3 | 16.0 |
| 1909 | 4 280 | 173 000 | 113 000 | 60 000 | 40.4 | 26.4 | 14.0 |
| 1910 | 4 350 | 180 000 | 100 000 | 80 000 | 41.4 | 23.0 | 18.4 |
| 1911 | 4 400 | 176 000 | 94 000 | 82 000 | 40.0 | 21.4 | 18.6 |
| 1912 | 4 430 | 185 000 | 91 000 | 94 000 | 41.8 | 20.5 | 21.2 |
| 1913 | 4 200 | 108 000 | 122 000 | -14 000 | 25.7 | 29.0 | -3.3 |
| 1914 | 4 240 | 191 000 | 88 000 | 103 000 | 45.0 | 20.8 | 24.3 |
| 1915 | 4 280 | 172 000 | 85 000 | 87 000 | 40.2 | 19.9 | 20.3 |
Vital statistics 1916–1940
| Average population (x 1000) | Live births | Deaths | Natural change | Crude birth rate (per 1000) | Crude death rate (per 1000) | Natural change (per 1000) | Fertility rates | |
|---|---|---|---|---|---|---|---|---|
| 1916 | 4 660 | 99 000 | 97 000 | 2 000 | 21.2 | 20.8 | 0.4 | |
| 1917 | 4 690 | 81 000 | 99 000 | -18 000 | 17.3 | 21.1 | -3.8 | |
| 1918 | 4 740 | 100 000 | 152 000 | -52 000 | 21.1 | 32.1 | -11.0 | |
| 1919 | 4 790 | 157 000 | 97 000 | 60 000 | 32.8 | 20.3 | 12.5 | |
| 1920 | 4 850 | 193 000 | 104 000 | 89 000 | 39.8 | 21.4 | 18.4 | |
| 1921 | 4 890 | 197 000 | 106 000 | 91 000 | 40.3 | 21.7 | 18.6 | |
| 1922 | 5 010 | 203 000 | 106 000 | 97 000 | 40.5 | 21.2 | 19.4 | |
| 1923 | 5 090 | 192 000 | 108 000 | 84 000 | 37.7 | 21.2 | 16.5 | |
| 1924 | 5 210 | 207 000 | 108 000 | 99 000 | 39.7 | 20.7 | 19.0 | |
| 1925 | 5 310 | 196 000 | 102 000 | 94 000 | 36.9 | 19.2 | 17.7 | |
| 1926 | 5 420 | 203 000 | 93 000 | 110 000 | 37.5 | 17.2 | 20.3 | |
| 1927 | 5 510 | 183 000 | 112 000 | 71 000 | 33.2 | 20.3 | 12.9 | |
| 1928 | 5 590 | 185 000 | 99 000 | 86 000 | 33.1 | 17.7 | 15.4 | |
| 1929 | 5 670 | 173 000 | 103 000 | 70 000 | 30.5 | 18.2 | 12.3 | |
| 1930 | 5 740 | 180 000 | 93 000 | 87 000 | 31.4 | 16.2 | 15.2 | 4,05 |
| 1931 | 5 800 | 171 000 | 98 000 | 73 000 | 29.5 | 16.9 | 12.6 | 3,80 |
| 1932 | 5 884 | 186 000 | 96 000 | 90 000 | 31.6 | 16.3 | 15.3 | 4,07 |
| 1933 | 5 961 | 174 000 | 93 000 | 81 000 | 29.2 | 15.6 | 13.6 | 3,76 |
| 1934 | 6 039 | 181 795 | 85 046 | 96 749 | 30.1 | 14.1 | 16.0 | 3,88 |
| 1935 | 6 102 | 160 951 | 89 086 | 71 865 | 26.4 | 14.6 | 11.8 | 3,39 |
| 1936 | 6 154 | 159 146 | 87 723 | 71 423 | 25.9 | 14.3 | 11.6 | 3,33 |
| 1937 | 6 196 | 150 771 | 84 674 | 66 097 | 24.3 | 13.7 | 10.7 | 3,12 |
| 1938 | 6 244 | 142 415 | 85 373 | 57 042 | 22.8 | 13.7 | 9.1 | 2,92 |
| 1939 | 6 292 | 138 883 | 84 150 | 54 733 | 22.1 | 13.4 | 8.7 | 2,81 |
| 1940 | 6 341 | 140 564 | 85 046 | 55 518 | 22.2 | 13.4 | 8.8 | 2,84 |
Vital statistics 1941 to present
Projections
The following forecast for the future population is an official estimate of the National Statistical Institute of Bulgaria.[10]
| Year | Population |
| 2015 | 7,159,819 |
| 2020 | 6,950,436 |
| 2025 | 6,734,989 |
| 2030 | 6,519,217 |
| 2035 | 6,311,454 |
| 2040 | 6,115,526 |
| 2045 | 5,929,267 |
| 2050 | 5,748,061 |
| 2055 | 5,567,060 |
| 2060 | 5,384,040 |
Ethnic groups
| Ethnic group |
census 1900 | census 1905 | census 1910 | census 1920 | census 1926 | census 1934 | census 1946 | census 1956 | ||||||||||||||||||
|---|---|---|---|---|---|---|---|---|---|---|---|---|---|---|---|---|---|---|---|---|---|---|---|---|---|---|
| Number | % | Number | % | Number | % | Number | % | Number | % | Number | % | Number | % | Number | % | |||||||||||
| Bulgarian[11] | 2,888,219 | 77.1 | 3,203,810 | 79.4 | 3,518,756 | 81.1 | 4,036,056 | 83.3 | 4,557,706 | 83.2 | 5,204,217 | 85.6 | 5,903,580 | 84.0 | 6,506,541 | 85.5 | ||||||||||
| Turkish[11] | 531,240 | 14.2 | 488,010 | 12.1 | 465,641 | 10.7 | 520,339 | 10.7 | 577,552 | 10.5 | 591,193 | 9.7 | 675,500 | 9.6 | 656,025 | 8.6 | ||||||||||
| Roma[11] | 89,549 | 2.4 | 99,004 | 2.5 | 122,296 | 2.8 | 98,451 | 2.0 | 134,844 | 2.5 | 149,385 | 2.5 | 170,011 | 2.4 | 197,865 | 2.6 | ||||||||||
| Russian | 1,685 | 0.0 | 3,275 | 0.2 | 2,505 | 0.2 | 9,080 | 0.2 | 19,706 | 0.4 | 11,928 | 0.2 | 13,200 | 0.2 | 10,551 | 0.1 | ||||||||||
| Armenian | 14,581 | 0.4 | 12,932 | 0.3 | 11,509 | 0.2 | 27,332 | 0.5 | 25,963 | 0.4 | 21,637 | 0.3 | 21,954 | 0.3 | ||||||||||||
| Sarakatsani | 6,128 | 0.2 | 7,251 | 0.2 | 2,085 | 0.0 | ||||||||||||||||||||
| Macedonian | 0 | - | 0 | - | 0 | - | 0 | - | 0 | - | 0 | - | [12] 169,5442 | 2.4 | 187,7892 | 2.5 | ||||||||||
| Greek | 66,635 | 1.8 | 63,487 | 1.6 | 43,275 | 1.0 | 42,074 | 0.9 | 10,564 | 0.2 | 9,601 | 0.2 | 7,437 | 0.1 | ||||||||||||
| Jewish | 33,661 | 0.9 | 37,663 | 0.9 | 40,133 | 0.9 | 43,209 | 0.9 | 46,558 | 0.8 | 48,565 | 0.8 | 44,209 | 0.6 | 6,027 | 0.1 | ||||||||||
| Romanian | 71,063 | 1.9 | 75,773 | 1.9 | 79,429 | 1.8 | 57,312 | 1.2 | 69,080 | 1.2 | 16,504 | 0.3 | 3,749 | 0.0 | ||||||||||||
| Tatar | 18,884 | 0.5 | 17,942 | 0.4 | 18,228 | 0.4 | 6,191 | 0.1 | 5,993 | 0.1 | ||||||||||||||||
| Gagauz | 10,175 | 0.3 | 4,362 | 0.1 | ||||||||||||||||||||||
| Others | 13,199 | 0.2 | ||||||||||||||||||||||||
| Undeclared | 0 | - | 0 | - | 0 | - | 0 | - | 0 | - | 0 | - | 0 | - | 0 | - | ||||||||||
| Total | 3,744,283 | 4,035,575 | 4,337,513 | 4,846,971 | 5,528,741 | 6,077,939 | 7,029,349 | 7,613,709 | ||||||||||||||||||
| 2There are strong indications that in the 1946 and the 1956 census the population was forced to list as ethnic Macedonians against their will by the communist government in accordance with an agreement with Yugoslavia.[13][14] | ||||||||||||||||||||||||||
| Ethnic group |
census 1965 | census 1975 | [15] census 1992 | [16] census 2001 | [17] census 20111 | |||||||||||||||||||||
|---|---|---|---|---|---|---|---|---|---|---|---|---|---|---|---|---|---|---|---|---|---|---|---|---|---|---|
| Number | % | Number | % | Number | % | Number | % | Number | % / % of Total | |||||||||||||||||
| Bulgarian[11] | 7,231,243 | 87.9 | 7,930,024 | 90.9 | 7,271,185 | 85.7 | 6,655,210 | 83.9 | 5,664,624 | 84.8 / 76.9 | ||||||||||||||||
| Turkish[11] | 780,928 | 9.5 | 730,728 | 8.4 | 800,052 | 9.4 | 746,664 | 9.4 | 588,318 | 8.8 / 8.0 | ||||||||||||||||
| Roma[11] | 148,874 | 1.8 | 313,396 | 3.7 | 370,908 | 4.7 | 325,343 | 4.9 / 4.4 | ||||||||||||||||||
| Russian | 10,815 | 0.1 | 17,139 | 0.2 | 15,595 | 0.2 | 9,978 | 0.1 | ||||||||||||||||||
| Armenian | 20,282 | 0.2 | 14,526 | 0.2 | 13,677 | 0.2 | 10,832 | 0.1 | 6,552 | 0.1 | ||||||||||||||||
| Vlach | 5,159 | 0.1 | 10,566 | 0.1 | 3,684 | 0.1 | ||||||||||||||||||||
| Sarakatsani | 5,144 | 0.1 | 4,107 | 0.1 | 2,556 | 0.0 | ||||||||||||||||||||
| Ukrainian | 1,864 | 0.0 | 2,489 | 0.0 | 1,789 | 0.0 | ||||||||||||||||||||
| Macedonian | 9,632 | 0.1 | 10,803 | 0.1 | 5,071 | 0.1 | 1,654 | 0.0 | ||||||||||||||||||
| Greek | 8,241 | 0.1 | 4,930 | 0.1 | 3,408 | 0.0 | 1,379 | 0.0 | ||||||||||||||||||
| Jewish | 5,108 | 0.1 | 3,076 | 0.0 | 3,461 | 0.0 | 1,363 | 0.0 | 1,162 | 0.0 | ||||||||||||||||
| Romanian | 2,491 | 0.0 | 1,088 | 0.0 | 891 | 0.0 | ||||||||||||||||||||
| Tatar | 6,430 | 0.1 | 5,963 | 0.1 | 4,515 | 0.1 | 1,803 | 0.0 | ||||||||||||||||||
| Gagauz | 1,478 | 0.0 | 540 | 0.0 | ||||||||||||||||||||||
| Other | 23,542 | 0.3 | 12,342 | 0.2 | 19,659 | 0.3 | ||||||||||||||||||||
| Undeclared | 0 | - | 0 | - | 8,481 | 0.1 | 86,915 | 1.1 | 736,981 | 10.01 | ||||||||||||||||
| Total | 8,227,966 | 8,727,771 | 8,487,317 | 7,932,984 | 7,364,570 | |||||||||||||||||||||
| 1 The 2011 percentage of the ethnic groups is calculated only from those who answered the optional question on ethnicity (6,680,980 in total) and does not include around 700,000 people who did not answer the question or 10% from the population, | ||||||||||||||||||||||||||
The censuses in 1880, 1887 and 1892 did not have a question on ethnic affiliation.
The following table shows the ethnic composition of all Provinces of Bulgaria according to the 2011 census:
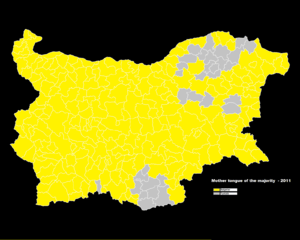
Yellow: Bulgarian ethnic group
White: Turkish ethnic group
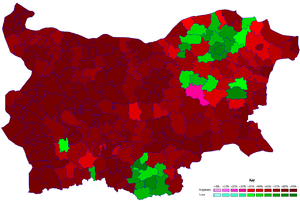
Red: Bulgarian ethnic group
Green: Turkish ethnic group
| Province | Ethnicity | Ethnicity | Ethnicity |
|---|---|---|---|
| Bulgarian | Turkish | Roma | |
| Blagoevgrad Province | 89% | 6% | 3% |
| Burgas Province | 80% | 13% | 5% |
| Dobrich Province | 75% | 13% | 9% |
| Gabrovo Province | 92% | 6% | 1% |
| Haskovo Province | 79% | 13% | 7% |
| Kardzhali Province | 30% | 66% | |
| Kyustendil Province | 93% | 0% | 6% |
| Lovech Province | 91% | 3% | 4% |
| Montana Province | 86% | 0% | 13% |
| Pazardzhik Province | 84% | 6% | 8% |
| Pernik Province | 96% | 0% | 3% |
| Pleven Province | 91% | 4% | 4% |
| Plovdiv Province | 87% | 6% | 5% |
| Razgrad Province | 43% | 50% | 5% |
| Ruse Province | 81% | 13% | 4% |
| Shumen Province | 59% | 30% | 8% |
| Silistra Province | 57% | 36% | 5% |
| Sliven Province | 77% | 10% | 12% |
| Smolyan Province | 91% | 5% | 0% |
| Sofia City | 96% | 1% | 2% |
| Sofia Province | 91% | 0% | 7% |
| Stara Zagora Province | 86% | 5% | 8% |
| Targovishte Province | 55% | 36% | 7% |
| Varna Province | 87% | 7% | 3% |
| Veliko Tarnovo Province | 90% | 7% | 2% |
| Vidin Province | 91% | 0% | 8% |
| Vratsa Province | 93% | 0% | 6% |
| Yambol Province | 87% | 3% | 8% |
| Source (2011 census):[18] | |||
Languages
The 2001 census defines an ethnic group as a "community of people, related to each other by origin and language, and close to each other by mode of life and culture"; and one's mother tongue as "the language a person speaks best and usually uses for communication in the family (household)".[20]
Religion
Bulgaria's traditional religion according to the constitution is the Orthodox Christianity, while Bulgaria is a secular state too. Since the last two censuses (2001 and 2011) provide widely divergent results, they are both shown in the table below. It is noteworthy that over a fifth of the population chose not to respond to this question in the 2011 census.

2001 [21] 2011 [2][22] Orthodox Christian 82.6% 59.4% Muslim 12.2% 7.8% (7.4 % Sunni; 0.4 % Shia) Catholic 0.6% 0.7% Protestant 0.5% 0.9% Other 0.2% 0.15% None 3.9% 9.3% No response - 21.8 %
The results of the Bulgarian 2011 Census, in which the indication of answer regarding the question for confession was optional, are as follows:[23]
| Group | Population | % of declared | % of total |
|---|---|---|---|
| Orthodoxy | 4,374,135 | 76.0% | 59.4% |
| Undeclared | 1,606,269 | - | 21.8% |
| Irreligion | 682,162 | 11.8% | 9.3% |
| Islam | 577,139 | 10.0% | 7.8% |
| Protestantism | 64,476 | 1.1% | 0.9% |
| Roman Catholicism | 48,945 | 0.8% | 0.7% |
| Oriental Orthodoxy | 1,715 | 0.0% | 0.0% |
| Jews | 706 | 0.0% | 0.0% |
| Others | 9,023 | 0.2% | 0.1% |
| Figure of percentage | - | 5,758,301 | 7,364,570 |
The results of the Bulgarian 2001 Census by ethnic groups, the latest census in which the indication of identification(whether by confession or as irreligious) in the question for confession was obligatory, are as follows:[24][25]
| Ethnic groups by confession |
Total | Bulgarians | Turks | Roma | Others | |||||
|---|---|---|---|---|---|---|---|---|---|---|
| Number | % | Number | % | Number | % | Number | % | Number | % | |
| Orthodoxy | 6,552,751 | 82.6 | 6,315,938 | 94.9 | 5,425 | 0.7 | 180,326 | 48.6 | 51,062 | |
| Islam | 966,978 | 12.2 | 131,531 | 2.0 | 713,024 | 95.5 | 103,436 | 27.9 | 18,987 | |
| Irreligion | 308,116 | 3.9 | 151,008 | 2.3 | 23,146 | 3.1 | 59,669 | 16.1 | ||
| Roman Catholicism | 43,811 | 0.6 | 37,811 | 0.6 | 2,561 | 0.3 | ||||
| Protestantism | 42,308 | 0.5 | 14,591 | 0.2 | 2,066 | 0.3 | 24,651 | 6.6 | 1,000 | |
| Others | 14,937 | 0.2 | 4,331 | 0.1 | 442 | 0.1 | ||||
| Total population | 7,928,901 | 100.0 | 6,655,210 | 100.0 | 746,664 | 100.0 | 370,908 | 100.0 | 100.0 | |
Life expectancy at birth


- Total population:
 74.02 years
 - Male: 70.62 years
- Female: 77.55 years (2012 est.) [1]
Infant mortality rate
- Total:
 7.8 deaths/1,000 live births (2012) [1]
 - Male: 9.2 deaths/1,000 live births (2012)
- Female: 6.2 deaths/1,000 live births (2012)
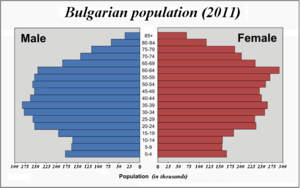
Age structure
- 0–14 years:
 13.2%
13.2% - 15–65 years: 68.3%
- 65 years and over: 18.5% (Census 2011) [2]
| Age Structure (2011) | |||
|---|---|---|---|
| Under working age (0 – 17) | Working age (18 – 64) | Above working age (65 and over) | |
| 1 172 208 (16.0%) | 4 789 967 (65.1%) | 1 389 059 (18.9%)s | |
The median age is around 40 years as of 2011.
Sex ratio
Of the total 7,364,570 as of 2011, 3 586 571 are males and 3,777,999 are females, or there are 1053 women for 1,000 men.
Education
Over 98% of the population is literate, the males being more literate than the females.
Unemployment
The median unemployment for the country in 2011 was 10.1%.
Private ownership
According to Eurostat, 82.3% per cent of the population live in privately owned and owner-occupied homes, ranking it as 12th highest in ownership globally.[27] It is down from a recent peak of 87.6% in 2008, and has been steadily falling since.[27] The number of Internet users has increased rapidly since 2000—from 430,000 their number grew to 1.55 million in 2004, and 3.4 million (48 per cent penetration rate) in 2010.[28] Bulgaria has the third-fastest average Broadband Internet speed in the world after South Korea and Romania with an average speed of 1,611 KBps.[29][30] Currently there are three active mobile phone operators—Mtel, Telenor and Vivacom, Mtel is the largest one with 5.2 million users as of 2010,[31] Telenor has 3,9 million as of 2007 and Vivacom over 1 million.
HIV
Bulgaria's HIV rate is among the lowest in the world, being 0.1% or 3,800 infected as of 2009.
Urbanization
Most Bulgarians (72.5 per cent) reside in urban areas. Approximately one-sixth of them live in Sofia, which has a population exceeding 1,200,000 people.
- Urban population: 5,338,261 or 72.5% of total population (Census 2011) [2]
- Rural: 2,026,309 or 27.5%
- Rate of urbanization: -0.3% annual rate of change (2005–10 est.)
Largest cities
| | |||||||||
|---|---|---|---|---|---|---|---|---|---|
| Rank | Name | Province | Pop. | Rank | Name | Province | Pop. | ||
.JPG) Sofia  Plovdiv |
1 | Sofia | Sofia-Capital | 1,204,685 | 11 | Pernik | Pernik | 80,191 |  Varna Burgas |
| 2 | Plovdiv | Plovdiv | 338,153 | 12 | Haskovo | Haskovo | 76,397 | ||
| 3 | Varna | Varna | 334,870 | 13 | Yambol | Yambol | 74,132 | ||
| 4 | Burgas | Burgas | 200,271 | 14 | Pazardzhik | Pazardzhik | 71,979 | ||
| 5 | Ruse | Ruse | 149,642 | 15 | Blagoevgrad | Blagoevgrad | 70,881 | ||
| 6 | Stara Zagora | Stara Zagora | 138,272 | 16 | Veliko Tarnovo | Veliko Tarnovo | 68,783 | ||
| 7 | Pleven | Pleven | 106,954 | 17 | Vratsa | Vratsa | 60,692 | ||
| 8 | Sliven | Sliven | 91,620 | 18 | Gabrovo | Gabrovo | 58,950 | ||
| 9 | Dobrich | Dobrich | 91,030 | 19 | Asenovgrad | Plovdiv | 50,846 | ||
| 10 | Shumen | Shumen | 80,855 | 20 | Vidin | Vidin | 48,071 | ||
See also
- Immigration to Bulgaria
- Immigration to Europe
- List of countries by immigrant population
- Bulgaria
- Aging of Europe
References
- 1 2 3 4 5 6 7 8 9 "National statistical institute". Nsi.bg. 2014-04-17. Retrieved 2014-04-17.
- 1 2 3 4 5 2011 Bulgarian census (in English)
- ↑ Human Development Index 2013, Human development indices by the United Nations. Retrieved on 4 May 2013
- ↑ "Interactive Infographic of the World's Best Countries". Newsweek.com. 15 August 2010. Retrieved 24 July 2011.
- ↑ "[The population of Bulgaria during the Middle Ages... [Naselenie. 1986] - PubMed – NCBI". 4. Ncbi.nlm.nih.gov. 2014-01-24: 3–11. PMID 12280532.
- ↑ http://www.nsi.bg/en/content/6727/population-projections-sex-and-age
- ↑ B.R. Mitchell. European historical statistics, 1750–1975.
- ↑ Demographic Yearbook 1948 (PDF). Statistical Office of the United Nations. Retrieved 20 February 2015.
- ↑ "National Statistical Institute of Bulgaria". Retrieved 10 October 2014.
- ↑ "Official forecast for the population of Bulgaria". National Statistical Institute of Bulgaria.
- 1 2 3 4 5 6 "Население по местоживеене, пол и етническа група (Population by place of residence, sex and ethnic group)". NSI. 1900–2011.
- ↑ Georgeoff, Peter John (with David Crowe), "National Minorities in Bulgaria, 1919– 1980" in Horak, Stephen, ed., Eastern European National Minorities 1919/1980: A Handbook, (Littleton, Co: Libraries Limited, Inc.).
- ↑ v, Joseph. The Communist Party of Bulgaria; Origins and Development, 1883–1936. Columbia University Press. p. 126.
- ↑ A. Cook, Bernard (2001). Europe Since 1945: An Encyclopedia. Taylor & Francis. p. 810. ISBN 0-8153-4058-3.
- ↑ "6.1 European population committee (The demographic characteristics of the main ethnic/national minorities in Bulgaria)". Council of Europe.
- ↑ "НАСЕЛЕНИЕ КЪМ 1 March 2001 Г. ПО ОБЛАСТИ И ЕТНИЧЕСКА ГРУПА (Inhabitants as at 1 March 2001 by province and ethnic group)". NSI. 1 March 2001.
- ↑ "Население по местоживеене, възраст и етническа група (Population by place of residence, age and ethnic group)". NSI. 2011.
- ↑ Population by province, municipality, settlement and ethnic identification, by 1 February 2011; Bulgarian National Statistical Institute (Bulgarian)
- ↑ "Population by mother tongue". NSI.
- ↑ Cultrual Policies and Trends in Europe. "Population by ethnic group and mother tongue, 2001". Retrieved 2 December 2008.
- ↑ Population as of March 2001 by Religion National Statistical Institute. Retrieved Sept 2012.
- ↑ Population 2011 final results by Religion National Statistical Institute. Retrieved Sept 2012.
- ↑ "Население по местоживеене, възраст и вероизповедание" (in Bulgarian). NSI. 2011. Retrieved 2016-04-11.
- ↑ "Структура на населението по вероизповедание (Structure of the population by confession)". NSI.
- ↑ "Етнически малцинствени общности (Ethnic minority communities)". NSI.
- ↑ Archived 23 May 2011 at the Wayback Machine.
- 1 2 "Eurostat - Data Explorer - Distribution of population by tenure status, type of household and income group". Eurostat. Retrieved 23 October 2016.
- ↑ "Bulgaria Internet Usage Stats and Market Report". Internetworldstats.com. 30 June 2010. Retrieved 20 December 2011.
- ↑ "Bulgaria ranks third in global Internet speed survey". The Sofia Echo. 21 September 2011. Retrieved 8 June 2012.
- ↑ "The World in 2011 – Facts and Figures" (PDF). International Telecommunication Union. February 2012. Retrieved 27 April 2012.
- ↑ Archived 23 April 2012 at the Wayback Machine.
- ↑ http://www.nsi.bg/EPDOCS/Census2011final.pdf
External links
| Wikimedia Commons has media related to Demographics of Bulgaria. |
- 2005 Report on European Demography, Eurostat
- Annual report of the National Statistics Institute for 2005 regarding population and demographic processes
- Bulgarian Subject Files – Social Issues: Minorities Open Society Archives, Budapest
- Bulgarians – Species on the Brink
Bulgaria articles | |||||||
|---|---|---|---|---|---|---|---|
| History | .svg.png) | ||||||
| Geography | |||||||
| Politics | |||||||
| Economy | |||||||
| Society |
| ||||||
| |||||||
according to 2011 census data | |
|