Tamluk (community development block)
| Tamluk তমলুক | |
|---|---|
|
Community development block সমষ্টি উন্নয়ন ব্লক | |
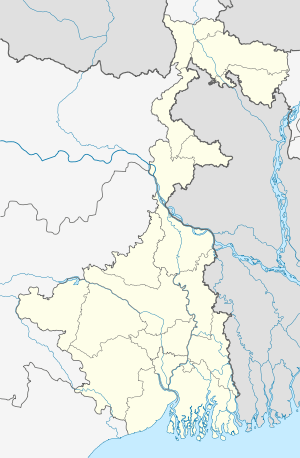 Tamluk Location in West Bengal, India | |
| Coordinates: 22°18′55″N 87°50′51″E / 22.3151430°N 87.8473663°ECoordinates: 22°18′55″N 87°50′51″E / 22.3151430°N 87.8473663°E | |
| Country |
|
| State | West Bengal |
| District | Purba Medinipur |
| Government | |
| • Type | Community development block |
| Area | |
| • Total | 123.50 km2 (47.68 sq mi) |
| Elevation | 6 m (20 ft) |
| Population (2011) | |
| • Total | 217,776 |
| • Density | 1,800/km2 (4,600/sq mi) |
| Languages | |
| • Official | Bengali, English |
| Time zone | IST (UTC+5:30) |
| PIN |
721636 (Tamluk) 721653 (Chanserpur) |
| Area code(s) | 03228 |
| Vehicle registration | WB-29, WB-30, WB-31, WB-32, WB-33 |
| Literacy | 87.06% |
| Lok Sabha constituency | Tamluk |
| Vidhan Sabha constituency | Moyna, Nandakumar, Tamluk |
| Website |
purbamedinipur |
Tamluk is a community development block that forms an administrative division in Tamluk subdivision of Purba Medinipur district in the Indian state of West Bengal.
History
Tamralipta
Tamralipta, the port in ancient India, is believed by scholars to have been around modern-day Tamluk. It is mentioned in the writings of Ptolemy (150 AD), the Greco-Egyptian writer, Faxian (earlier referred to as Fa Hien) (405-11 AD), the Chinese Buddhist monk, who travelled to India on foot, and Xuanzang (earlier referred to as Hiuen Tsiang) (seventh century AD), the Chinese Buddhist monk, scholar, traveller and translator. It was the main port used by Ashoka, the Mauryan emperor. With too much siltation the port lost its importance around 8th century A.D.[1]
Geography
Overview
Purba Medinipur district is part of the lower Indo-Gangetic Plain and Eastern coastal plains. Topographically, the district can be divided into two parts – (a) almost entirely flat plains on the west, east and north, (b) the coastal plains on the south. The vast expanse of land is formed of alluvium and is composed of younger and coastal alluvial. The elevation of the district is within 10 metres above mean sea level. The district has a long coastline of 65.5 km along its southern and south eastern boundary. Five coastal CD Blocks, namely, Khejuri II, Contai II (Deshapran), Contai I, Ramnagar I and II, are occasionally affected by cyclones and tornadoes. Tidal floods are quite regular in these five CD Blocks. Normally floods occur in 21 of the 25 CD Blocks in the district. The major rivers are Haldi, Rupnarayan, Rasulpur, Bagui and Keleghai, flowing in north to south or south-east direction. River water is an important source of irrigation. The district has a low 899 hectare forest cover, which is 0.02% of its geographical area.[1][2][3]
Location
Naikuri is located at 22°18′55″N 87°50′51″E / 22.3151430°N 87.8473663°E.
Tamluk CD Block is bounded by Panskura, Kolaghat and Sahid Matangini CD Blocks in the north, Shyampur I and Shyampur II CD Blocks, in Howrah district across the Rupnarayan, in the east, Nandakumar CD Block in the south and Moyna CD Block in the west.[4][5]
It is located to the west of Tamluk, the district headquarters.[4]
Area and administration
Tamluk CD Block has an area of 123.50 km2. It has 1 panchayat samity, 12 gram panchayats, 161 gram sansads (village councils), 107 mouzas and 99 inhabited villages. Tamluk police station serves this block.[6] Headquarters of this CD Block is at Tamluk.[7]
Gram panchayats
Gram panchayats of Tamluk block/ panchayat samiti are: Anantapur I, Anantapur II, Bishnubar I, Bishnubar II, Nilkuntha, Padumpur I, Padumpur II, Pipulberia I, Pipulberia II, Srirampur I and Srirampur II.[8]
Demographics
Population
As per 2011 Census of India Tamluk CD Block had a total population of 217,776, of which 207,064 were rural and 10,712 were urban. There were 112,458 (52%) males and 105,398 (48%) females. Population below 6 years was 25,516. Scheduled Castes numbered 21,145 (9.71%) and Scheduled Tribes numbered 67 (0.03%).[9]
As per 2001 census, Tamluk block had a total population of 204,406, out of which 104,982 were males and 91,424 were females. Tamluk block registered a population growth of 12.06 per cent during the 1991-2001 decade. Decadal growth for the combined Midnapore district was 14.87 per cent.[10]Decadal growth in West Bengal was 17.84 per cent.[11]
Census towns and large villages
Census Towns in Tamluk CD Block (2011 census figures in brackets): Anantapur (5,532), Dakshin Baguan (5,180).[9]
Large villages (with 4,000+ population) in Tamluk CD Block (2011 census figures in brackets): Harashankar (4,379), Nilkanthia (5,236), Bishnubar (4,957), Babarya (4,692), Putputya (5,300), Srirampur (10,906), Purbba Nukha (4,766), Simulia (6,384), Mirikpur (4,865) and Uttar Sonamul (4,711).[9]
Literacy
As per 2011 census the total number of literates in Tamluk CD Block was 167,388 (87.06% of the population over 6 years) out of which 92,018 (55%) were males and 75,370 (45%) were females.[9]
As per 2011 census, literacy in Purba Medinipur district was 87.02%.[12] Purba Medinipur had the highest literacy amongst all the districts of West Bengal in 2011.[13] Literacy in West Bengal was 77.08% in 2011.[14] Literacy in India in 2011 was 74.04%.[14]
See also – List of West Bengal districts ranked by literacy rate
| Literacy in CD Blocks of Purba Medinipur district |
|---|
| Tamluk subdivision |
| Tamluk – 87.06% |
| Sahid Matangini – 86.99% |
| Panskura I – 83.65% |
| Panskura II – 84.93% |
| Nandakumar – 85.56% |
| Chandipur – 87.81% |
| Moyna – 86.33% |
| Haldia subdivision |
| Mahishadal – 86.21% |
| Nandigram I – 84.89% |
| Nandigram II – 89.16% |
| Sutahata – 85.42% |
| Haldia – 85.96% |
| Contai subdivision |
| Contai I – 89.32% |
| Contai II – 88.33% |
| Contai III – 89.88% |
| Khejuri I – 88.90% |
| Khejuri II – 85.37% |
| Ramnagar I – 87.84% |
| Ramnagar II – 89.38% |
| Bhagabanpur II – 90.98% |
| Egra subdivision |
| Bhagabanpur I – 88.13% |
| Egra I – 82.83% |
| Egra II – 86.47% |
| Patashpur I – 86.58% |
| Patashpur II – 86.50% |
| Source: 2011 Census: CD Block Wise Primary Census Abstract Data |
Language
Bengali is the local language in these areas.[4]
Religion
In 2011 census Hindus numbered 176,478 and formed 81.04% of the population in Tamluk CD Block. Muslims numbered 40,977 and formed 18.81% of the population. Others numbered 321 and formed 0.15% of the population.[15]
In 2011, Hindus numbered 4,343,972 and formed 85.24% of the population in Purba Medinipur district. Muslims numbered 743,436 and formed 14.59% of the population. In West Bengal, Hindus numbered 64,385,546 and formed 70.53% of the population. Muslims numbered 24,654,825 and formed 27.01% of the population.[15]
Human Development Report
| Concentration of Handicraft Activities in CD Blocks |
|---|
Source: District Human Development Report, Purba Medinipur, Page 97 |
According to the District Human Development Report of Purba Medinipur: the density of population (2001 census) at 1,028 persons per km2 was higher than the West Bengal average of 903 persons per km2. It is an overwhelmingly rural district with the urban population being only 7.23% of the total population. The scheduled castes form 19.05% of the total population and the scheduled tribes 5.41%, the former or the two together being the lowest in the state.[16]
The agricultural sector is the lifeline of a predominantly rural economy. It is largely dependent on the Low Capacity Deep Tubewells (around 50%) or High Capacity Deep Tubewells (around 27%) for irrigation, as the district does not have a good network of canals, compared to some of the neighbouring districts. In many cases the canals are drainage canals which get the backflow of river water at times of high tide or the rainy season.[16]
In 2007-08, around 85% of the mouzas in the district had electric connections and around 40% of rural households had electricity. Over 90% of the rural households had access to toilet facility. In rural areas the tubewell was taken to be a reliable source of drinking water till arsenic contamination put a question mark on it. Piped water supply is a distant dream for rural people. In the rural areas of the district 6% households enjoy piped drinking water supply facility. In Purba Medinipur, around 70% of the people have a low standard of living.[16]
The average size of land holding in Purba Medinipur, in 2005-06, was 0.73 hectares against 1.01 hectares in West Bengal. In 2001, agricultural workers plus cultivators formed 55.41% of the total workers (main plus marginal). For rice cultivation, the area cultivated under Aman (or winter crop) is one and a half times that of the area under Boro (or summer crop). Purba Medinipur’s net district domestic product derives one fifth of its earnings from fisheries, the highest amongst all the districts of West Bengal. Betelvine is a major source of livelihood in Purba Medinipur district, particularly in Tamluk and Contai subdivisions. Betelvine production in 2008-09 was the highest amongst all the districts and was around a third of the total state production. In 2008-09, Purba Mednipur produced 2,789 tonnes of cashew nuts from 3,340 hectares of land.[16]
The report has provided CD Block-wise data for Modified Human Poverty Index of the district. The information has been modified to suit this page and published in the table alongside. The CD Block-wise mean MHPI is estimated at 24.9. 11 out of 25 CD Blocks are found to be severely deprived in respect of grand CD Block average value of MHPI (CD Blocks with lower amount of poverty are better): All the CD Blocks of Haldia and Contai subdivisions appeared backward, except Ramnagar I & II, of all the blocks of Egra subdivision only Bhagabanpur I appeared backward and in Tamluk subdivision none appeared backward.[16]
(Note: Certain topics, such as Literacy, Education, Healthcare etc., are not covered here and are covered elsewhere in this page.)
| Modified Human Poverty Index in CD Blocks of Purba Medinipur district |
|---|
| Tamluk subdivision |
| Tamluk – 24.38 |
| Sahid Matangini – 23.77 |
| Panskura I – 21.00 |
| Panskura II – 18.72 |
| Nandakumar – 24.78 |
| Chandipur – 21.84 |
| Moyna – 23.89 |
| Haldia subdivision |
| Mahishadal – 26.35 |
| Nandigram I – 25.91% |
| Nandigram II – 30.41 |
| Sutahata – 29.72 |
| Haldia – 28.87 |
| Contai subdivision |
| Contai I – 27.74 |
| Contai II – 28.95 |
| Contai III – 29.68 |
| Khejuri I – 25.55 |
| Khejuri II – 27.21 |
| Ramnagar I – 21.31 |
| Ramnagar II – 22.80 |
| Bhagabanpur II – 22.26 |
| Egra subdivision |
| Bhagabanpur I – 27.81 |
| Egra I – 21.31 |
| Egra II – 24.56 |
| Patashpur I – 20.81 |
| Patashpur II – 20.72 |
| Source: District Human Development Report: Purba Medinipur, 2011, page 214 |
Economy
Infrastructure
Tamluk CD Block had 6,200 hectares of canals. In 2003-04 Tamluk CD Block had 45 km of surfaced roads under PWD, 9 km surfaced roads under Zilla Parishad and 304 km surfaced roads under Gram Panchayat and Panchayat Samiti.[17]
Agriculture
In 2003-04 the farmers of Tamluk CD Block could be classified as follows: Bargadars 5.88%, patta (document) holders 3.01%, small farmers 1.73%, marginal farmers 51.42% and agricultural labourers 37.95%.[17]
As of 2003-04, Tamluk CD Block had 1,212 hectares vested land, out of which 129 hectares were distributed amongst 1,473 persons.[17]
In 2003-04 net area sown in Tamluk CD Block was 7,741 hectares and the area in which more than one crop was grown was 7,500 hectares.[17]
In 2003-04 Tamluk CD Block produced 14,250 tonnes of Aman paddy from 6,860 hectares, 26,510 tonnes Boro paddy from 6,590 hectares, 590 tonnes of jute from 40 hectares and 300 tonnes of potatoes from 20 hectares.[17]
Pisciculture
In Tamluk CD Block 732 hectares was the nett area under effective pisiculture and 506 persons were engaged in the profession. Approximate annual production in 2003-04 was 12,803 qtl.[17]
Transport
The Panskura-Haldia line was constructed in 1968.[18] The Panskura-Haldia line was electrified in 1974-76.[19] Tamluk is a station on this line.
NH 116, from Kolaghat to Haldia, passes through this block.[20]
Tamluk CD Block has 3 ferry services and 15 originating/ terminating bus routes.[17]
Education
In 2003-04, Tamluk CD Block had 143 primary schools with 18,971 students, 6 middle schools with 1,836 students, 17 high schools with 11,968 students and 9 higher secondary schools with 9,981 students. Tamluk CD Block had 3 professional and technical institution with 208 students, 238 institutions with 11,015 students for special and non-formal education.Tamluk CD Block had 144 mass literacy centres[17]
Healthcare
Tamluk CD Block had 3 health centres, 34 clinics and 1 dispensary with 22 beds and 4 doctors in 2003.[17]
External links
-
 Tamluk travel guide from Wikivoyage
References
- 1 2 "District Human Development Report: Purba Medinipur" (PDF). Chapter I Introduction. Development and Planning Department, Government of West Bengal, 2011. Retrieved 29 June 2016.
- ↑ "Brief Industrial Profile of Purba Midnapur District" (PDF). Ministry of Micro Small and Medium Industries, Government of India. Retrieved 29 June 2016.
- ↑ "Mapping Dynamics of land utilization and its changing Patterns of Purba Medinipure District - W.B". researchgate.net. Retrieved 29 June 2016.
- 1 2 3 "Tamluk". onefivenine. Retrieved 22 June 2016.
- ↑ "District Map Purba Medinipur". Maps. Purba Medinipur district administration. Retrieved 22 June 2016.
- ↑ "District Statistical Handbook 2014 Purba Medinipur". Tables 2.1, 2.2. Department of Statistics and Programme Implementation, Government of West Bengal. Retrieved 6 November 2016.
- ↑ "District Census Handbook: Purba Medinipur" (PDF). Map of Purba Medinipur with CD Block HQs and Police Stations. Directorate of Census Operations, West Bengal, 2011. Retrieved 9 November 2016.
- ↑ "Directory of District, Subdivision, Panchayat Samiti/ Block and Gram Panchayats in West Bengal". Purba Medinipur - Revised in March 2008. Panchayats and Rural Development Department, Government of West Bengal. Retrieved 22 June 2016.
- 1 2 3 4 "C.D. Block Wise Primary Census Abstract Data(PCA)". 2011 census: West Bengal – District-wise CD Blocks. Registrar General and Census Commissioner, India. Retrieved 1 July 2016.
- ↑ "Provisional population totals, West Bengal, Table 4, (erstwhile) Medinipur District". Census of India 2001. Census Commission of India. Archived from the original on September 28, 2011. Retrieved 7 June 2016.
- ↑ "Provisional Population Totals, West Bengal. Table 4". Census of India 2001. Census Commission of India. Archived from the original on 27 September 2007. Retrieved 6 July 2016.
- ↑ "Purba Medinipur (East Midnapore) District: Census 2011 data". 2016 Digital Trends. Census Population 2015 Data. Retrieved 27 June 2016.
- ↑ "Districts of West Bengal". High Literacy. Census Population 2015 Data. Retrieved 27 June 2016.
- 1 2 "Provisional population tables and annexures" (PDF). Census 2011:Table 2(3) Literates and Literacy rates by sex. Registrar General and Census Commissioner, India. Retrieved 27 June 2016.
- 1 2 "C1 Population by Religious Community". West Bengal. Registrar General and Census Commissioner, India. Retrieved 29 June 2016.
- 1 2 3 4 5 "District Human Development Report: Purba Medinipur" (PDF). May 2011. Pages: 23, 26, 30, 31-33, 37, 61-63, 80, 83, 89, 91, 93. Development & Planning Department, Government of West Bengal. Retrieved 22 June 2016.
- 1 2 3 4 5 6 7 8 9 "District Statistical Handbook – 2004 – Purba Medinipur" (PDF). Tables 3.1, 4.4, 4.6, 8.2, 17.2, 18.1, 18.2, 18.3, 18.4, 21.1, 21.2. Bureau of Applied Economics and Statistics, Government of West Bengal. Retrieved 21 June 2016.
- ↑ "Year of construction of important BG lines" (PDF). History. South Eastern Railway. Retrieved 1 July 2016.
- ↑ "History of Electrification". IRFCA. Retrieved 1 July 2016.
- ↑ "National Highways" (PDF). Ministry of Road Transport and Highways. Retrieved 1 July 2016.