Sabang (community development block)
| Sabang সবং | |
|---|---|
|
Community development block সমষ্টি উন্নয়ন ব্লক | |
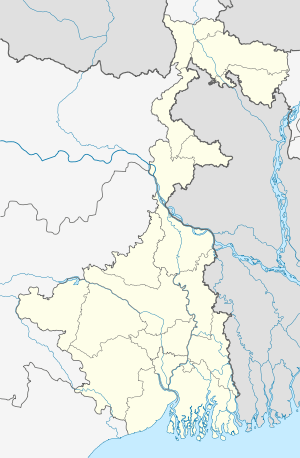 Sabang Location in West Bengal, India | |
| Coordinates: 22°10′34″N 87°36′04″E / 22.176°N 87.601°ECoordinates: 22°10′34″N 87°36′04″E / 22.176°N 87.601°E | |
| Country |
|
| State | West Bengal |
| District | Paschim Medinipur |
| Government | |
| • Type | Community development block |
| Area | |
| • Total | 305.00 km2 (117.76 sq mi) |
| Elevation | 17 m (56 ft) |
| Population (2011) | |
| • Total | 270,492 |
| • Density | 890/km2 (2,300/sq mi) |
| Languages | |
| • Official | Bengali, English |
| Time zone | IST (UTC+5:30) |
| PIN |
721144 (Sabang) 721161 (Mohar) 721467 (Dasagram) |
| Telephone/STD code | 03228 |
| Vehicle registration | WB-34 |
| Literacy | 86.84% |
| Lok Sabha constituency | Ghatal |
| Vidhan Sabha constituency | Sabang |
| Website |
paschimmedinipur |
Sabang is a community development block that forms an administrative division in the Kharagpur subdivision of Paschim Medinipur district in the Indian state of West Bengal.
Geography
Overview
Paschim Medinipur, located in the south-western part of West Bengal, was created with the partition of the erstwhile Midnapore district, then the largest district of India, on 1 January 2002. It ranks second in terms of geographical area (9,295.28 km2) amongst the districts of the state, next to South 24-Parganas (9,960 km2). It ranks third in terms of rural population (4.58 million) following South 24-Parganas (5.82 million) and Murshidabad (5.13 million). It ranked fourth in terms of percentage of tribal population (14.87) following Jalpaiguri (18.87), Purulia (18.27) and Dakshin Dinajpur (16.12) in 2011.[1]
Broadly speaking, there are two natural divisions of the district. NH 14 and NH 16 (old numbering NH 60) from Bankura to Balasore, cuts across the district and roughly is the dividing line between the two natural divisions. To the east of this road, the soil is fertile alluvial and the area is flat. To the west, the Chota Nagpur Plateau gradually slopes down creating an undulating area with infertile laterite rocks/ soil. The landscape changes from dense dry deciduous forests in the west to marshy wetlands in the east.[1]
The alluvial portion may be further subdivided into two divisions. First, it is a strip of purely deltaic country nearer to the Hooghly and the Rupnarayan, intersected by numerous rivers and water courses subject to tidal influences. Second, it is rest of the eastern half of the district. It is a monotonous rice plain with numerous waterways and tidal creeks intersecting it. The tidal creeks are lined with embankments to prevent flooding of the fields. Much of the area is water-logged.[1]
In Sabang CD Block 100% of the cultivated area has alluvial soil.[1]
Rivers
The river system of Paschim Medinipur district consists of the Rupnarayan, the Silabati or Silai, the Kangsabati or Kansai, the Subarnarekha and the Dulongs. The Silai enters the district from Bankura district, flows through the northern parts of Medinipur Sadar subdivision and then enters Ghatal subdivision and joins the Rupnarayan at Bhandar, 4 miles below Ghatal. The Kasai enters the district from Bankura district. It flows past Medinipur town, bifurcates into two channels, one of which joins the Rupnarayan. Purandar, Gopa, Chandaur and Kubai are important tributaries in the system. The Subarnarekha enters the district from East Singhbhum district in Jharkhand, flows through the southern part of Medinipur Sadar subdivision, intersects Gopiballavpur police station area, flows past Dantan town and enters Balasore district of Odisha.[1]
Floods and drought
Paschim Medinipur district is subject to both floods and drought. Ghatal and parts of Kharagpur subdivision covering an area of 142,647 hectares (1,426.47 km2) are flood prone. Water logging during the rainy season affects Ghatal and the southern parts of Kharagpur subdivion and results in loss of crops in such areas as Sabang, Pingla and Narayangarh CD Blocks.335,248 hectares (3,352.48 km2) in Jhargram and Medinipur Sadar subdivisions are drought prone. The drought situation is particularly severe in Jhargram subdivision. Although the district is away from the sea, cyclones hit it frequently in October–November.[1]
Location
Sabang is located at 22°10′34″N 87°36′04″E / 22.176°N 87.601°E.
Sabang CD Block is bounded by Pingla CD Block in the north, Moyna CD Block, in Purba Medinipur district, in the east, Patashpur I CD Block, in Purba Medinipur district, in the south and Narayangarh CD Block in the west.[2][3]
It is located 45 km from Midnapore, the district headquarters.[2]
Area and administration
Sabang CD Block has an area of 305.00 km2. It has 1 panchayat samity, 13 gram panchayats, 200 gram sansads (village councils), 232 mouzas and 226 inhabited villages. Sabang police station serves this block.[4] Headquarters of this CD Block is at Sabang.[5]
Gram panchayats
Gram panchayats of Sabang block/ panchayat samiti are: Balpai, Bhemua, Bishnupur, Bural, Chaulkuri, Danrra, Dasagram, Debhog, Mohar, Narayanbarh, Nawgaon, Sabang and Sartta.[6]
Demographics
Population
As per the 2011 Census of India Sabang CD Block had a total population of 270,492, all of which were rural. There were 138,924 (51%) males and 131,568 (49%) females. Population below 6 years was 31,689. Scheduled Castes numbered 36,064 (13.33%) and Scheduled Tribes numbered 16,818 (6.22%).[7]
As per 2001 census, Sabang block had a total population of 238,686, out of which 122,778 were males and 115,908 were females. Sabang block registered a population growth of 14.84 per cent during the 1991-2001 decade. Decadal growth for the combined Midnapore district was 14.87 per cent.[8] Decadal growth in West Bengal was 17.45 per cent.[9]
Villages
Large villages (with 4,000+ population) in Sabang CD Block are (2011 census figures in brackets): Sabang (13,224), Dubrajpur (4,578), Dasha Gram (5,232), Adasimla (4,622), Bural (5,145), Mohar (6,995), Nimkimohar (5,055) and Bishnupur (8,678).[7]
Other villages in Sabang CD Block are (2011 census figures in brackets): Narayanbar (2,450), Sartla (1,856), Danrra (2,924), Debhog (2,508), Balpai (2,867), Bhemwa (3,967) and Chaaulkuri (3,519).[7]
As per the 2001 census, Sabang block had a total population of 238,686, out of which 122,778 were males and 115,908 were females. Sabang block registered a population growth of 14.84 per cent during the 1991-2001 decade. Decadal growth for the combined Midnapore district was 14.87 per cent.[8] Decadal growth in West Bengal was 17.45 per cent.[9]
Literacy
As per the 2011 census the total number of literates in Sabang CD Block was 207,370 (86.84% of the population over 6 years) out of which males numbered 114,304 (93.16% of the male population over 6 years) and females numbered 93,066 (80.15% of the female population over 6 years). The gender gap in literacy rates was 13.01%.[7]
As per the 2011 census, literacy in Paschim Medinipur district was 78.00%.[10] Literacy in West Bengal was 77.08% in 2011.[11] Literacy in India in 2011 was 74.04%.[11]
See also – List of West Bengal districts ranked by literacy rate
| Literacy in CD Blocks of Paschim Medinipur district |
|---|
| Jhargram subdivision |
| Binpur I – 69.74% |
| Binpur II – 70.46% |
| Gopiballavpur I – 65.44% |
| Gopiballavpur II – 71.40% |
| Jamboni – 72.63% |
| Jhargram – 72.23% |
| Nayagram – 63.70% |
| Sankrail – 73.35% |
| Medinipur Sadar subdivision |
| Garhbeta I – 72.21% |
| Garhbeta II – 75.87% |
| Garhbeta III – 73.42% |
| Keshpur – 77.88% |
| Midnapore Sadar – 70.48% |
| Salboni – 74.87% |
| Ghatal subdivision |
| Chandrakona I – 78.93% |
| Chandrakona II – 75.96% |
| Daspur I – 83.99% |
| Daspur II – 85.62% |
| Ghatal – 81.08% |
| Kharagpur subdivision |
| Dantan I – 73.53% |
| Dantan II – 82.45% |
| Debra – 82.03% |
| Keshiari – 76.78% |
| Kharagpur I – 77.06% |
| Kharagpur II – 76.08% |
| Mohanpur – 80.51% |
| Narayangarh – 78.31% |
| Pingla – 83.57% |
| Sabang – 86.84% |
| Source: 2011 Census: CD Block Wise Primary Census Abstract Data |
Language
Bengali is the local language in these areas.[2]
Religion
In the 2011 census Hindus numbered 253,471 and formed 93.71% of the population in Sabang CD Block. Muslims numbered 16,546 and formed 6.12% of the population. Others numbered 475 and formed 0.17% of the population.[12] Others include Addi Bassi, Marang Boro, Santal, Saranath, Sari Dharma, Sarna, Alchchi, Bidin, Sant, Saevdharm, Seran, Saran, Sarin, Kheria,[13] Christian and other religious communities.[12]
In 2011, Hindus numbered 5,056,953 and formed 85.52% of the population in Paschim Medinipur district. Muslims numbered 620,554 and formed 10.49% of the population. Others (including Christians) numbered 235,950 and formed 3.99% of the population. Christians numbered 23,287 and formed 0.39% of the population. In West Bengal, Hindus numbered 64,385,546 and formed 70.53% of the population. Muslims numbered 24,654,825 and formed 27.01% of the population.[12]
Human Development Report
According to the District Human Development Report of Paschim Medinipur: The district represents regional diversity in terms of physiographic, agro-climatic characteristics, economic development, social composition etc. Over 7,500 inhabited villages of the district reflect highly differential features and indicators of human development. There are pockets of prosperity in the eastern part and areas of distress in the western part. From 2009 Maoist violence rapidly spread across eleven western CD Blocks of the district: Binpur I, Binpur II, Salboni, Grahbeta II, Jamboni, Jhargram, Midnapore Sadar, Gopiballavpur I, Gopiballavpur II, Sankrail and Nayagram.[14]
The level of urbanisation in the district is low. In 2001 the percentage share of the urban population in the district was 11.90 against 27.96 in the state as a whole. Population density at 531 persons per km2 was lower than the West Bengal average of 903 persons per km2. The literacy rate has increased significantly from 39.80% in 1981 to 70.41% in 2001, but the gender gap in literacy rate (difference between female and male literacy rates) is substantial.[14]
There is high agricultural productivity differential across 29 blocks of the district. The differential being high across drought prone blocks of the western part of the district and substantially irrigated blocks of its eastern part. Low productivity of agriculture has considerable relevance for high level of poverty among households in the drought prone regions specially among the SCs and STs. The district is relatively backward in the development of infrastructure.[14]
Electrification was extended to 76.79% mouzas of the district by 2007. In Sabang CD Block electricity was extended to 76.72% of the mouzas by 2007.[14]
The United Nations Development Programme considers the combined primary and secondary enrolment ratio as the simple indicator of educational achievement of the children in the school going age. The infrastructure available is important. In Sabang CD Block out of the total 230 primary schools in 2008-2009, 44 had pucca buildings, 119 partially pucca, 2 kucha and 65 multiple type. In the district as a whole 43.6% of primary schools and 88.38% of upper primary schools had libraries, 30.99% primary schools (classes I – V) and 78.37% upper primary schools (classes VI to VIII) had play grounds, and 20.83% upper primary schools had computers. 62,697 sudents of primary schools and 242,728 students of upper primary schools were covered under the Midday Meal Scheme. Nayagram and Gopiballavpur I CD Blocks have been identified as educationally backward blocks and special efforts are being made through National Programme of Education for Girls at Elementary Level and Kasturba Gandhi Balika Vidyalaya hostels. These are the hostels for accommodating girl students from weaker sections of the society and all costs relating to their livelihood are borne by the government so that they are not to be deprived of availing elementary education for want of money or other social issues.[14]
As per the Rural Household Survey conducted in 2005 by the Department of Panchayats and Rural Development, Government of West Bengal, 43.79% of rural houselds in the district were Below Poverty Line against 34.12% in West Bengal.[14]
The 29 CD Blocks of the district were classified into four categories based on the poverty ratio. Nayagram, Binpur II and Jamboni CD Blocks have very high poverty levels (above 60%). Kharagpur I, Kharagpur II, Sankrail, Garhbeta II, Pingla and Mohanpur CD Blocks have high levels of poverty (50-60%), Jhargram, Midnapore Sadar, Dantan I, Gopiballavpur II, Binpur I, Dantan II, Keshiari, Chandrakona I, Gopiballavpur I, Chandrakona II, Narayangarh, Keshpur, Ghatal, Sabang, Garhbeta I, Salboni, Debra and Garhbeta III CD Blocks have moderate levels of poverty (25-50%) and Daspur II and Daspur I have low levels of poverty (below 25%).[14]
The loco shops of South Eastern Railway employed 3,983 persons, the carriage shops of South Eastern Railway employed 2,189 persons, the wagon repair shops of South Eastern Railway employed 1,700 persons. There were 14 units employing between 250 and 1,000 persons. All other industrial establishments in Paschim Medinipur employed less than 250 persons. More than 80% of Paschim Medinipur’s population depend on agricultural activities for a living.[14]
The dominant SC gropus in the district are Bagdi Dule, Dom, Jalia Kaibarta, Mal, Rajbanshi, Rajoyar, Keora, Bhimali, Bauri, and Tiyar. Ghatal sub-division has highest concentration of 24.95% SC population. The western part of the district shows more dense ST population. The Jhargram sub division has the highest concentration, i.e. 30.02% of total ST population. The major tribal communities of the district are Santhal, Bhumij, Munda, Lodha, Kora and Mahali. Among them, Lodha only belong to the primitive tribal group. Most of the STs live on agricultural labour. Many ST families move to the neighbouring districts in search of work, particularly during the cultivation season.[14]
(Note: Certain topics, such as Geography, Literacy, Education, Healthcare etc., are not/not fully covered here and are covered elsewhere in this page.)
| BPL households in CD Blocks of Paschim Medinipur district |
|---|
| Jhargram subdivision |
| Binpur I – 47.46% |
| Binpur II – 68.59% |
| Gopiballavpur I – 44.25% |
| Gopiballavpur II – 47.72% |
| Jamboni – 67.11% |
| Jhargram – 49.02% |
| Nayagram – 69.26% |
| Sankrail – 51.33% |
| Medinipur Sadar subdivision |
| Garhbeta I – 36.87% |
| Garhbeta II – 50.76% |
| Garhbeta III – 31.95% |
| Keshpur – 39.90% |
| Midnapore Sadar – 48.90% |
| Salboni – 36.11% |
| Ghatal subdivision |
| Chandrakona I – 44.21% |
| Chandrakona II – 41.84% |
| Daspur I – 22.16 % |
| Daspur II – 20.29% |
| Ghatal – 38.86% |
| Kharagpur subdivision |
| Dantan I – 48.81% |
| Dantan II – 46.97% |
| Debra – 33.76% |
| Keshiari – 46.89% |
| Kharagpur I – 58.56% |
| Kharagpur II – 53.57% |
| Mohanpur – 50.16% |
| Narayangarh – 41.60% |
| Pingla – 50.51 % |
| Sabang – 37.37% |
| Source: District Human Development Report: Paschim Medinipur, 2010, page 177 |
Economy
Infrastructure
in 2003-04, in Sabang CD Block 3,000 hectares were irrigated with tank water, 1,550 hecatres by deep tube wells and 10,000 hectares by shallow tube wells.[15] In 2006-07 in Sabang CD Block 31.25% of the gross cropped area had facilities for irrigation.[16]
In 2003-04 Sabang CD Block had 37 km of surfaced roads under PWD, 12 km surfaced roads under Zilla Parishad and 42 km surfaced roads and 508 km unsurfaced roads under Gram Panchayat and Panchayat Samiti.[15]
Agriculture
In 2003-04 the farmers of Sabang CD Block could be classified as follows: Bargadars 9.04%, patta (document) holders 36.27%, small farmers 2.38%, marginal farmers 4.55% and agricultural labourers 47.76%.[15]
Although the Bargadari Act of 1950 recognised the rights of bargadars to a higher share of crops from the land that they tilled, it was not implemented. Large tracts, beyond the prescribed limit of land ceiling, remained with the rich landlords. From 1977 onwards major land reforms took place in West Bengal. Land in excess of land ceiling was acquired and distributed amongst the peasants.[17] As of 2003-04, Sabang CD Block had 1,237 hectares vested land, out of which 1,191 hectares were distributed amongst 25,747 persons.[15]
In 2003-04 net area sown in Sabang CD Block was 24,460 hectares and the area in which more than one crop was grown was 17,200 hectares.[15]
In 2003-04 Sabang CD Block produced 10,300 tonnes of Aus paddy from 4,870 hectares, 24,150 tonnes of Aman paddy from 17,660 hectares, 52,260 tonnes Boro paddy from 17,970 hectares, 11,190 tonnes jute from 1,110 hectares, 500 tonnes wheat from 290 hectares and 2,680 tonnes potatoes from 180 hectares.[15]
Pisciculture
In Sabang CD Block 1,614 hectares was the nett area under effective pisiculture. 15,112 persons were engaged in the profession. Approximate annual production in 2003-04 was 25,519 qtl., the highest in the district.[15]
Transport
Sabang CD Block has 4 ferry services, 2 originating/ terminating bus routes. The nearest railway station is 22 km from CD Block headquarters.[15]
Education
In 2003-04, Sabang CD Block had 227 primary schools with 26,271 students, 23 middle schools with 6,412 students, 16 high schools with 10,824 students and 9 higher secondary schools with 8,930 students. Sabang CD Block had 1 general college with 1,460 students and 343 institutions with 12,814 students for special and non-formal education. Sabang CD Block had 138 mass literacy centres.[15]
Healthcare
Sabang CD Block had 1 hospital, 3 health centres, 29 clinics and 3 dispensaries with 50 beds and 8 doctors in 2003.[15]
References
- 1 2 3 4 5 6 "District Human Development Report: Paschim Medinipur" (PDF). Chapter I Introduction and Human Development Indices for Paschim Mednipur. Development and Planning Department, Government of West Bengal, 2011. Retrieved 25 July 2016.
- 1 2 3 "Sabang Block". onefivenine. Retrieved 22 July 2016.
- ↑ "District Map Paschim Medinipur". Maps. Paschim Medinipur district administration. Retrieved 22 July 2016.
- ↑ "District Statistical Handbook 2014 Paschim Medinipur". Tables 2.1, 2.2. Department of Statistics and Programme Implementation, Government of West Bengal. Retrieved 10 October 2016.
- ↑ "District Census Handbook: Paschim Medinipur" (PDF). Map of Paschim Medinipur with CD Block HQs and Police Stations (on the fifth page). Directorate of Census Operations, West Bengal, 2011. Retrieved 20 November 2016.
- ↑ "Directory of District, Subdivision, Panchayat Samiti/ Block and Gram Panchayats in West Bengal". Paschim Medinipur - Revised in March 2008. Panchayats and Rural Development Department, Government of West Bengal. Retrieved 1 August 2016.
- 1 2 3 4 "C.D. Block Wise Primary Census Abstract Data(PCA)". 2011 census: West Bengal – District-wise CD Blocks. Registrar General and Census Commissioner, India. Retrieved 3 May 2016.
- 1 2 "Provisional population totals, West Bengal, Table 4, (erstwhile) Medinipur District". Census of India 2001. Census Commission of India. Archived from the original on 28 September 2011. Retrieved 22 July 2016.
- 1 2 "Provisional Population Totals, West Bengal. Table 4". Census of India 2001. Census Commission of India. Archived from the original on 27 September 2007. Retrieved 17 July 2016.
- ↑ "Paschim Medinipur (West Midnapore) District: Census 2011 data". 2016 Digital Trends. Census Population 2015 Data. Retrieved 29 July 2016.
- 1 2 "Provisional population tables and annexures" (PDF). Census 2011:Table 2(3) Literates and Literacy rates by sex. Registrar General and Census Commissioner, India. Retrieved 29 July 2016.
- 1 2 3 "C1 Population by Religious Community". West Bengal. Registrar General and Census Commissioner, India. Retrieved 29 July 2016.
- ↑ "ST-14 A Details Of Religions Shown Under 'Other Religions And Persuasions' In Main Table". West Bengal. Registrar General and Census Commissioner, India. Retrieved 29 July 2016.
- 1 2 3 4 5 6 7 8 9 "District Human Development Report: Paschim Medinipur" (PDF). May 2011. Pages: 4-16, 38, 60-75, 176-178, 251, 263,271. Development & Planning Department, Government of West Bengal. Retrieved 31 July 2016.
- 1 2 3 4 5 6 7 8 9 10 "District Statistical Handbook – 2004 – Paschim Medinipur" (PDF). 2.1, 2.2, 3.1, 4.4, 4.6, 8.2, 17.2, 18.1, 18.2, 18.3, 18.4, 20.1, 21.1, 21.2. Bureau of Applied Economics and Statistics, Government of West Bengal. Retrieved 21 July 2016.
- ↑ "District Human Development Report: Paschim Medinipur" (PDF). Page 146, Table 5.19, Percentage Share of Irrigated Area. Development and Planning Department, Government of West Bengal, 2011. Retrieved 25 July 2016.
- ↑ "District Human Development Report: South 24 Parganas". (1) Chapter 1.2, South 24 Parganas in Historical Perspective, pages 7-9 (2) Chapter 3.4, Land reforms, pages 32-33. Development & Planning Department, Government of West Bengal, 2009. Retrieved 7 August 2016.