El Niño
El Niño /ɛl ˈniːnjoʊ/ (Spanish pronunciation: [el ˈniɲo]) is the warm phase of the El Niño Southern Oscillation (commonly called ENSO) and is associated with a band of warm ocean water that develops in the central and east-central equatorial Pacific (between approximately the International Date Line and 120°W), including off the Pacific coast of South America. El Niño Southern Oscillation refers to the cycle of warm and cold temperatures, as measured by sea surface temperature, SST, of the tropical central and eastern Pacific Ocean. El Niño is accompanied by high air pressure in the western Pacific and low air pressure in the eastern Pacific. The cool phase of ENSO is called "La Niña" with SST in the eastern Pacific below average and air pressures high in the eastern and low in western Pacific. The ENSO cycle, both El Niño and La Niña, causes global changes of both temperatures and rainfall.[2][3]
Developing countries dependent upon agriculture and fishing, particularly those bordering the Pacific Ocean, are the most affected. In American Spanish, the capitalized term "El Niño" refers to "the little boy", so named because the pool of warm water in the Pacific near South America is often at its warmest around Christmas.[4] "La Niña", chosen as the 'opposite' of El Niño, literally translates to "the little girl".
Concept
Originally the term El Niño applied to an annual weak warm ocean current that ran southwards along the coast of Peru and Ecuador about Christmas time.[5] However, over time the term has evolved and now refers to the warm and negative phase of the El Niño Southern Oscillation and is the warming of the ocean surface or above-average sea surface temperatures in either the central and eastern tropical Pacific Ocean.[6][7] This warming causes a shift in the atmospheric circulation with rainfall becoming reduced over Indonesia and Australia, while rainfall and tropical cyclone formation increases over the tropical Pacific Ocean.[8] The low-level surface trade winds, which normally blow from east to west along the equator, either weaken or start blowing from the other direction.[7]

Historically, El Niño events are thought to have been occurring for thousands of years.[9] For example, it is thought that El Niño affected the Inca Empire in modern-day Peru, who sacrificed humans in order to try to prevent the rains.[9] Scientists have also found the chemical signatures of warmer sea surface temperatures and increased rainfall caused by El Niño in coral specimens that are around 13,000 years old.[10] In around 1525 when Francisco Pizarro made landfall on Peru, he noted rainfall occurring in the deserts which subsequently became the first written record of the impacts of El Niño.[10] Modern day research and reanalysis techniques have managed to find at least 26 El Niño events since 1900, with the 1982-83, 1997–98 and 2014–16 events among the strongest on record.[11][12][13]
Currently, each country has a different threshold for what constitutes an El Niño event, which is tailored to their specific interests.[14] For example, the Australian Bureau of Meteorology looks at the trade winds, SOI, weather models and sea surface temperatures in the Nino 3 and 3.4 regions, before declaring an El Niño.[15] The United States Climate Prediction Center (CPC) and the International Research Institute for Climate and Society (IRI) looks at the sea surface temperatures in the Nino 3.4 region, the tropical Pacific atmosphere and forecasts that NOAA's Oceanic Niño Index will equal or exceed +0.5C for several seasons in a row.[16] However, the Japan Meteorological Agency declares that an El Niño event has started when the average 5 month sea surface temperature deviation for the NINO.3 region, is over 0.5 °C (0.90 °F) warmer for 6 consecutive months or longer.[17]
There is no consensus on if climate change will have any influence on the occurrence, strength or duration of El Niño events, as research supports El Niño events becoming stronger, longer, shorter and weaker.[18][19]
Occurrences

A timeline of all the El Nino episodes between 1900 and 2016.[11][12]
El Niño events are thought to have been occurring for thousands of years.[9] For example, it is thought that El Niño affected the Inca Empire in modern-day Peru, who sacrificed humans in order to try and prevent the rains.[9]
It is thought that there have been at least 30 El Niño events since 1900, with the 1982-83, 1997–98 and 2014–16 events among the strongest on record.[11][12] Since 2000, El Niño events have been observed in 2002–03, 2004–05, 2006–07, 2009–10 and 2014–16.[11]
Major ENSO events were recorded in the years 1790–93, 1828, 1876–78, 1891, 1925–26, 1972–73, 1982–83, 1997–98, and 2014–16.[20][21]
Typically, this anomaly happens at irregular intervals of two to seven years, and lasts nine months to two years.[22] The average period length is five years. When this warming occurs for seven to nine months, it is classified as El Niño "conditions"; when its duration is longer, it is classified as an El Niño "episode".[23]
There is no consensus on whether climate change will have any influence on the occurrence, strength or duration of El Niño events, as research supports El Niño events becoming stronger, longer, shorter and weaker.[18][19]
During strong El Niño episodes, a secondary peak in sea surface temperature across the far eastern equatorial Pacific Ocean sometimes follows the initial peak.[24]
Cultural history and prehistoric information

ENSO conditions have occurred at two- to seven-year intervals for at least the past 300 years, but most of them have been weak. Evidence is also strong for El Niño events during the early Holocene epoch 10,000 years ago.[25]
El Niño may have led to the demise of the Moche and other pre-Columbian Peruvian cultures.[26] A recent study suggests a strong El-Niño effect between 1789 and 1793 caused poor crop yields in Europe, which in turn helped touch off the French Revolution.[27] The extreme weather produced by El Niño in 1876–77 gave rise to the most deadly famines of the 19th century.[28] The 1876 famine alone in northern China killed up to 13 million people.[29]
An early recorded mention of the term "El Niño" to refer to climate occurred in 1892, when Captain Camilo Carrillo told the geographical society congress in Lima that Peruvian sailors named the warm north-flowing current "El Niño" because it was most noticeable around Christmas. The phenomenon had long been of interest because of its effects on the guano industry and other enterprises that depend on biological productivity of the sea.
Charles Todd, in 1893, suggested droughts in India and Australia tended to occur at the same time; Norman Lockyer noted the same in 1904. An El Niño connection with flooding was reported in 1895 by Pezet and Eguiguren. In 1924, Gilbert Walker (for whom the Walker circulation is named) coined the term "Southern Oscillation". He and others (including Norwegian-American meteorologist Jacob Bjerknes) are generally credited with identifying the El Niño effect.[30]
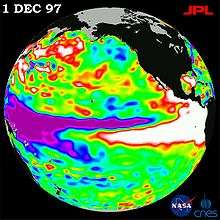
The major 1982–83 El Niño led to an upsurge of interest from the scientific community. The period 1991–1995 was unusual in that El Niños have rarely occurred in such rapid succession.[31] An especially intense El Niño event in 1998 caused an estimated 16% of the world's reef systems to die. The event temporarily warmed air temperature by 1.5 °C, compared to the usual increase of 0.25 °C associated with El Niño events.[32] Since then, mass coral bleaching has become common worldwide, with all regions having suffered "severe bleaching".[33]
El Niño diversity
It is thought that there are several different types of El Niño events, with the canonical eastern Pacific and the Modoki central Pacific types being the two that receive the most attention.[34][35][36] These different types of El Niño events are classified by where the tropical Pacific sea surface temperature (SST) anomalies are the largest.[36] For example, the strongest sea surface temperature anomalies associated with the canonical eastern Pacific event are located off the coast of South America.[36] The strongest anomalies associated with the Modoki central Pacific event are located near the International Dateline.[36] However, during the duration of a single event, the area with the greatest sea surface temperature anomalies can change.[36]
The traditional Niño, also called Eastern Pacific (EP) El Niño,[37] involves temperature anomalies in the Eastern Pacific. However, in the last two decades, nontraditional El Niños were observed, in which the usual place of the temperature anomaly (Niño 1 and 2) is not affected, but an anomaly arises in the central Pacific (Niño 3.4).[38] The phenomenon is called Central Pacific (CP) El Niño,[37] "dateline" El Niño (because the anomaly arises near the dateline), or El Niño "Modoki" (Modoki is Japanese for "similar, but different").[39][40][41][42]
The effects of the CP El Niño are different from those of the traditional EP El Niño—e.g., the recently discovered El Niño leads to more hurricanes more frequently making landfall in the Atlantic.[43]
There is also a scientific debate on the very existence of this "new" ENSO. Indeed, a number of studies dispute the reality of this statistical distinction or its increasing occurrence, or both, either arguing the reliable record is too short to detect such a distinction,[44][45] finding no distinction or trend using other statistical approaches,[46][47][48][49][50] or that other types should be distinguished, such as standard and extreme ENSO.[51][52]
The first recorded El Niño that originated in the central Pacific and moved toward the east was in 1986.[53] Recent Central Pacific El Niños happened in 1986–87, 1991–92, 1994–95, 2002–03, 2004–05 and 2009–10.[54] Furthermore, there were "Modoki" events in 1957–59,[55] 1963–64, 1965–66, 1968–70, 1977–78 and 1979–80.[56][57]
Effects on the global climate
El Nino affects the global climate and disrupts normal weather patterns, which as a result can lead to intense storms in some places and droughts in others.[58][59]
Tropical cyclones
Most tropical cyclones form on the side of the subtropical ridge closer to the equator, then move poleward past the ridge axis before recurving into the main belt of the Westerlies.[60] Areas west of Japan and Korea tend to experience much fewer September–November tropical cyclone impacts during El Niño and neutral years. During El Niño years, the break in the subtropical ridge tends to lie near 130°E, which would favor the Japanese archipelago.[61]
Within the Atlantic Ocean vertical wind shear is increased, which inhibits tropical cyclone genesis and intensification, by causing the westerly winds in the atmosphere to be stronger.[62] The atmosphere over the Atlantic ocean can also be drier and more stable during El Niño events, which can also inhibit tropical cyclone genesis and intensification.[62] Within the Eastern Pacific basin: El Niño events contribute to decreased easterly vertical wind shear and favours above-normal hurricane activity.[63] However, the impacts of the ENSO state in this region can vary and are strongly influenced by background climate patterns.[63] The Western Pacific basin experiences a change in the location of where tropical cyclones form during El Niño events, without a major change in how many develop each year.[62] As a result of this change Micronesia is more likely to be affected by several tropical cyclones, while China has a decreased risk of being affected by several tropical cyclones. A change in the location of where tropical cyclones form also occurs within the Southern Pacific Ocean between 135°E and 120°W, with tropical cyclones more likely to occur within the Southern Pacific basin than the Australian region.[8][62] As a result of this change tropical cyclones are 50% less likely to make landfall on Queensland, while the risk of a tropical cyclone is elevated for island nations like Niue, French Polynesia, Tonga, Tuvalu and the Cook Islands.[8][64][65]
Remote influence on tropical Atlantic Ocean
A study of climate records has shown that El Niño events in the equatorial Pacific are generally associated with a warm tropical North Atlantic in the following spring and summer.[66] About half of El Niño events persist sufficiently into the spring months for the Western Hemisphere Warm Pool to become unusually large in summer.[67] Occasionally, El Niño's effect on the Atlantic Walker circulation over South America strengthens the easterly trade winds in the western equatorial Atlantic region. As a result, an unusual cooling may occur in the eastern equatorial Atlantic in spring and summer following El Niño peaks in winter.[68] Cases of El Niño-type events in both oceans simultaneously have been linked to severe famines related to the extended failure of monsoon rains.[20]
Antarctica
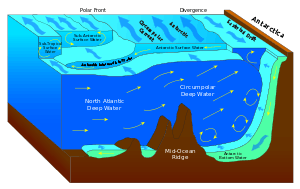
Many ENSO linkages exist in the high southern latitudes around Antarctica.[69] Specifically, El Niño conditions result in high pressure anomalies over the Amundsen and Bellingshausen Seas, causing reduced sea ice and increased poleward heat fluxes in these sectors, as well as the Ross Sea. The Weddell Sea, conversely, tends to become colder with more sea ice during El Niño. The exact opposite heating and atmospheric pressure anomalies occur during La Niña.[70] This pattern of variability is known as the Antarctic dipole mode, although the Antarctic response to ENSO forcing is not ubiquitous.[70]
Regional impacts
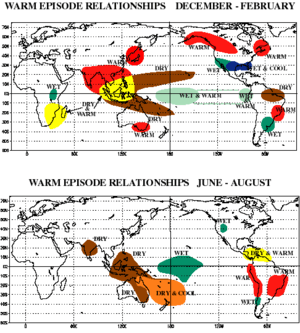
Observations of El Niño events since 1950, show that impacts associated with El Niño events depend on what season it is.[71] However, while certain events and impacts are expected to occur during events, it is not certain or guaranteed that they will occur.[71] The impacts that generally do occur during most El Niño events include below-average rainfall over Indonesia and northern South America, while above average rainfall occurs in southeastern South America, eastern equatorial Africa, and the southern United States.[71]
Australia and the Southern Pacific
During El Niño events, the shift in rainfall away from the Western Pacific, can mean that rainfall across Australia is reduced.[8] Over the southern part of the continent, warmer than average temperatures can be recorded as weather systems are more mobile and fewer blocking areas of high pressure occur.[8] The onset of the Indo-Australian Monsoon in tropical Australia is delayed by two to six weeks, which as a consequence means that rainfall is reduced over the northern tropics.[8] The risk of a significant bushfire season in south-eastern Australia is higher following an El Niño event, especially when it is combined with a positive Indian Ocean Dipole event.[8] During an El Niño event, New Zealand tends to experience stronger or more frequent westerly winds during their summer, which leads to an elevated risk of drier than normal conditions along the east coast.[72] There is more rain than usual though on New Zealand's West Coast, because of the barrier effect of the North Island mountain ranges and the Southern Alps.[72]
Fiji generally experiences drier than normal conditions during an El Niño, which can lead to drought becoming established over the Islands.[73] However, the main impacts on the island nation is felt about a year after the event becomes established.[73] Within the Samoan Islands, below average rainfall and higher than normal temperatures are recorded during El Niño events, which can lead to droughts and forest fires on the islands.[74] Other impacts include a decrease in the sea level, possibility of coral bleaching in the marine environment and an increased risk of a tropical cyclone affecting Samoa.[74]
Africa
In Africa, East Africa — including Kenya, Tanzania, and the White Nile basin — experiences, in the long rains from March to May, wetter-than-normal conditions. Conditions are also drier than normal from December to February in south-central Africa, mainly in Zambia, Zimbabwe, Mozambique, and Botswana.
Asia
As warm water spreads from the west Pacific and the Indian Ocean to the east Pacific, it takes the rain with it, causing extensive drought in the western Pacific and rainfall in the normally dry eastern Pacific. Singapore experienced the driest February in 2014 since records began in 1869, with only 6.3 mm of rain falling in the month and temperatures hitting as high as 35 °C on 26 February. The years 1968 and 2005 had the next driest Februaries, when 8.4 mm of rain fell.[75]
Europe
El Niño's effects on Europe are controversial, complex and difficult to analyse, as it is one of several factors that influence the weather over the continent and other factors can overwhelm the signal.[76][77]
North America
Over North America, the main temperature and precipitation impacts of El Niño, generally occur in the six months between October and March.[78][79] In particular the majority of Canada generally has a milder than normal winters and springs, with the exception of eastern Canada where no significant impacts occur.[80] Within the United States, the impacts generally observed during the six-month period include; wetter-than-average conditions along the Gulf Coast between Texas and Florida, while drier conditions are observed in Hawaii, the Ohio Valley, Pacific Northwest and the Rocky Mountains.[78] Over California and the South-Western United States, there is a weak relationship between El Nino and above-average precipitation, as it strongly depends on the strength of the El Niño event amongst other factors.[78]
The synoptic condition for the Tehuantepecer is associated with high-pressure system forming in Sierra Madre of Mexico in the wake of an advancing cold front, which causes winds to accelerate through the Isthmus of Tehuantepec. Tehuantepecers primarily occur during the cold season months for the region in the wake of cold fronts, between October and February, with a summer maximum in July caused by the westward extension of the Azores High. Wind magnitude is greater during El Niño years than during La Niña years, due to the more frequent cold frontal incursions during El Niño winters.[81] Its effects can last from a few hours to six days.[82]
South America
Because El Niño's warm pool feeds thunderstorms above, it creates increased rainfall across the east-central and eastern Pacific Ocean, including several portions of the South American west coast. The effects of El Niño in South America are direct and stronger than in North America. An El Niño is associated with warm and very wet weather months in April–October along the coasts of northern Peru and Ecuador, causing major flooding whenever the event is strong or extreme.[83] The effects during the months of February, March, and April may become critical. Along the west coast of South America, El Niño reduces the upwelling of cold, nutrient-rich water that sustains large fish populations, which in turn sustain abundant sea birds, whose droppings support the fertilizer industry. The reduction in upwelling leads to fish kills off the shore of Peru.[84]
The local fishing industry along the affected coastline can suffer during long-lasting El Niño events. The world's largest fishery collapsed due to overfishing during the 1972 El Niño Peruvian anchoveta reduction. During the 1982–83 event, jack mackerel and anchoveta populations were reduced, scallops increased in warmer water, but hake followed cooler water down the continental slope, while shrimp and sardines moved southward, so some catches decreased while others increased.[85] Horse mackerel have increased in the region during warm events. Shifting locations and types of fish due to changing conditions provide challenges for fishing industries. Peruvian sardines have moved during El Niño events to Chilean areas. Other conditions provide further complications, such as the government of Chile in 1991 creating restrictions on the fishing areas for self-employed fishermen and industrial fleets.
The ENSO variability may contribute to the great success of small, fast-growing species along the Peruvian coast, as periods of low population removes predators in the area. Similar effects benefit migratory birds that travel each spring from predator-rich tropical areas to distant winter-stressed nesting areas.
Southern Brazil and northern Argentina also experience wetter than normal conditions, but mainly during the spring and early summer. Central Chile receives a mild winter with large rainfall, and the Peruvian-Bolivian Altiplano is sometimes exposed to unusual winter snowfall events. Drier and hotter weather occurs in parts of the Amazon River Basin, Colombia, and Central America.
Effects on humanity
Economic effect
When El Niño conditions last for many months, extensive ocean warming and the reduction in easterly trade winds limits upwelling of cold nutrient-rich deep water, and its economic effect on local fishing for an international market can be serious.[84]
More generally, El Niño can affect commodity prices and the macroeconomy of different countries. It can constrain the supply of rain-driven agricultural commodities; reduce agricultural output, construction, and services activities; create food-price and generalised inflation; and may trigger social unrest in commodity-dependent poor countries that primarily rely on imported food.[86] A University of Cambridge Working Paper shows that while Australia, Chile, Indonesia, India, Japan, New Zealand and South Africa face a short-lived fall in economic activity in response to an El Niño shock, other countries may actually benefit from an El Niño weather shock (either directly or indirectly through positive spillovers from major trading partners), for instance, Argentina, Canada, Mexico and the United States. Furthermore, most countries experience short-run inflationary pressures following an El Niño shock, while global energy and non-fuel commodity prices increase.[87] The IMF estimates a significant El Niño can boost the GDP of the United States by about 0.5% (due largely to lower heating bills) and reduce the GDP of Indonesia by about 1.0%.[88]
Health and social effects
Extreme weather conditions related to the El Niño cycle correlate with changes in the incidence of epidemic diseases. For example, the El Niño cycle is associated with increased risks of some of the diseases transmitted by mosquitoes, such as malaria, dengue, and Rift Valley fever. Cycles of malaria in India, Venezuela, Brazil, and Colombia have now been linked to El Niño. Outbreaks of another mosquito-transmitted disease, Australian encephalitis (Murray Valley encephalitis—MVE), occur in temperate south-east Australia after heavy rainfall and flooding, which are associated with La Niña events. A severe outbreak of Rift Valley fever occurred after extreme rainfall in north-eastern Kenya and southern Somalia during the 1997–98 El Niño.[89]
ENSO conditions have also been related to Kawasaki disease incidence in Japan and the west coast of the United States,[90] via the linkage to tropospheric winds across the north Pacific Ocean.[91]
ENSO may be linked to civil conflicts. Scientists at The Earth Institute of Columbia University, having analyzed data from 1950 to 2004, suggest ENSO may have had a role in 21% of all civil conflicts since 1950, with the risk of annual civil conflict doubling from 3% to 6% in countries affected by ENSO during El Niño years relative to La Niña years.[92][93]
References
- ↑ "Independent NASA Satellite Measurements Confirm El Niño is Back and Strong". NASA/JPL.
- ↑ Climate Prediction Center (19 December 2005). "Frequently Asked Questions about El Niño and La Niña". National Centers for Environmental Prediction. Retrieved 17 July 2009.
- ↑ K.E. Trenberth; P.D. Jones; P. Ambenje; R. Bojariu; D. Easterling; A. Klein Tank; D. Parker; F. Rahimzadeh; J.A. Renwick; M. Rusticucci; B. Soden; P. Zhai. "Observations: Surface and Atmospheric Climate Change". In Solomon, S., D. Qin, M. Manning, Z. Chen, M. Marquis, K.B. Averyt, M. Tignor and H.L. Miller. Climate Change 2007: The Physical Science Basis. Contribution of Working Group I to the Fourth Assessment Report of the Intergovernmental Panel on Climate Change. Cambridge, UK: Cambridge University Press. pp. 235–336.
- ↑ "El Niño Information". California Department of Fish and Game, Marine Region.
- ↑ Trenberth, Kevin E (December 1997). "The Definition of El Niño". Bulletin of the American Meteorological Society. 78 (12): 2771–2777. Bibcode:1997BAMS...78.2771T. doi:10.1175/1520-0477(1997)078<2771:TDOENO>2.0.CO;2.
- ↑ "Australian Climate Influences: El Niño". Australian Bureau of Meteorology. Retrieved 4 April 2016.
- 1 2 L'Heureux, Michelle (5 May 2014). "What is the El Niño–Southern Oscillation (ENSO) in a nutshell?". ENSO Blog. Archived from the original on 10 April 2016.
- 1 2 3 4 5 6 7 "What is El Niño and what might it mean for Australia?". Australian Bureau of Meteorology. Archived from the original on 10 April 2016. Retrieved 10 April 2016.
- 1 2 3 4 "El Nino here to stay". BBC News. November 7, 1997. Retrieved 1 May 2010.
- 1 2 "El Niño 2016". Atavist.
- 1 2 3 4 "Historical El Niño/La Niña episodes (1950-present)". United States Climate Prediction Center. 4 November 2015. Retrieved 10 January 2015.
- 1 2 3 "El Niño - Detailed Australian Analysis". Australian Bureau of Meteorology. Retrieved 3 April 2016.
- ↑ http://www.bom.gov.au/climate/enso/images/El-Nino-in-Australia.pdf
- ↑ Becker, Emily (4 December 2014). "December's ENSO Update: Close, but no cigar". ENSO Blog. Archived from the original on 4 April 2016.
- ↑ "ENSO Tracker: About ENSO and the Tracker". Australian Bureau of Meteorology. Retrieved 4 April 2016.
- ↑ Becker, Emily (27 May 2014). "How will we know when an El Niño has arrived?". ENSO Blog. Archived from the original on 7 April 2016.
- ↑ "Historical El Niño and La Niña Events". Japan Meteorological Agency. Retrieved 4 April 2016.
- 1 2 Di Liberto, Tom (11 September 2014). "ENSO + Climate Change = Headache". ENSO Blog. Archived from the original on 7 April 2016.
- 1 2 Collins, Mat; An, Soon-Il; Cai, Wenju; Ganachaud, Alexandre; Guilyardi, Eric; Jin, Fei-Fei; Jochum, Markus; Lengaigne, Matthieu; Power, Scott; Timmermann, Axel; Vecchi, Gabe; Wittenberg, Andrew (23 May 2010). "The impact of global warming on the tropical Pacific Ocean and El Niño". Nature Geoscience. 3 (6): 391–397. Bibcode:2010NatGe...3..391C. doi:10.1038/ngeo868.
- 1 2 Davis, Mike (2001). Late Victorian Holocausts: El Niño Famines and the Making of the Third World. London: Verso. p. 271. ISBN 1-85984-739-0.
- ↑ "Very strong 1997-98 Pacific warm episode (El Niño)". Retrieved 28 July 2015.
- ↑ Climate Prediction Center (19 December 2005). "ENSO FAQ: How often do El Niño and La Niña typically occur?". National Centers for Environmental Prediction. Retrieved 26 July 2009.
- ↑ National Climatic Data Center (June 2009). "El Niño / Southern Oscillation (ENSO) June 2009". National Oceanic and Atmospheric Administration. Retrieved 26 July 2009.
- ↑ Kim, WonMoo; Wenju Cai (2013). "Second peak in the far eastern Pacific sea surface temperature anomaly following strong El Niño events". Geophys. Res. Lett. 40 (17): n/a. Bibcode:2013GeoRL..40.4751K. doi:10.1002/grl.50697 (inactive 2015-01-12).
- ↑ Carrè, Matthieu; et al. (2005). "Strong El Niño events during the early Holocene: stable isotope evidence from Peruvian sea shells". The Holocene. 15 (1): 42–7. doi:10.1191/0959683605h1782rp.
- ↑ Brian Fagan (1999). Floods, Famines and Emporers: El Niño and the Fate of Civilizations. Basic Books. pp. 119–138. ISBN 0-465-01120-9.
- ↑ Grove, Richard H. (1998). "Global Impact of the 1789–93 El Niño". Nature. 393 (6683): 318–9. Bibcode:1998Natur.393..318G. doi:10.1038/30636.
- ↑ Ó Gráda, C. (2009). "Ch. 1: The Third Horseman". Famine: A Short History. Princeton University Press. ISBN 9780691147970.
- ↑ "Dimensions of need - People and populations at risk". Fao.org. Retrieved 28 July 2015.
- ↑ Cushman, Gregory T. "Who Discovered the El Niño-Southern Oscillation?". Presidential Symposium on the History of the Atmospheric Sciences: People, Discoveries, and Technologies. American Meteorological Society (AMS). Retrieved 18 December 2015.
- ↑ Trenberth, Kevin E.; Hoar, Timothy J. (January 1996). "The 1990–1995 El Niño–Southern Oscillation event: Longest on record". Geophysical Research Letters. 23 (1): 57–60. Bibcode:1996GeoRL..23...57T. doi:10.1029/95GL03602.
- ↑ Trenberth, K. E.; et al. (2002). "Evolution of El Niño – Southern Oscillation and global atmospheric surface temperatures". Journal of Geophysical Research. 107 (D8): 4065. Bibcode:2002JGRD..107.4065T. doi:10.1029/2000JD000298 (inactive 2015-01-12).
- ↑ Marshall, Paul; Schuttenberg, Heidi (2006). A reef manager's guide to coral bleaching. Townsville, Qld.: Great Barrier Reef Marine Park Authority. ISBN 1-876945-40-0.
- ↑ Trenberth, Kevin E; Stepaniak, David P (April 2001). "Indices of El Niño Evolution". Journal of Climate. 14 (8): 1697–1701. Bibcode:2001JCli...14.1697T. doi:10.1175/1520-0442(2001)014<1697:LIOENO>2.0.CO;2.
- ↑ Johnson, Nathaniel C (July 2013). "How Many ENSO Flavors Can We Distinguish?*". Journal of Climate. 26 (13): 4816–4827. doi:10.1175/JCLI-D-12-00649.1.
- 1 2 3 4 5 L'Heureux, Michelle (16 October 2014). "ENSO Flavor of the Month". ENSO Blog. Archived from the original on 11 April 2016.
- 1 2 Kao, Hsun-Ying; Jin-Yi Yu (2009). "Contrasting Eastern-Pacific and Central-Pacific Types of ENSO". J. Climate. 22 (3): 615–632. Bibcode:2009JCli...22..615K. doi:10.1175/2008JCLI2309.1.
- ↑ Larkin, N. K.; Harrison, D. E. (2005). "On the definition of El Niño and associated seasonal average U.S. Weather anomalies". Geophysical Research Letters. 32 (13): L13705. Bibcode:2005GeoRL..3213705L. doi:10.1029/2005GL022738.
- ↑ Ashok, K.; S. K. Behera; S. A. Rao; H. Weng & T. Yamagata (2007). "El Nino Modoki and its possible teleconnection". Journal of Geophysical Research. J. Geophys. Res. 112: C11007. Bibcode:2007JGRC..11211007A. doi:10.1029/2006JC003798.
- ↑ Weng, H.; K. Ashok; S. K. Behera; S. A. Rao & T. Yamagata (2007). "Impacts of recent El Nino Modoki on dry/wet condidions in the Pacific rim during boreal summer". Clim. Dyn. 29 (2–3): 113–129. Bibcode:2007ClDy...29..113W. doi:10.1007/s00382-007-0234-0 (inactive 2015-01-12).
- ↑ Ashok, K.; T. Yamagata (2009). "The El Nino with a difference". Nature. 461 (7263): 481–484. Bibcode:2009Natur.461..481A. doi:10.1038/461481a.
- ↑ Michele Marra (1 January 2002). Modern Japanese Aesthetics: A Reader. University of Hawaii Press. ISBN 978-0-8248-2077-0.
- ↑ Hye-Mi Kim; Peter J. Webster; Judith A. Curry (2009). "Impact of Shifting Patterns of Pacific Ocean Warming on North Atlantic Tropical Cyclones". Science. 335 (5936): 77–80. Bibcode:2009Sci...325...77K. doi:10.1126/science.1174062. PMID 19574388.
- ↑ Nicholls, N. (2008). "Recent trends in the seasonal and temporal behaviour of the El Niño Southern Oscillation". Geophys. Res. Lett. 35 (19): L19703. Bibcode:2008GeoRL..3519703N. doi:10.1029/2008GL034499.
- ↑ McPhaden, M.J.; Lee, T.; McClurg, D. (2011). "El Niño and its relationship to changing background conditions in the tropical Pacific Ocean". Geophys. Res. Lett. 38 (15): L15709. Bibcode:2011GeoRL..3815709M. doi:10.1029/2011GL048275.
- ↑ Giese, B.S.; Ray, S. (2011). "El Niño variability in simple ocean data assimilation (SODA), 1871–2008". J. Geophys. Res. 116: C02024. Bibcode:2011JGRC..116.2024G. doi:10.1029/2010JC006695.
- ↑ Newman, M.; Shin, S.-I.; Alexander, M.A. (2011). "Natural variation in ENSO flavors". Geophys. Res. Lett. 38 (14): L14705. Bibcode:2011GeoRL..3814705N. doi:10.1029/2011GL047658.
- ↑ Yeh, S.‐W.; Kirtman, B.P.; Kug, J.‐S.; Park, W.; Latif, M. (2011). "Natural variability of the central Pacific El Niño event on multi‐centennial timescales". Geophys. Res. Lett. 38 (2): L02704. Bibcode:2011GeoRL..38.2704Y. doi:10.1029/2010GL045886.
- ↑ Hanna Na; Bong-Geun Jang; Won-Moon Choi; Kwang-Yul Kim (2011). "Statistical simulations of the future 50-year statistics of cold-tongue El Niño and warm-pool El Niño". Asia-Pacific J. Atmos. Sci. 47 (3): 223–233. Bibcode:2011APJAS..47..223N. doi:10.1007/s13143-011-0011-1.
- ↑ L'Heureux, M.; Collins, D.; Hu, Z.-Z. (2012). "Linear trends in sea surface temperature of the tropical Pacific Ocean and implications for the El Niño-Southern Oscillation". Climate Dynamics. 40 (5–6): 1–14. Bibcode:2013ClDy...40.1223L. doi:10.1007/s00382-012-1331-2.
- ↑ Lengaigne, M.; Vecchi, G. (2010). "Contrasting the termination of moderate and extreme El Niño events in coupled general circulation models". Climate Dynamics. 35 (2–3): 299–313. Bibcode:2010ClDy...35..299L. doi:10.1007/s00382-009-0562-3.
- ↑ Takahashi, K.; Montecinos, A.; Goubanova, K.; Dewitte, B. (2011). "ENSO regimes: Reinterpreting the canonical and Modoki El Niño". Geophys. Res. Lett. 38 (10): L10704. Bibcode:2011GeoRL..3810704T. doi:10.1029/2011GL047364.
- ↑ S. George Philander (2004). Our Affair with El Niño: How We Transformed an Enchanting Peruvian Current Into a Global Climate Hazard. ISBN 978-0-691-11335-7.
- ↑ "Study Finds El Ninos are Growing Stronger". NASA. Retrieved 3 August 2014.
- ↑ "Reinterpreting the Canonical and Modoki El Nino". Wiley Online Library. doi:10.1029/2011GL047364. Retrieved 3 August 2014.
- ↑ Different Impacts of Various El Niño Events (PDF) (Report). NOAA.
- ↑ Central Pacific El Nino on US Winters (Report). IOP Science. Retrieved 3 August 2014..
- ↑ "El Niño and La Niña". New Zealand's National Institute of Water and Atmospheric Research. Archived from the original on 11 April 2016. Retrieved 11 April 2016.
- ↑ Emily Becker. "How Much Do El Niño and La Niña Affect Our Weather? This fickle and influential climate pattern often gets blamed for extreme weather. A closer look at the most recent cycle shows that the truth is more subtle". scientificamerican.com. Scientific American. Retrieved October 4, 2016.
- ↑ Joint Typhoon Warning Center (2006). "3.3 JTWC Forecasting Philosophies" (pdf). Retrieved 11 February 2007.
- ↑ Wu, M. C.; Chang, W. L.; Leung, W. M. (2003). "Impacts of El Niño–Southern Oscillation Events on Tropical Cyclone Landfalling Activity in the Western North Pacific". Journal of Climate. 17: 1419–28. Bibcode:2004JCli...17.1419W. doi:10.1175/1520-0442(2004)017<1419:ioenoe>2.0.co;2. Retrieved 11 February 2007.
- 1 2 3 4 Landsea, Christopher W; Dorst, Neal M (June 1, 2014). "Subject: G2) How does El Niño-Southern Oscillation affect tropical cyclone activity around the globe?". Tropical Cyclone Frequently Asked Question. United States National Oceanic and Atmospheric Administration's Hurricane Research Division. Archived from the original on April 11, 2016. Retrieved April 11, 2016.
- 1 2 "Background Information: East Pacific Hurricane Outlook". United States Climate Prediction Center. 27 May 2015. Retrieved 7 April 2016.
- ↑ "Southwest Pacific Tropical Cyclone Outlook: El Niño expected to produce severe tropical storms in the Southwest Pacific" (Press release). New Zealand National Institute of Water and Atmospheric Research. 14 October 2015. Archived from the original on 16 October 2015. Retrieved October 22, 2014.
- ↑ "El Nino is here!" (Press release). Tonga Ministry of Information and Communications. 11 November 2015. Archived from the original on 8 May 2016. Retrieved May 8, 2016.
- ↑ Enfield, David B.; Mayer, Dennis A. (1997). "Tropical Atlantic sea surface temperature variability and its relation to El Niño–Southern Oscillation". Journal of Geophysical Research. 102 (C1): 929–945. Bibcode:1997JGR...102..929E. doi:10.1029/96JC03296.
- ↑ Lee, Sang-Ki, Chunzai Wang and David B. Enfield (2008). "Why do some El Niños have no impact on tropical North Atlantic SST?". Geophysical Research Letters. 35 (L16705): L16705. Bibcode:2008GeoRL..3516705L. doi:10.1029/2008GL034734 (inactive 2015-01-12). Retrieved 15 January 2014.
- ↑ Latif, M.; GröTzner, A. (2000). "The equatorial Atlantic oscillation and its response to ENSO". Climate Dynamics. 16 (2–3): 213–218. Bibcode:2000ClDy...16..213L. doi:10.1007/s003820050014 (inactive 2015-01-12).
- ↑ Turner, John (2004). "The El Niño–Southern Oscillation and Antarctica". International Journal of Climatology. 24: 1–31. Bibcode:2004IJCli..24....1T. doi:10.1002/joc.965 (inactive 2015-01-12).
- 1 2 Yuan, Xiaojun (2004). "ENSO-related impacts on Antarctic sea ice: a synthesis of phenomenon and mechanisms". Antarctic Science. 16 (4): 415–425. doi:10.1017/S0954102004002238.
- 1 2 3 Barnston, Anthony (19 May 2014). "How ENSO leads to a cascade of global impacts". ENSO Blog. Archived from the original on 5 May 2016.
- 1 2 "El Niño's impacts on New Zealand's climate". New Zealand's National Institute of Water and Atmospheric Research. Archived from the original on 11 April 2016. Retrieved 11 April 2016.
- 1 2 http://www.webcitation.org/6hLuLcnB7?url=http%3A%2F%2Fwww.met.gov.fj%2FENSO_Update.pdf
- 1 2 http://www.samet.gov.ws/images/Climate_Services/CS/CSJAN2016.pdf
- ↑
- ↑ "What are the prospects for the weather in the coming winter?". Met Office News Blog. United Kingdom Met Office. 29 October 2015. Archived from the original on 11 April 2016.
- ↑ Ineson, S.; Scaife, A. A. (7 December 2008). "The role of the stratosphere in the European climate response to El Niño". Nature Geoscience. 2 (1): 32–36. Bibcode:2009NatGe...2...32I. doi:10.1038/ngeo381.
- 1 2 3 Halpert, Mike (12 June 2014). "United States El Niño Impacts". ENSO Blog. Archived from the original on 5 May 2016.
- ↑ Barnston, Anthony (12 June 2014). "With El Niño likely, what climate impacts are favored for this summer?". ENSO Blog. Archived from the original on 6 May 2016.
- ↑ "El Niño: What are the El Niño impacts in Canada?". Environment and Climate Change Canada. December 2, 2015. Archived from the original on April 11, 2016.
- ↑ Rosario Romero-Centeno; Jorge Zavala-Hidalgo; Artemio Gallegos; James J. O’Brien (August 2003). "Isthmus of Tehuantepec wind climatology and ENSO signal". Journal of Climate. 16 (15): 2628–2639. Bibcode:2003JCli...16.2628R. doi:10.1175/1520-0442(2003)016<2628:IOTWCA>2.0.CO;2.
- ↑ Paul A. Arnerich. "Tehuantepecer Winds of the West Coast of Mexico". Mariners Weather Log. National Oceanic and Atmospheric Administration. 15 (2): 63–67.
- ↑ "Atmospheric Consequences of El Niño". University of Illinois. Retrieved 31 May 2010.
- 1 2 WW2010 (28 April 1998). "El Niño". University of Illinois at Urbana-Champaign. Retrieved 17 July 2009.
- ↑ Pearcy, W. G.; Schoener, A. (1987). "Changes in the marine biota coincident with the 1982-1983 El Niño in the northeastern subarctic Pacific Ocean". Journal of Geophysical Research. 92 (C13): 14417–28. Bibcode:1987JGR....9214417P. doi:10.1029/JC092iC13p14417.
- ↑ "Study reveals economic impact of El Niño". University of Cambridge. 11 July 2014. Retrieved 25 July 2014.
- ↑ Cashin, Paul; Mohaddes, Kamiar & Raissi, Mehdi (2014). "Fair Weather or Foul? The Macroeconomic Effects of El Niño" (PDF). Cambridge Working Papers in Economics.
- ↑ "Fair Weather or Foul? The Macroeconomic Effects of El Niño".
- ↑ "El Niño and its health impact". Health Topics A to Z. Retrieved 1 January 2011.
- ↑ Ballester, Joan; Jane C. Burns; Dan Cayan; Yosikazu Nakamura; Ritei Uehara; Xavier Rodó (2013). "Kawasaki disease and ENSO-driven wind circulation". Geophysical Research Letters. 40 (10): 2284–2289. Bibcode:2013GeoRL..40.2284B. doi:10.1002/grl.50388.
- ↑ Rodó, Xavier; Joan Ballester; Dan Cayan; Marian E. Melish; Yoshikazu Nakamura; Ritei Uehara; Jane C. Burns (10 November 2011). "Association of Kawasaki disease with tropospheric wind patterns". Scientific Reports. 1: 152. Bibcode:2011NatSR...1E.152R. doi:10.1038/srep00152. ISSN 2045-2322. PMC 3240972
 . PMID 22355668.
 - ↑ Hsiang, S. M. , Meng, K. C. & Cane, M. A.; Meng; Cane (2011). "Civil conflicts are associated with the global climate". Nature. 476 (7361): 438–441. Bibcode:2011Natur.476..438H. doi:10.1038/nature10311. PMID 21866157.
- ↑ Quirin Schiermeier (2011). "Climate cycles drive civil war". Nature. 476: 406–407. doi:10.1038/news.2011.501.
Further reading
- Caviedes, César N. (2001). El Niño in History: Storming Through the Ages. Gainesville: University of Florida Press. ISBN 0-8130-2099-9.
- Fagan, Brian M. (1999). Floods, Famines, and Emperors: El Niño and the Fate of Civilizations. New York: Basic Books. ISBN 0-7126-6478-5.
- Glantz, Michael H. (2001). Currents of change. Cambridge: Cambridge University Press. ISBN 0-521-78672-X.
- Philander, S. George (1990). El Niño, La Niña and the Southern Oscillation. San Diego: Academic Press. ISBN 0-12-553235-0.
- Kuenzer, C.; Zhao, D.; Scipal, K.; Sabel, D.; Naeimi, V.; Bartalis, Z.; Hasenauer, S.; Mehl, H.; Dech, S.; Waganer, W. (2009). "El Niño southern oscillation influences represented in ERS scatterometer-derived soil moisture data". Applied Geography. 29 (4): 463–477. doi:10.1016/j.apgeog.2009.04.004.
- Li, J.; Xie, S.-P.; Cook, E.R.; Morales, M.; Christie, D.; Johnson, N.; Chen, F.; d’Arrigo, R.; Fowler, A.; Gou, X.; Fang, K. (2013). "El Niño modulations over the past seven centuries". Nature Climate Change. 3 (9): 822–826. Bibcode:2013NatCC...3..822L. doi:10.1038/nclimate1936.
External links
| Wikimedia Commons has media related to ENSO. |
- NOAA El Niño & La Niña (El Niño-Southern Oscillation)
- FAO response to El Niño
- Latest El Niño/La Niña Watch Data from NASA JPL's Ocean Surface Topography Mission
- El Niño and La Niña from the 1999 International Red Cross World Disasters Report by Eric J. Lyman.
- Ocean Motion: El Niño
- What is El Niño?
- Kelvin Wave Renews El Niño — NASA, Earth Observatory image of the day, 2010, 21 March