Standard of living in the United States


The standard of living in the United States is high by the standards that most economists use, and for many decades throughout the 20th century, the United States was recognized as having the highest standard of living in the world. Per capita income is high but also less evenly distributed than in most other developed countries; as a result, the United States fares particularly well in measures of average material well being that do not place weight on equality aspects.
Measures
On the United Nations Human Development Index, which measures health, education, and per capita income levels, the United States is relatively high, currently ranking 8th. However, the Human Development Index is not considered a measure of living standards, but a measure of potential living standards were there no inequality: rather, the inequality-adjusted Human Development Index is considered the actual level of human development, taking inequality into account. On the inequality-adjusted HDI, the United States ranked 27th in 2014, tied with Poland.[4]
In 2013, the Economist Intelligence Unit's Where-to-be-born Index, which takes into account material well-being as measured by GDP per capita, life expectancy, political stability, the quality of family life based on divorce rates, community life, crime and terrorism rates, gender equality, the quality of governance, climate, and unemployment rates, ranked the United States at 16th place, tied with Germany.[5]
The OECD Better Life Index, which measures quality of life according to 11 factors, ranks the United States as 7th among 34 OECD countries.
The homeownership rate is relatively high compared to other post-industrial nations. In 2005, 69% of Americans resided in their own homes, roughly the same percentage as in the United Kingdom, Belgium, Israel and Canada.[6][7][8] In 2007, Americans enjoyed more cars and radios per capita than any other nation[9] and more televisions and personal computers per capita than any other nation with more than 200 million people.[10][11]
Change over time
In colonial America, the standard of living was high by 18th century standards. Americans could choose their diet from a diverse range of plants and animals from Europe and the Western Hemisphere, and this, combined with favorable weather conditions, ensured that Americans never had to deal with harvest failures. There was little exposure to epidemic diseases, and low wealth inequality, ensuring that even the poor were well-fed.
Historians have used height to measure living standards during this time as average adult heights can point to a population's net nutrition - the amount of nutrition people grew up with as compared to biological stress which can cause lower heights in adulthood, stemming from things like food deprivation, hard work, and disease. According to military records of American and European men, Americans were on average two to three inches taller than Europeans.
Average heights showed little change until the second quarter of the 19th century, with the Industrial Revolution. The growth of canals, steamboats, and railways, as well as the public school system, mass immigration, and urbanization, increased exposure to diseases. Food prices rose in the 1830s, and industrialization brought along with it growing wealth inequality and business depressions that further worsened the situations of the poor. As a result, average stature and life expectancy declined, and only rebounded from 1910 to 1950, as incomes rose, urban conditions became less crowded, and public health measures were put in place.[12]
From the 1930s up until 1980, the average American after-tax income adjusted for inflation tripled,[13] which translated into higher living standards for the American population.[14][15][16][17][18][19][19][20][21][22][23][24][25][26][27][28][29][30][31][32] Between 1949 and 1969, real median family income grew by 99.3%.[33] From 1946 to 1978, the standard of living for the average family more than doubled.[34] Average family income (in real terms) more than doubled from 1945 up until the 1970s, while unemployment steadily fell until it reached 4% in the 1960s.[35] Between 1949-50 and 1965–66, median family income (in constant 2009 dollars) rose from $25,814 to $43,614,[36] and from 1947 to 1960, consumer spending rose by a full 60%, and for the first time, as noted by Mary P. Ryan, "the majority of Americans would enjoy something called discretionary income, earnings that were secure and substantial enough to permit them to enter sectors of the marketplace that were once reserved for the affluent."[37] In 1960, Americans were, on average, the richest people in the world by a massive margin.[38]
During the 1960s, median family incomes increased by over 33%, while per capita expenditures on recreation and meals grew by over 40%. From 1959 to 1969, median family income (in 1984 dollars) increased from $19,300 to $26,700.[39] By 1969, 79.6% of all households owned at least one car, 82.6% owned a refrigerator or freezer, 79% owned a black and white television set, 31.9% owned a color television set, and 70% owned a washing machine.[40] Leisure time also increased. By 1970, it was estimated that the average workingman in America had 140 days off work each year.[41] US work hours fell by 10.7% between 1950 and 1979, though the decline was still around half that of Western Europe.
In 1980, the American standard of living was the highest among the industrial countries, according to the OECD. Out of the 85 million households in the United States, 64% owned their own living quarters, 55% had at least two TV sets, and 51% had more than one vehicle. In terms of possession of telephones, TV sets, school enrollments, animal protein in diets, and energy consumption, the United States was far ahead of other industrialized countries.[42] Wealthy and middle class and a majority of poor Americans had higher after-tax incomes than their counterparts almost anywhere else in the world.[38][43] By 1985, the US per capita income was $11,727, one of the highest among industrialized countries. By the mid-1980s, 98% of all households had a telephone service, 77% a washing machine, 45% a freezer, and 43% a dishwasher.[44]
In the 1990s, the average American standard of living was regarded as amongst the highest in the world, and middle class and poor Americans were still, on average, richer than their counterparts in almost all other countries, though the gap with some European countries had noticeably narrowed.[38][45]
Current
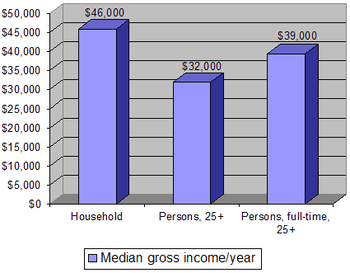
In 2006, median income was $43,318 per household ($26,000 per household member)[1] with 42% of households having two income earners.[46] Meanwhile, the median income of the average American age 25+ was roughly $32,000[2] ($39,000 if only counting those employed full-time between the ages of 25 to 64) in 2005.[3] According to the CIA the gini index which measures income inequality (the higher the less equal the income distribution) was clocked at 45.0 in 2005,[47] compared to 32.0 in the European Union[48] and 28.3 in Germany.[49]
The US has... a per capita GDP [PPP] of $42,000... The [recent] onrush of technology largely explains the gradual development of a "two-tier labor market"... Since 1975, practically all the gains in household income have gone to the top 20% of households... The rise in GDP in 2004 and 2005 was undergirded by substantial gains in labor productivity... Long-term problems include inadequate investment in economic infrastructure, rapidly rising medical and pension costs of an aging population, sizable trade and budget deficits, and stagnation of family income in the lower economic groups.[47]
In 2014, median wealth in the United States was $44,900, which put the United States in 19th place, behind many other developed countries.[50]
The United States has one of the widest rich-poor gaps of any high-income nation today, and that gap continues to grow.[51] Some prominent economists have warned that the widening rich-poor gap in the U.S. population is a problem that could undermine and destabilize the country's economy and standard of living. In 2006, Alan Greenspan wrote that "The income gap between the rich and the rest of the US population has become so wide, and is growing so fast, that it might eventually threaten the stability of democratic capitalism itself".[52] In 2013, George Friedman, the head of Stratfor, wrote that the middle class' standard of living was declining, and that "If we move to a system where half of the country is either stagnant or losing ground while the other half is surging, the social fabric of the United States is at risk, and with it the massive global power the United States has accumulated."[53]
| Country | Austria | Belgium | Denmark | France | Ireland | Norway | Spain | Portugal | UK | United States | Israel | Canada | Russia |
|---|---|---|---|---|---|---|---|---|---|---|---|---|---|
| Homeownership rate[6] | 56% | 71% | 51% | 55% | 42% | 77% | 77% | 85% | 64% | 69% | 69% | 68%[54] | 72% |
International rankings
| Index | Rank |
|---|---|
| Human Development Index | 8th out of 188 |
| GDP (PPP) per capita | 7th out of 183 |
| GDP (nominal) per capita | 9th out of 183 |
| Quality-of-life Index | 16th out of 111 |
| Human Poverty Index | 17th out of 19 |
Social class
Standard of living in the United States varies considerably with socio-economic status. The table below gives a summarization of prominent academic theories on the socio-economic stratification of the United States:
| Dennis Gilbert, 2002 | William Thompson & Joseph Hickey, 2005 | Leonard Beeghley, 2004 | |||
|---|---|---|---|---|---|
| Class | Typical characteristics | Class | Typical characteristics | Class | Typical characteristics |
| Capitalist class (1%) | Top-level executives, high-rung politicians, heirs. Ivy League education common. | Upper class (1%) | Top-level executives, celebrities, heirs; income of $500,000+ common. Ivy league education common. | The super-rich (0.9%) | Multi-millionaires whose incomes commonly exceed $350,000; includes celebrities and powerful executives/politicians. Ivy League education common. |
| Upper middle class[1] (15%) | Highly-educated (often with graduate degrees), most commonly salaried, professionals and middle management with large work autonomy. | Upper middle class[1] (15%) | Highly-educated (often with graduate degrees) professionals & managers with household incomes varying from the high 5-figure range to commonly above $100,000. | The rich (5%) | Households with net worth of $1 million or more; largely in the form of home equity. Generally have college degrees. |
| Middle class (plurality/ majority?; ca. 46%) |
College-educated workers with considerably higher-than-average incomes and compensation; a man making $57,000 and a woman making $40,000 may be typical. | ||||
| Lower middle class (30%) | Semi-professionals and craftsmen with a roughly average standard of living. Most have some college education and are white-collar. | Lower middle class (32%) | Semi-professionals and craftsmen with some work autonomy; household incomes commonly range from $35,000 to $75,000. Typically, some college education. | ||
| Working class (30%) | Clerical and most blue-collar workers whose work is highly routinized. Standard of living varies depending on number of income earners, but is commonly just adequate. High school education. | ||||
| Working class (32%) | Clerical, pink- and blue-collar workers with often low job security; common household incomes range from $16,000 to $30,000. High school education. | Working class (ca. 40–45%) |
Blue-collar workers and those whose jobs are highly routinized with low economic security; a man making $40,000 and a woman making $26,000 may be typical. High school education. | ||
| Working poor (13%) | Service, low-rung clerical and some blue-collar workers. High economic insecurity and risk of poverty. Some high school education. | ||||
| Lower class (ca. 14–20%) | Those who occupy poorly-paid positions or rely on government transfers. Some high school education. | ||||
| Underclass (12%) | Those with limited or no participation in the labor force. Reliant on government transfers. Some high school education. | The poor (ca. 12%) | Those living below the poverty line with limited to no participation in the labor force; a household income of $18,000 may be typical. Some high school education. | ||
Thompson, W. & Hickey, J. (2005). Society in Focus. Boston, MA: Pearson, Allyn & Bacon; Beeghley, L. (2004). The Structure of Social Stratification in the United States. Boston, MA: Pearson, Allyn & Bacon.
| |||||
See also
- Affluence in the United States
- Poverty in the United States
- Personal income in the United States
- Household income in the United States
- Federal assistance in the United States
- Male-female income disparity in the USA
- Social class in the United States
General:
- Gross domestic product
- International ranking of household income
- Economy of the United States
- Human Development Index
References
- 1 2 "US Census Bureau news release in regards to median income". Archived from the original on June 27, 2006. Retrieved June 29, 2006.
- 1 2 "US Census Bureau, personal income distribution, age 25+, 2006". Retrieved December 28, 2006.
- 1 2 "US Census Bureau, income distribution of individuals, employed full-time, year round, age 25–64, 2006". Retrieved December 27, 2006.
- ↑ http://hdr.undp.org/en/composite/IHDI
- ↑ http://www.economist.com/blogs/graphicdetail/2013/01/daily-chart
- 1 2 "EU homeownership rates, 2002" (PDF). Retrieved February 15, 2007.
- ↑ "OWNED DWELLINGS, Israel" (PDF). Retrieved April 17, 2007.
- ↑ "Home Ownership Rate Soars in Canada". Retrieved April 17, 2007.
- ↑ "Median radios per capita". Retrieved February 15, 2007.
- ↑ "Median TVs per capita". Retrieved February 15, 2007.
- ↑ "Median PCs per capita". Retrieved February 15, 2007.
- ↑ https://eh.net/encyclopedia/a-history-of-the-standard-of-living-in-the-united-states/
- ↑ "Sarasota Herald-Tribune - Google News Archive Search". News.google.com. Retrieved October 18, 2014.
- ↑ https://books.google.com/books?id=lE7qfwqB2t0C&pg=PA157. Retrieved October 18, 2014. Missing or empty
|title=(help) - ↑ https://books.google.com/books?id=fDMsb-kg9yYC&pg=PA275. Retrieved October 18, 2014. Missing or empty
|title=(help) - ↑ American Workers, American Unions. Retrieved October 18, 2014.
- ↑ Money income and poverty status in the United State. Retrieved October 18, 2014.
- ↑ Economic Forces in the United States in Facts and Figures. Retrieved October 18, 2014.
- 1 2 "The Declining Middle". Theatlantic.com. Retrieved October 18, 2014.
- ↑ in the United States https://books.google.com/books?id=40Zv8DC4g38C&pg=PA719title=Poverty in the United States Check
|url=value (help). Retrieved October 18, 2014. Missing or empty|title=(help) - ↑ Daily Life in the United States, 1960-1990. Retrieved October 18, 2014.
- ↑ Archived December 17, 2013, at the Wayback Machine.
- ↑ US Economic History Since 1945. Retrieved October 18, 2014.
- ↑ Everyday Fashions of the Sixties. Retrieved October 18, 2014.
- ↑ The American Midwest. Retrieved October 18, 2014.
- ↑ "Lackawanna & Johnstown: Shutdowns, Steel Towns and the Union" (PDF). Digitalcommons.ilr.cornell.edu. Retrieved 18 October 2014.
- ↑ "Material Life : The 1960s" (PDF). Economicadventure.org. Retrieved 18 October 2014.
- ↑ Archived February 11, 2014, at the Wayback Machine.
- ↑ Politics of Numbers, The. Retrieved October 18, 2014.
- ↑ "The 40-Year Slump". The American Prospect. Retrieved October 18, 2014.
- ↑ https://books.google.com/books?id=lK2SAgAAQBAJ&pg=PA244
- ↑ https://books.google.com/books?id=MVAGOBxIwkcC&pg=PA301
- ↑ Poverty in the United States: an encyclopedia of history, politics, and policy, Volume 1 by Gwendolyn Mink and Alice O'Connor, P.41
- ↑ The New Geography of Jobs. Books.google.co.uk. Retrieved October 18, 2014.
- ↑ The Unfinished Journey: America Since World War II by William H. Chafe
- ↑ The Obama Presidency. Retrieved October 18, 2014.
- ↑ Mysteries of Sex: Tracing Women and Men through American History. Retrieved October 18, 2014.
- 1 2 3 http://www.nytimes.com/2014/04/23/upshot/the-american-middle-class-is-no-longer-the-worlds-richest.html?_r=0
- ↑ Dollars and Dreams: The Changing American Income Distribution by Frank Levy
- ↑ Conquest of Poverty, The. Ludwig von Mises Institute. Retrieved October 18, 2014.
- ↑ Britannica Book of the Year 1971, Encyclopaedia Britannica, Inc., William Benton (Publisher)
- ↑ http://www.nytimes.com/1982/04/20/business/us-living-standard-found-highest.html
- ↑ http://www.nytimes.com/2014/04/23/upshot/this-simple-table-summarizes-our-story-on-american-living-standards.html
- ↑ Time-Life Books, Library of Nations: United States, Sixth European English language printing, 1989
- ↑ Archived December 17, 2013, at the Wayback Machine.
- ↑ "US Census Bureau, income quintile and top 5% household income distribution and demographic characteristics, 2006". Retrieved December 28, 2006.
- 1 2 "CIA factbook, US gini index". Retrieved January 4, 2007.
- ↑ "CIA factbook, EU gini index". Retrieved January 4, 2007.
- ↑ "CIA factbook, Germany gini index". Retrieved January 4, 2007.
- ↑ http://money.cnn.com/2014/06/11/news/economy/middle-class-wealth/
- ↑ "Rich-Poor Gap Widening". Retrieved July 27, 2006.
- ↑ "Rich-poor gap gaining attention". Retrieved July 27, 2006.
- ↑ https://www.stratfor.com/weekly/crisis-middle-class-and-american-power
- ↑ "Canada Home Ownership". Financial Post. August 18, 2012. Retrieved October 18, 2014.